RMAX - Navigating Real Estate's Uncharted Terrain: A Closer Look At RE/MAX
2023-10-20 14:41:58 ET
Summary
- RE/MAX Holdings Inc. has underperformed the S&P 500, with its stock falling 44% compared to a 12% rise in the S&P.
- The recent drop in RE/MAX's stock has caused a surge in its dividend yield, which now sits at 8.68%.
- The company's profitability and debt management are key factors to consider when assessing its financial health and ability to weather potential risks in the real estate market.
In the realm of real estate, a few names resonate as strongly as RE/MAX Holdings Inc. (RMAX)
As a franchisor of real estate brokerage services, RE/MAX has not only carved its name in the industry but has also embraced the ever-evolving landscape with an unwavering spirit of empowerment.
This article embarks on a journey to explore the fundamental aspects, market positioning, and the overarching theme of adaptability that guides RE/MAX through the twists and turns of the real estate industry - especially in the current market environment.
The stock has vastly underperformed the S&P 500 Year to Date (YTD), falling 44% compared to a 12% rise in the S&P.
Meanwhile, its recent drop caused a surge in its dividend yield, which now sits at 8.68%.
Y Charts
This underperformance may have you bottom-fishing, or simply fishing for that juicy yield as the stock trades lower.
However, is the risk worth the yield?
Unpacking the Fundamentals
Let's kick off our analysis by delving into the fundamental metrics that underpin RE/MAX's performance.
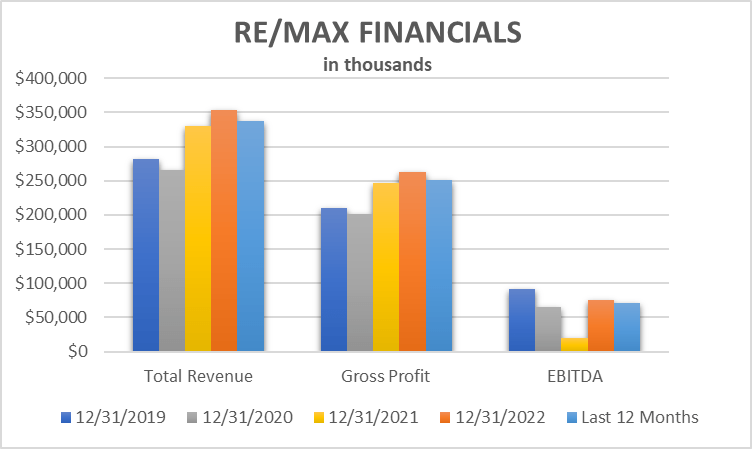
It all begins with revenue, the lifeblood of any business. For RE/MAX, consistent revenue growth signifies a robust business environment. In the unpredictable cycles of real estate, sturdy revenue growth acts as a buoy, providing stability even when the market faces turbulence from rising mortgage rates and inflation.
In the last four years, revenue growth has trended higher, with a dip in 2020. The last twelve months, up to June 30, 2023, revenue is also pacing lower than in 2022 but remains above the 2021 revenues for the time being.
Beyond the numbers, profitability plays a crucial role. Healthy profit margins suggest that RE/MAX can efficiently convert revenue into profit.
Gross Profit is following a similar trend as total revenues, while EBITDA is holding steady for the most part.
EBITDA took a hit in 2021 but remains on par with 2020, and 2022 numbers for the twelve months ending June 30, 2023.
In terms of market perception, the Price-to-Earnings (P/E) ratio can provide insight into investors' expectations. A low P/E ratio might indicate an undervalued stock, while a high P/E ratio suggests elevated investor optimism. Striking the right balance is the crux.
RE/MAX is in the category of high P/E, there's no question about it.
With revenues, gross profit, and EBITDA holding up in the chart above, it is a bit shocking to see the struggles the stock has experienced, which is causing the sharp rise in the price-to-earnings ratio.
For some perspective, the average P/E ratio for the S&P 500 is 24.42 . Some of RE/MAX's peers, the companies we are using below, mostly have negative earnings which means we could not measure a price-to-earnings ratio.
This brings us to where RE/MAX could be headed next - not profitable.
RE/MAX is currently generating a profit. The company has done a good job of making sure that is the case, by focusing on growth projects such as wemlo on the mortgage side and the Motto franchise, while managing costs in the face of higher interest rates and tight housing inventory on the market.
Managing liabilities is another cornerstone. High debt levels can be a double-edged sword, especially in an industry that rides the ups and downs of the economy. A careful examination of RE/MAX's debt load and its management is pivotal in assessing its financial health.
This also shifts focus to income-seeking investors when we talk about Dividend Yield. It's not just about the yield itself, but also the sustainability of dividend payments. This ties into the overarching concept of debt, cash flows and liquidity.
The quick ratio is 1.43, indicating it can cover its short-term cash needs. RE/MAX has strong liquidity, based on cash and short-term investments of $108.7MM. Free cash flow remains positive as well and has been for the past four years. This is despite buying back stock in 2022.
This all indicates that the company can manage its current debt levels and dividend needs in the near term, but whether it decides to make a change on the dividend could come down to other factors as the stock is in decline.
Industry Comparison
Real estate, like a ship on a stormy sea, is profoundly influenced by external factors such as housing market trends and interest rates. To gauge RE/MAX's performance accurately, we must compare it against industry benchmarks. These benchmarks act as the compass guiding the ship safely through the treacherous waters of the real estate world.
Key Metrics Relative to the Industry
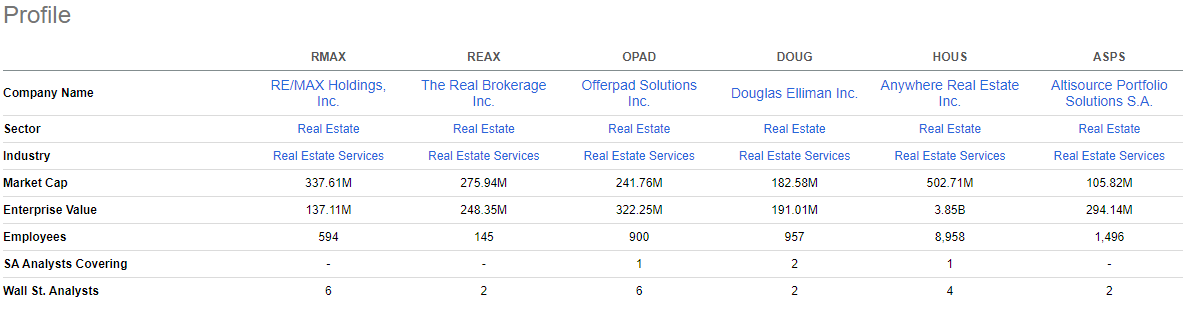
We will be comparing RE/MAX to these five companies to get an idea of how it is performing against its peers.
The two areas I want to look at are profitability and risk.
I know I mentioned that these comparison companies are largely not profitable. So, to gauge profitability for comparison's sake, I will be looking at their EBITDA Margin percentage based on the trailing twelve months.
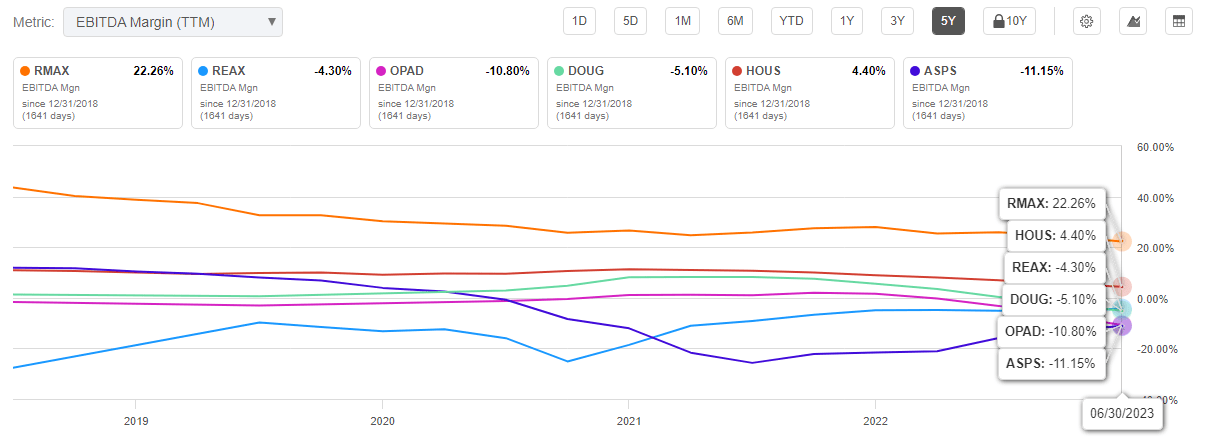
EBITDA Margin ('TTM') Comparison - 5YR
RE/MAX is at the top, which was to be expected. However, the overall trend here is worrisome - specifically for RE/MAX.
I just mentioned how RE/MAX may be trending towards not being profitable in the coming quarters or years. This declining trend in EBITDA margin doesn't give us hope that the company will avoid that fate.
It has a bit of a buffer, at 22.26%. So, there is some good news here. This is just a trend you want to watch and look for it to stabilize going forward.
Key Risks
There are multiple key risks impacting the real estate sector related to RE/MAX. Here are a few key risks to keep an eye on in this market environment. Then we'll take a quick look at how well RE/MAX is positioned to weather these potential risks.
1. Economic Downturn: The real estate market can be sensitive to economic downturns. There are heightened risks of a recession in the U.S. economy due to higher interest rates that would have a negative effect on the real estate market. The industry is already battling tight supply and increased mortgage rates, a recession would be a main risk to watch.
2. Interest Rates: As I mentioned, interest rates are already having a negative impact on the real estate industry, but there seem to be no signs of rates decreasing in the near future. With this directly impacting mortgage rates, it means this headwind for the sector is likely to stay around for a little bit longer. As such, it remains a key risk.
3. Competition: The competition in the real estate market is like a fierce storm, with RE/MAX pitted against other brokerage firms and online platforms like Zillow and Redfin. This is nothing new, but innovation continues to flip industries that haven't adapted to the times on their head. RE/MAX is working to stay ahead of these changes, but it remains an elevated risk thanks to technological advancements.
With all of that said, let's dive into some data and see how RE/MAX stacks up to its peers in terms of managing risks.
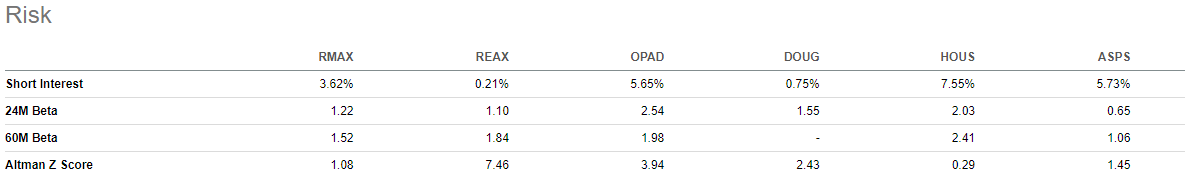
This chart gives us the short-interest, 24-month beta, 60-month beta, and Altman Z Score.
The first one is a sentiment reading really. It tells us what percentage of the stock's float is sold short. Extremely high, and investors are pessimistic. RE/MAX is right in the middle of its peers and would be considered low generally speaking.
Investors are not overly pessimistic about the stock, but this doesn't mean they are overly optimistic either. It is a neutral reading when short interest is low.
The next two indicators of risk, the 24-month beta, and 60-month beta, give us a look at volatility in the share price. Over 1, and it is more volatile than the broad stock market. That's the case for RE/MAX. Only one of its peers are under 1, while RE/MAX falls in at about the mean of the group.
Again, nothing concerning here.
Lastly, the Altman Z Score. This is an indicator that helps to determine if a company is likely going toward bankruptcy in the next two years.
A Z score above 3 signals a healthy company. Only two of the six companies we are looking at met that mark.
A Z score below 1.8 indicates a high risk of bankruptcy in the next two years.
This is where RE/MAX, along with two of its peers, find themselves.
It's very concerning at this point.
The Bottom Line
If the economy can continue to avoid a recession and interest rates begin to decline, even slightly, the fundamentals of RE/MAX can improve significantly.
On the other hand, if there is an economic recession, or more pain caused by elevated interest rates, that could spell doom for RE/MAX as it continues to struggle to remain profitable.
The bottom line today is that RE/MAX's juicy dividend yield and beaten-down stock price may not be worth the risk.
Remember that, in this ever-changing world, staying informed and being prepared is the key to making informed investment decisions.
For further details see:
Navigating Real Estate's Uncharted Terrain: A Closer Look At RE/MAX