CA - New Gold: Production Came To The Rescue Against All Odds
2023-10-06 12:08:46 ET
Summary
- New Gold Inc. released its third quarter 2023 operational results, showing a 22.2% increase in gold equivalent production compared to the previous year.
- The company's stock performance improved after the release of strong production numbers, with potential for further appreciation if gold prices turn bullish.
- I recommend buying New Gold Inc. between $0.91 and $0.89, with potential lower support at around $0.85.
Introduction
On October 5, 2023, Canada-based New Gold Inc. (NGD) released its third quarter 2023 operational results ending September 30, 2023.
Note: This article updates my article published on August 19, 2023. I have been following New Gold on Seeking Alpha since 2019.
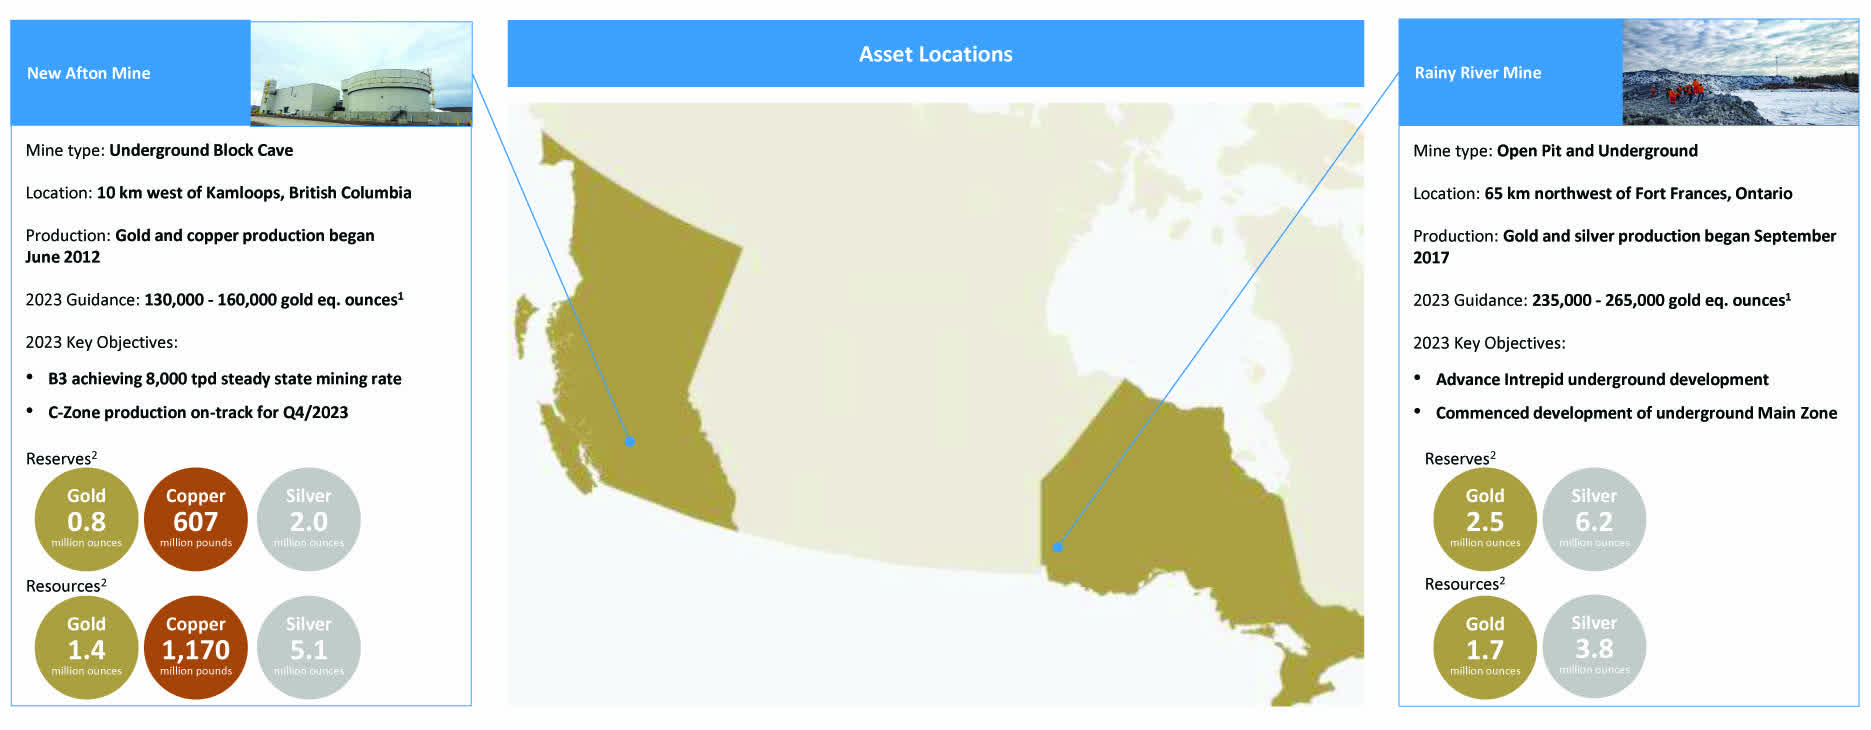
NGD Assets Map (NGD September Presentation )
Note: Consolidated Mineral Reserves decreased by approximately 385K gold ounces compared to the prior year.
1 - Third-quarter production release commentary
Gold equivalent production was solid this quarter, with 111,204 GEOs, up 22.2% compared to the third quarter of 2022 of 91,021 GEOs. Production per GEOs was up 8.6% sequentially.
CEO Patrick Godin said in the press release:
We had a strong third quarter, with both operations continuing to achieve consistent quarterly production. Operationally, we delivered solid production results of 111,204 gold equivalent ounces, a 22% increase over the prior year period. We remain on track to meet our annual production guidance,
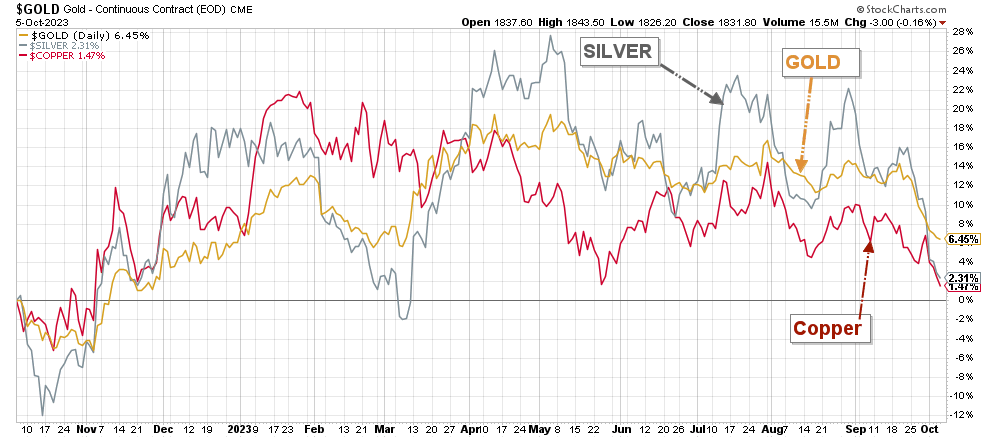
Unfortunately, weakening gold, silver, and copper prices partially offset this solid production. Gold is now up 6.5% on a one-year basis after tumbling the past few weeks.
NGD 1-Year Chart Gold, Silver, Copper (Fun Trading StockCharts)
2 - Stock Performance and commentary
New Gold Inc. recovered strongly after releasing its Q3 2023 operational results ending September 30, 2023. Strong production numbers were the catalyst that prevented NGD from tumbling to new lows despite an industry under strong selling pressures.
This steady production improvement is quite encouraging and could result in a significant stock appreciation in 2024 if the gold price turns bullish, as expected if the FED turns dovish and signals a long pause or even a potential cut toward the end of 2024, which is a big if now.
3Q23 Gold equivalent production analysis
1 - The raw numbers
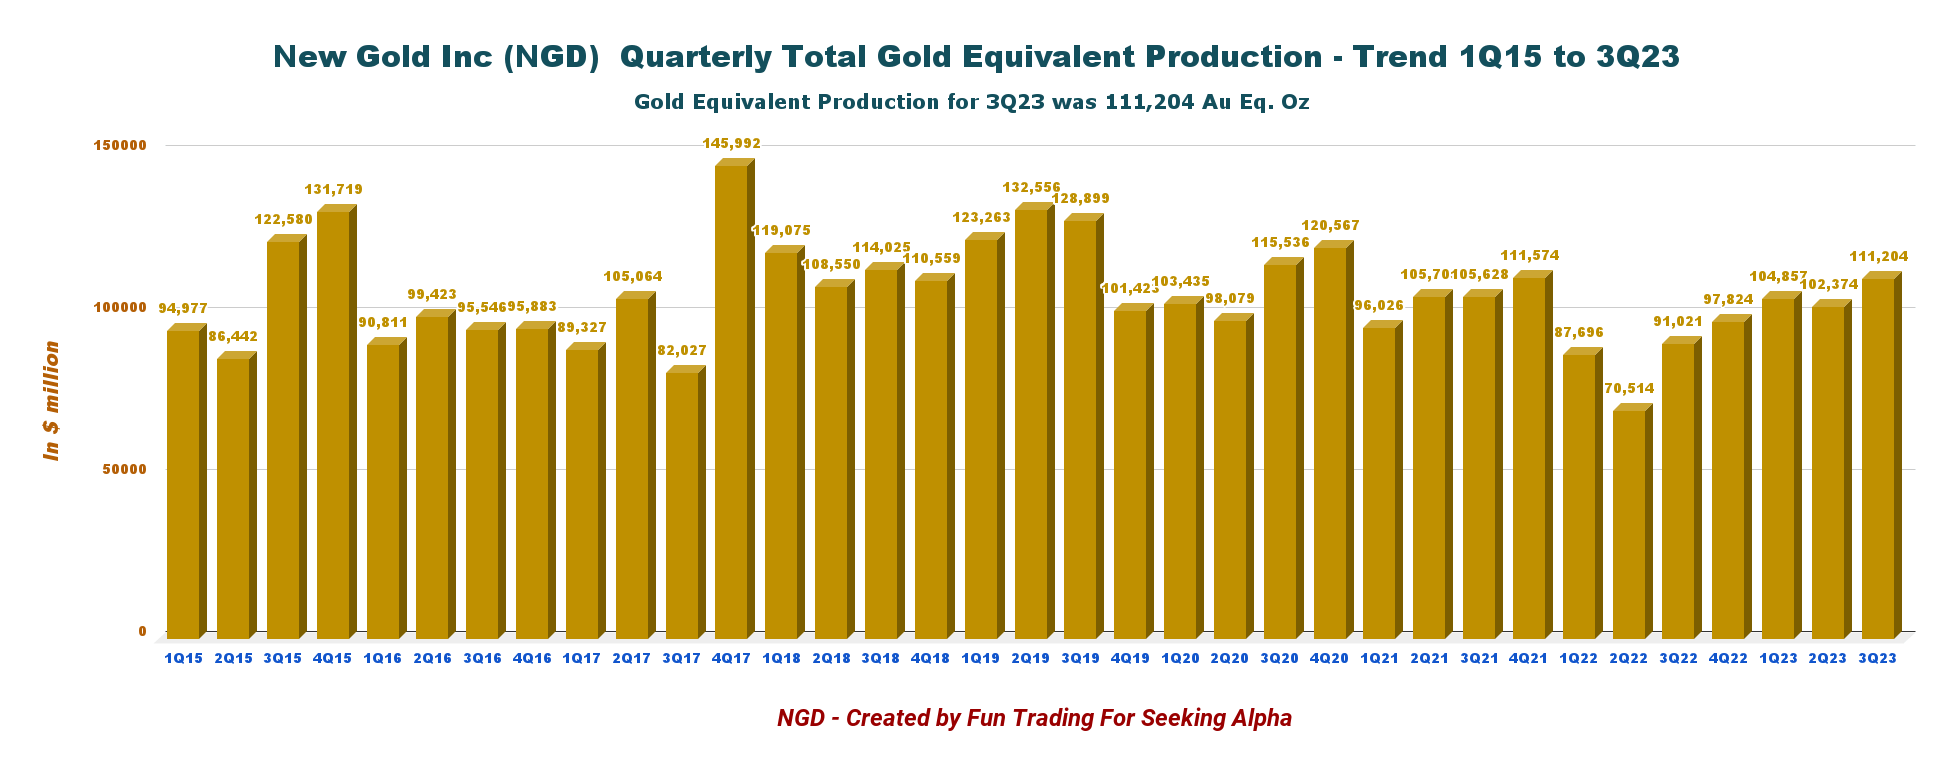
NGD Quarterly GEO Production History (Fun Trading)
NGD announced on October 5, 2023, that it produced 111,204 GEOs during the third quarter of 2023, up 22.2% compared to 3Q22 and up 8.6% sequentially. As we can see in the chart above, GEO production has been increasing steadily since the low in 2Q22.
The production of gold equivalent ounces [GEO] includes gold, silver, and copper. Below are the details:
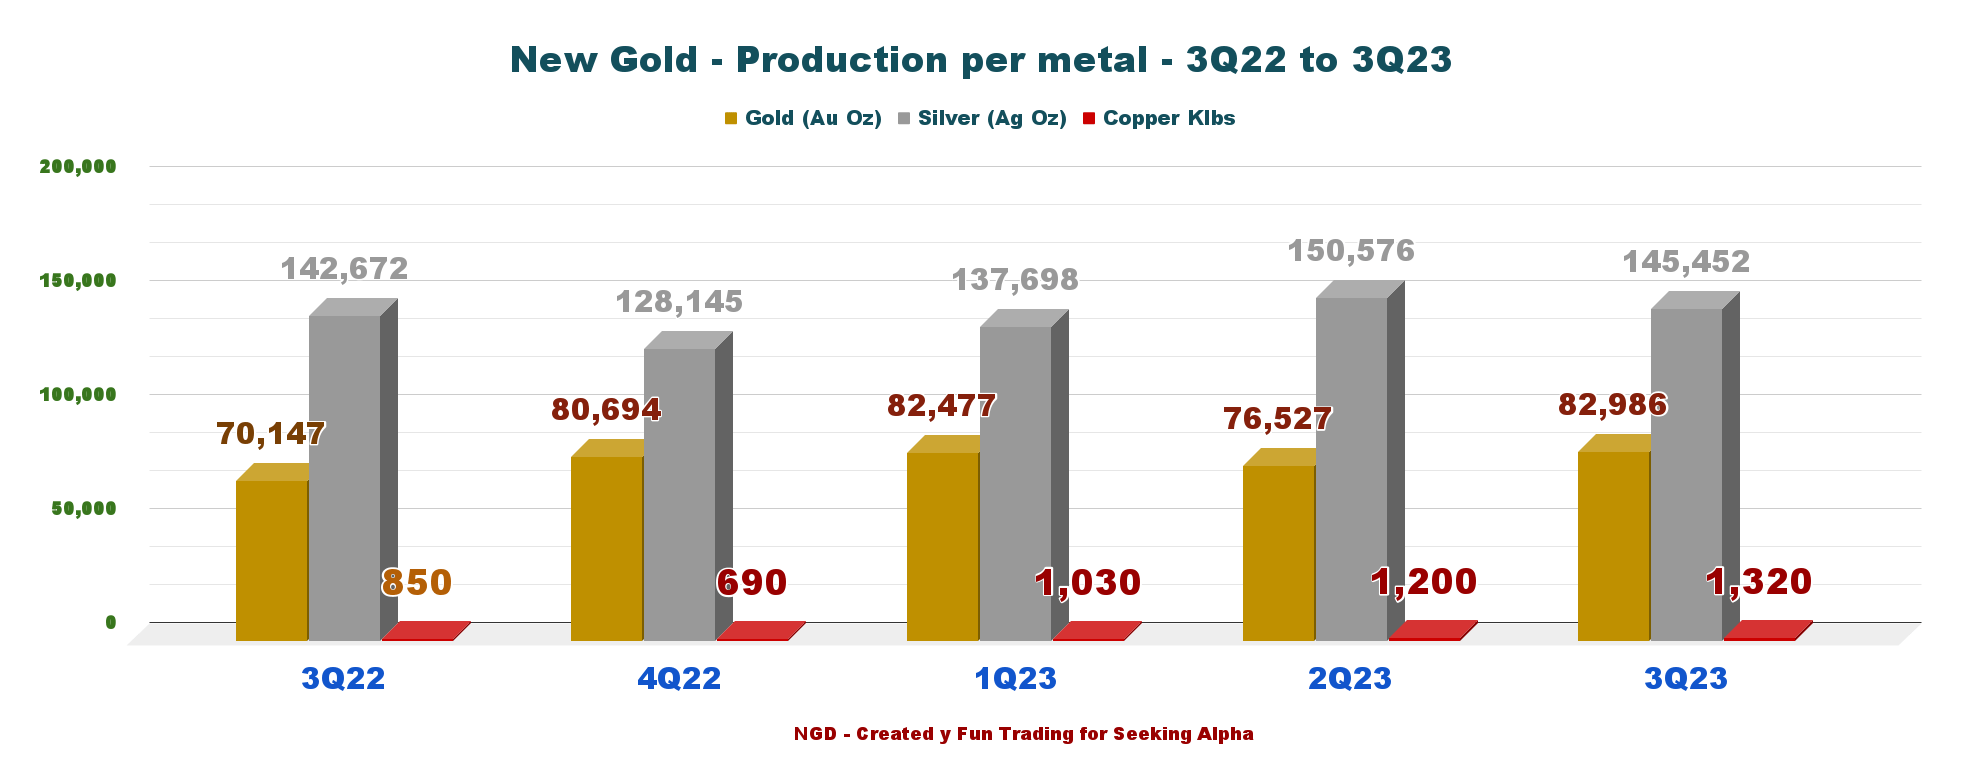
- Gold production was 82,986 Au oz, Sold 79,821 Au Oz
- Silver production was 145,452 Ag oz, Sold 139,591 Ag Oz
- Copper production was 13.2 M Pounds, Sold 13.0 M Pounds.
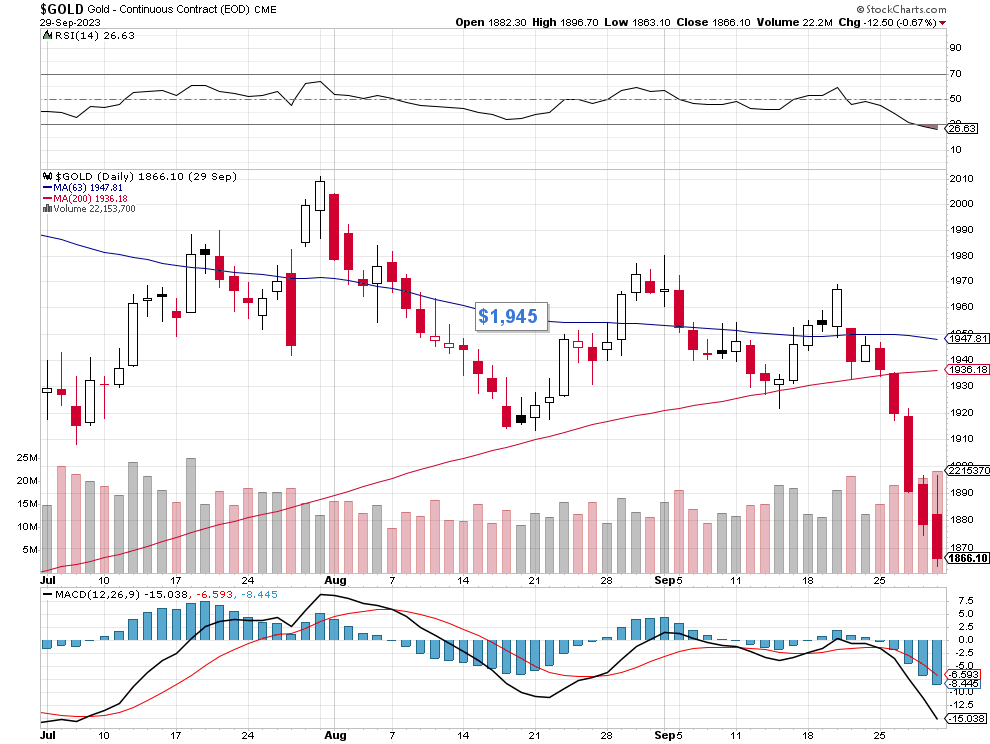
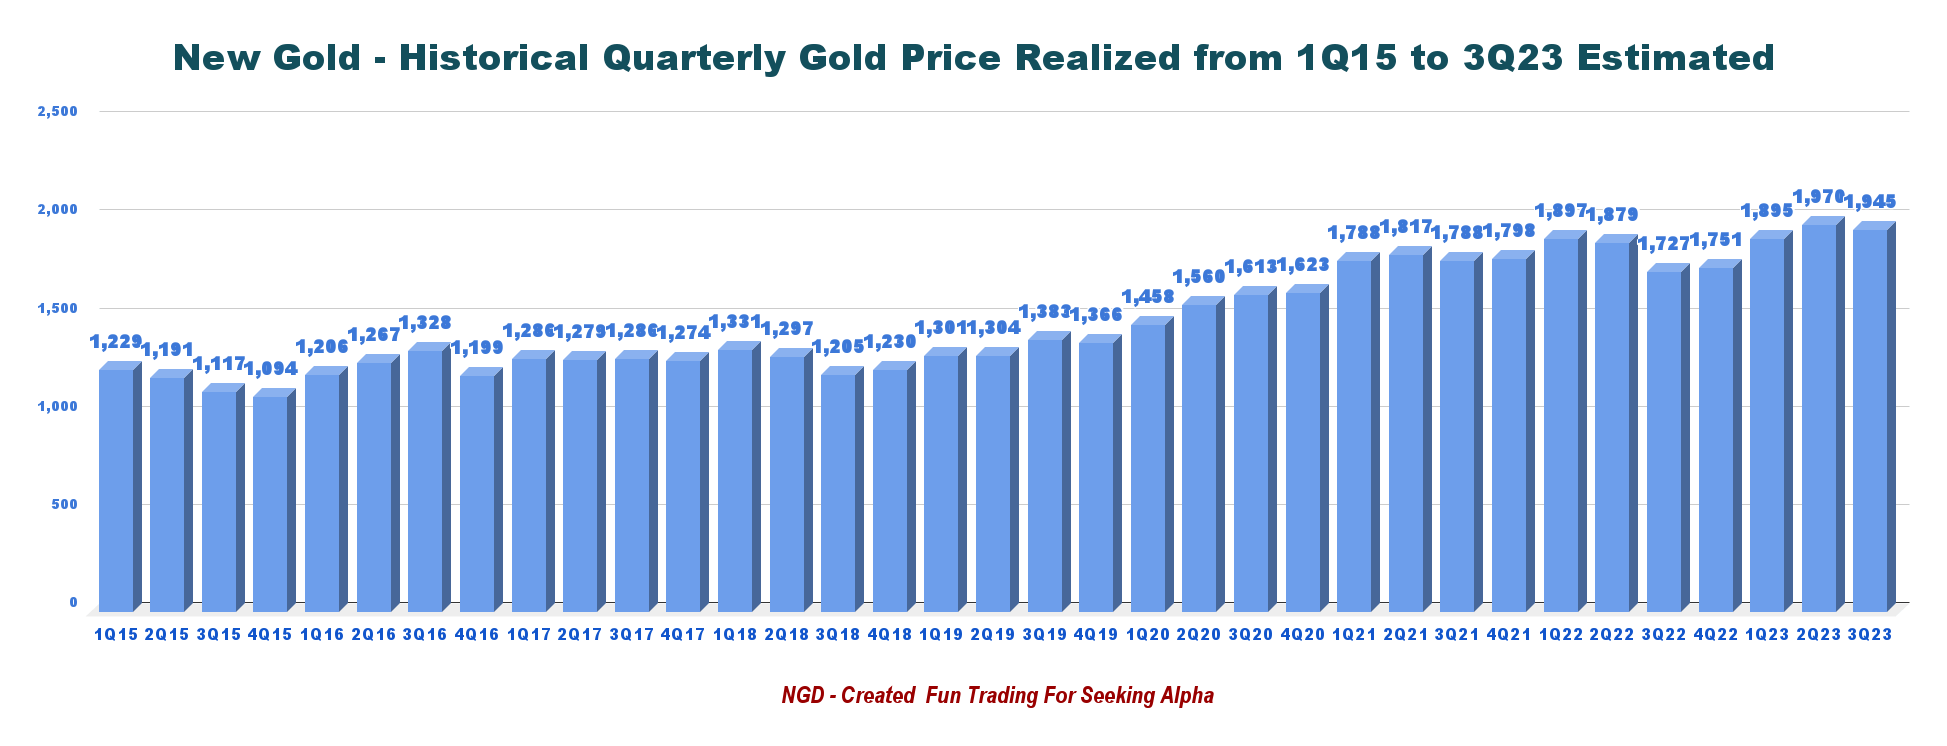
Note: I have estimated the gold price at $1,945 per ounce in 3Q23 (63 trading days).
NGD Gold chart and MA63 (Fun Trading StockCharts)
Below is the Quarterly Gold Price Realized since Q1 2015.
NGD Quarterly Gold Price History (Fun Trading)
Below is shown the production for the last five quarters and per metal:
NGD Quarterly Production per Metal 3Q22 to 3Q23 (Fun Trading)
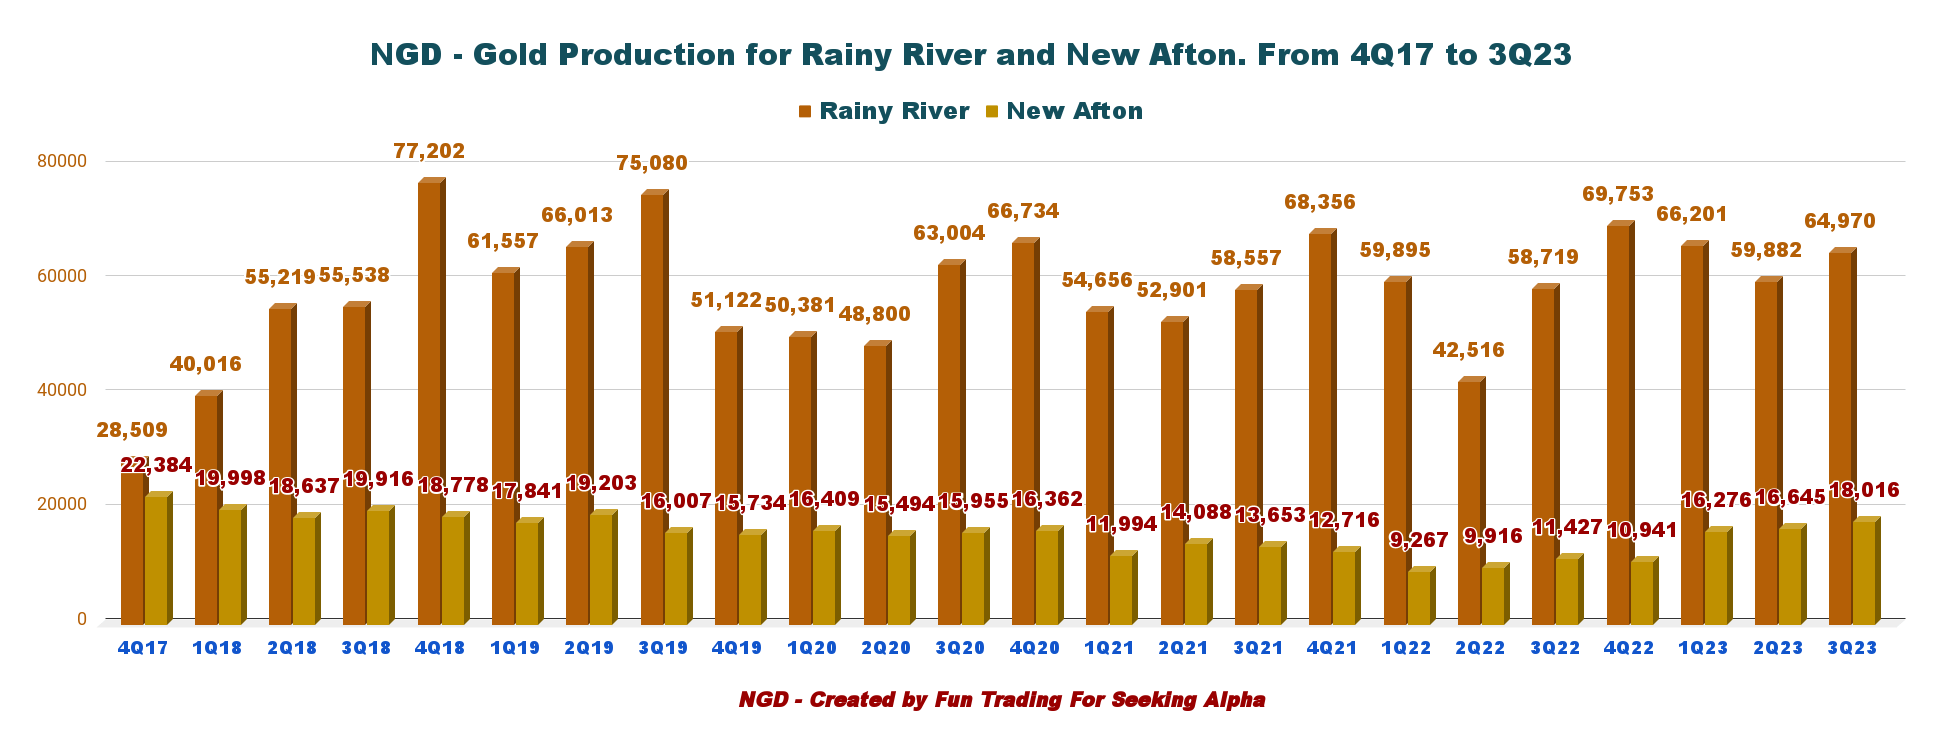
Gold production for the Rainy River mine was 64,970 Au ounces, and 18,016 Au ounces for the New Afton mine.
- At New Afton, gold, silver, and copper production improved nicely over the same period last year, as the operation's focus remained on steady-state mining of B3 and C-Zone development, which remains on track for first ore production in 4Q23. Tonnes mined per day (ore and waste) was 9,790 TPD. NGD indicated that it successfully blasted the first draw bell from C-Zone, an important milestone in delivering significant production growth in the coming years. The mine exceeded outlook as mining from B3 continues to perform above expectations.
- At Rainy River, production was in line with the plan. The company indicated that it continues to advance the connection ramp to the underground Main Zone from called Intrepid.
Gold production is back to a solid level, as shown in the graph below:
NGD Quarterly Gold Production per Mine History (Fun Trading)
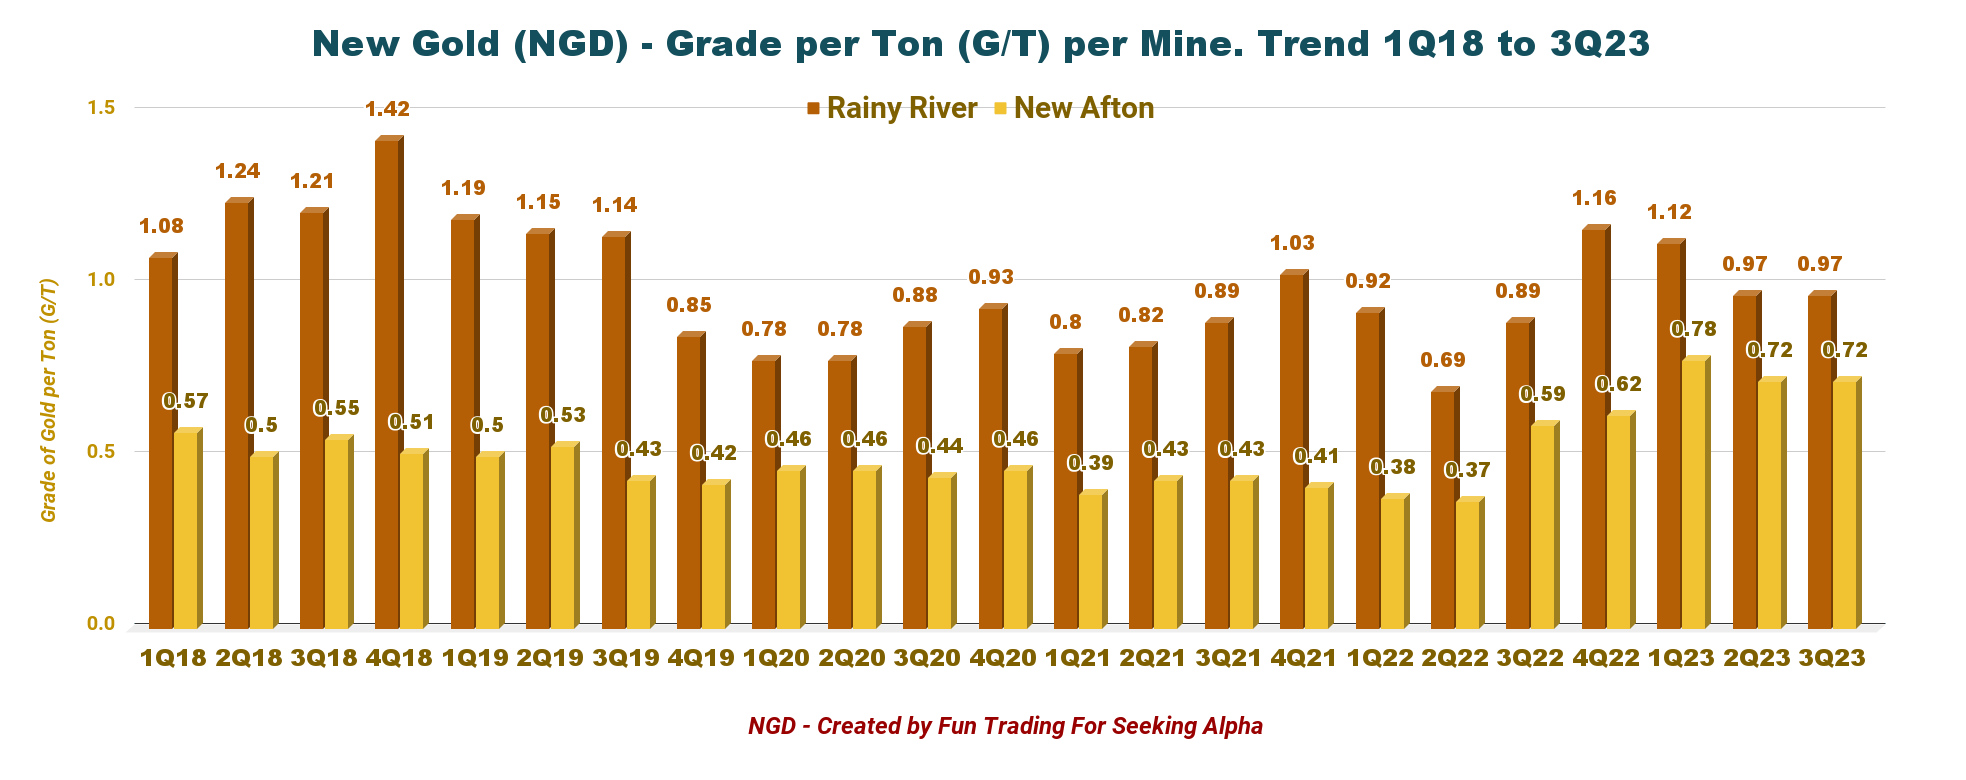
The gold grade per tonne has not changed sequentially at the Rainy River with 0.97 G/T and at New Afton with 0.72 G/T
NGD Quarterly Grade per Ton per Mine History (Fun Trading)
2 - 2023 Guidance unchanged
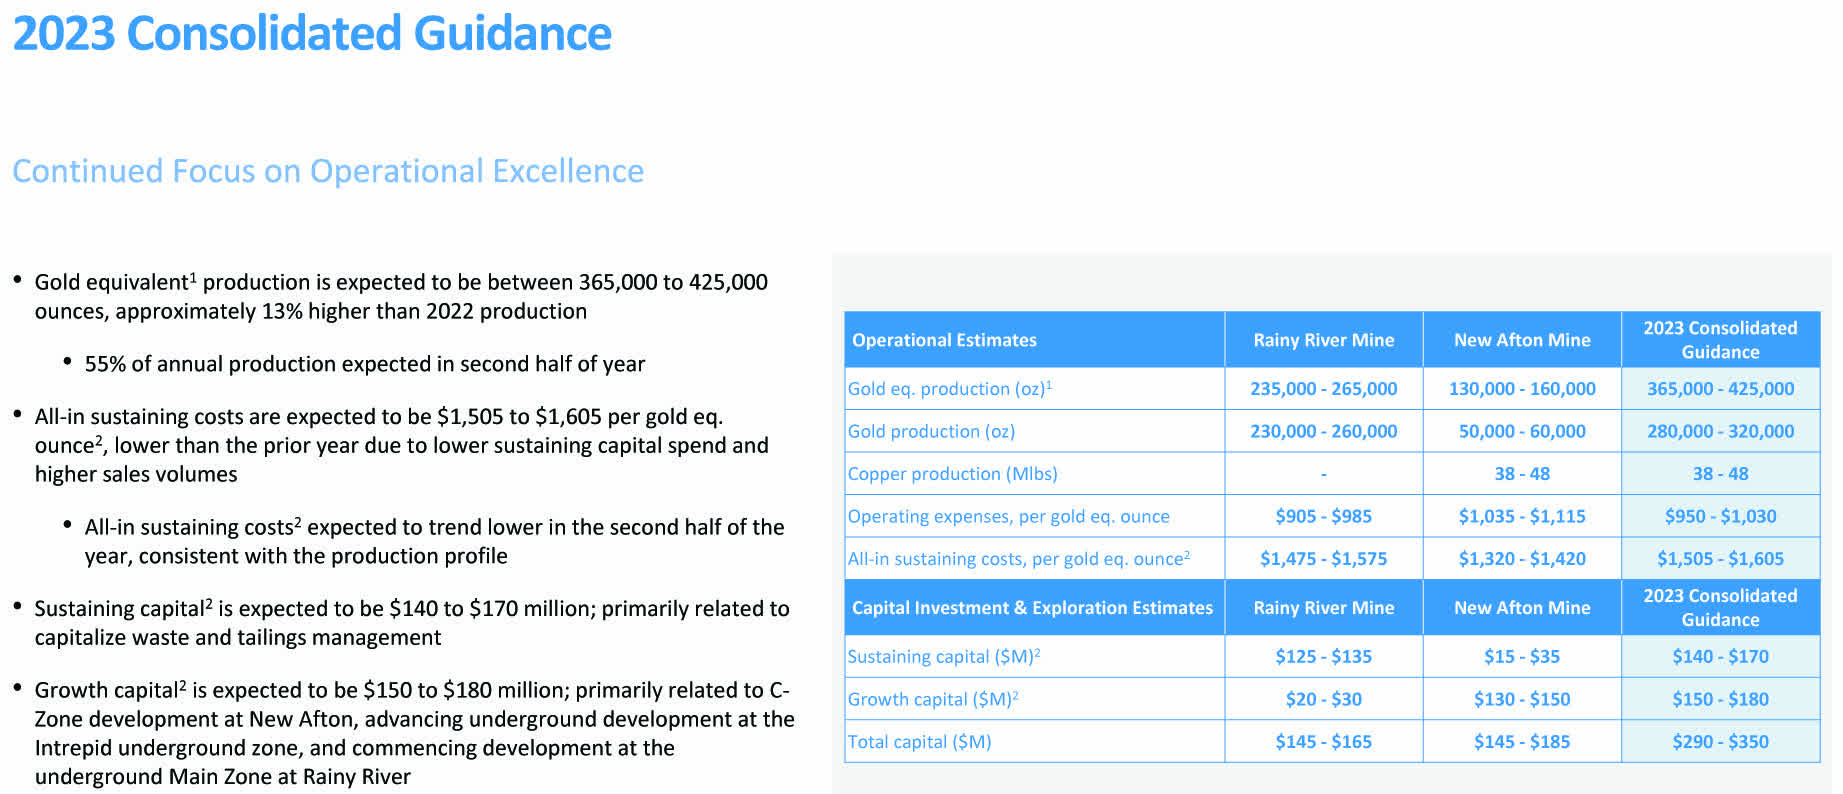
Gold equivalent production is expected to be between 365K to 425K ounces , approximately 13% higher than 2022 production, with 55% of the annual output expected in the year's second half.
AISC is expected to be $1,505 to $1,605 per GEO, down from the prior year due to lower sustaining capital spend and higher sales volumes.
NGD 2023 Guidance (NGD Presentation September)
Technical analysis and commentary
NGD TA Chart (Fun Trading StockCharts)
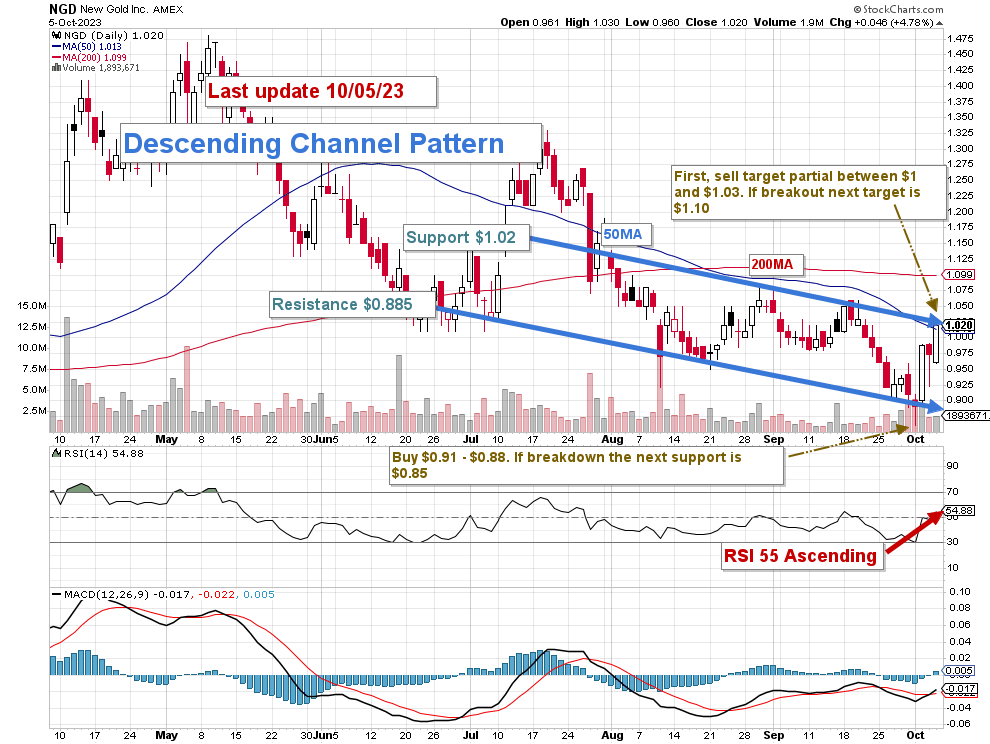
NGD forms a descending channel pattern with resistance at $1.02 and support at $0.885 . RSI is now 55, which indicates that NGD could eventually reach $1.09-$1.10 , assuming a bullish gold price.
Descending channel patterns are short-term bearish in that a stock moves lower within a descending channel, but they often form within longer-term uptrends as continuation patterns. The descending channel pattern is often followed by higher prices, but only after an upside penetration of the upper trend line. The stock will continue channeling downward until it is able to break either the upper or lower trend line.
The strategy is to trade LIFO about 60% of your position and keep a medium core long-term for a better payday above $1.40.
I recommend accumulating between $0.91 and $0.89 , with potential lower support at around $0.85.
NGD recovered from its recent lows and seemed to be moving in correlation with the gold price, which has reached potential lower support at $1,815 per ounce and hopefully is ready to bounce back. I expect the FED to raise interest rates one more time in 2023-2024 and then pause, likely pushing gold higher, despite a still hawkish position announced by Jerome Powell.
Conversely, I recommend taking profits between $1.00 and $1.03, with higher resistance at $1.10.
Watch the gold price like a hawk.
Warning: The TA chart must be updated frequently to be relevant. It is what I am doing in my stock tracker. The chart above has a possible validity of about a week. Remember, the TA chart is a tool only to help you adopt the right strategy. It is not a way to foresee the future. No one and nothing can.
For further details see:
New Gold: Production Came To The Rescue Against All Odds