CA - New Gold: Solid Production This Quarter
2023-07-12 14:01:00 ET
Summary
- New Gold Inc. gold equivalent production was solid this quarter, with 102,374 GEOs, up 45.2% compared to the second quarter 2022 of 70,514 GEOs.
- Gold equivalent production was solid this quarter, with 102,374 GEOs, up 45.2% compared to the second quarter 2022 of 70,514 GEOs.
- I recommend accumulating New Gold stock between $1.08 and $1, with potential lower support at around $0.95.
Introduction
On July 11, 2023, Canada-based New Gold Inc. ( NGD ) released its second quarter 2023 operational results ending June 30, 2023.
Note: This article updates my article published on May 1, 2023. I have been following New Gold on Seeking Alpha since 2019.
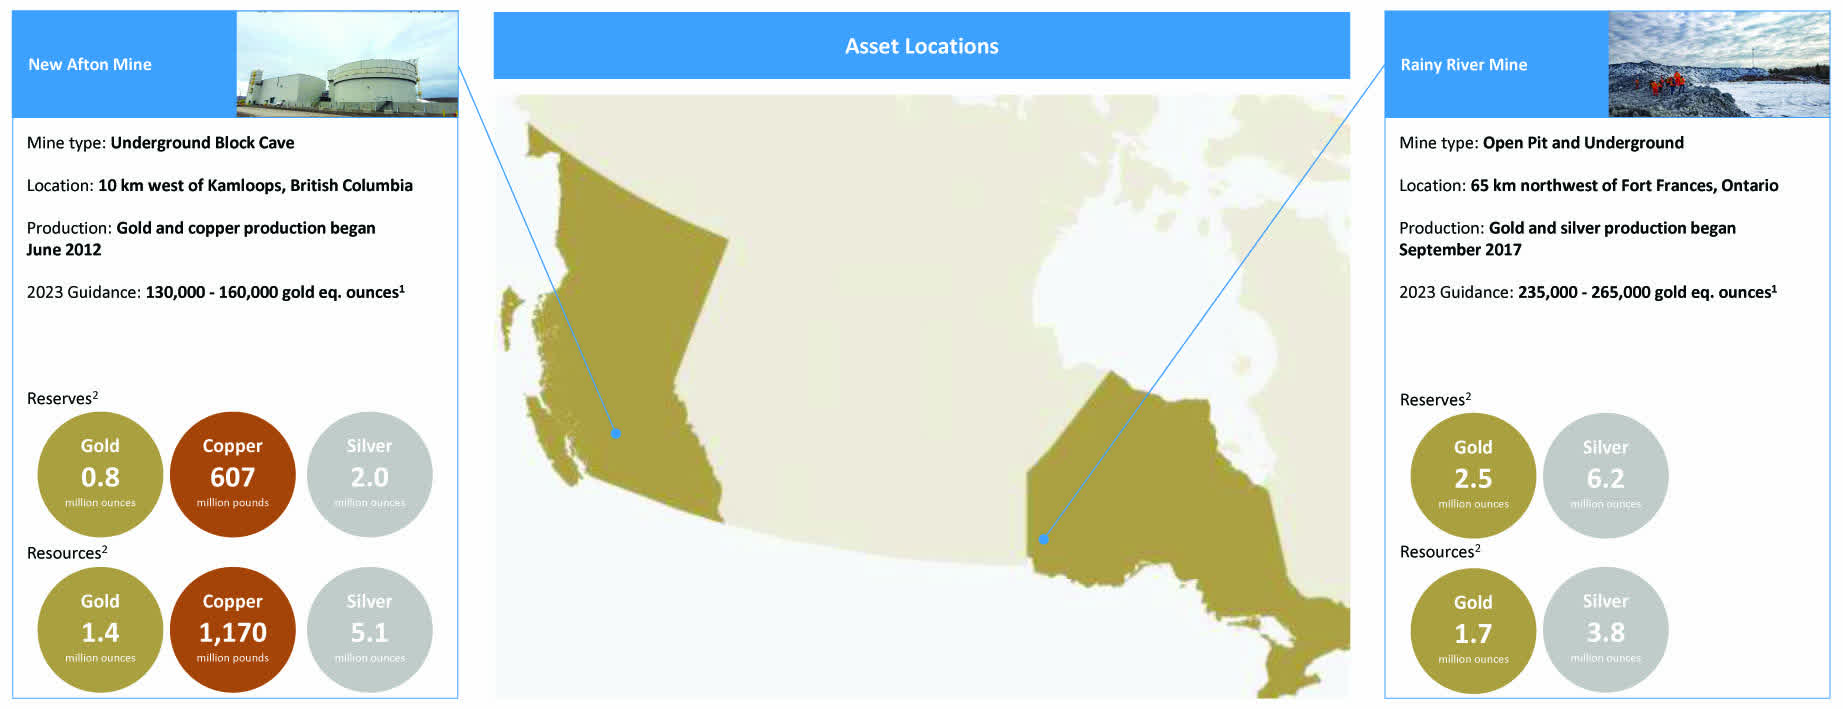
NGD Map Assets Presentation (NGD June Presentation)
Note: Consolidated Mineral Reserves decreased by approximately 385K gold ounces compared to the prior year.
1 - Second quarter production release commentary
Gold equivalent production was solid this quarter, with 102,374 GEOs, up 45.2% compared to the second quarter 2022 of 70,514 GEOs. However, production per GEOs was down 7.2% sequentially.
CEO Patrick Godin said in the press release:
At Rainy River, strong quarterly production results were attributed to higher mill availability due to the team's proactive measures taken during the planned maintenance activities. In addition to a great operating quarter, we continued to make meaningful progress advancing our growth initiatives, securing the future production of our Company. C-Zone development at New Afton continued and remains on-track for first ore production in the fourth quarter of this year, and development of the underground Main Zone at Rainy River has commenced as planned.
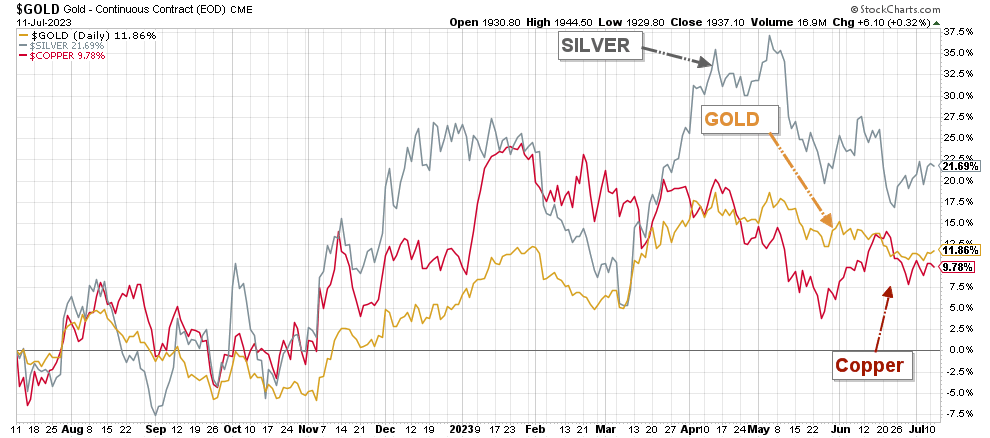
This solid production came with higher gold, silver, and copper prices. Gold is now up 12% on a one-year basis after retracing a little last month.
NGD 1-Year Chart Gold, Silver, Copper (Fun Trading StockCharts)
2 - Stock Performance
NGD has recovered from September 2022 and is now up 13.5% on a one-year basis.
Note: As a reminder, NGD closed at $0.71 in mid-July 2022 after announcing the production results in 2Q22, disclosing the weakness in the company's business model based on a few assets presenting definitive technical imperfections and unfortunate timing in execution. The issues have been resolved successfully.
2Q23 Gold production analysis
1 - The raw numbers
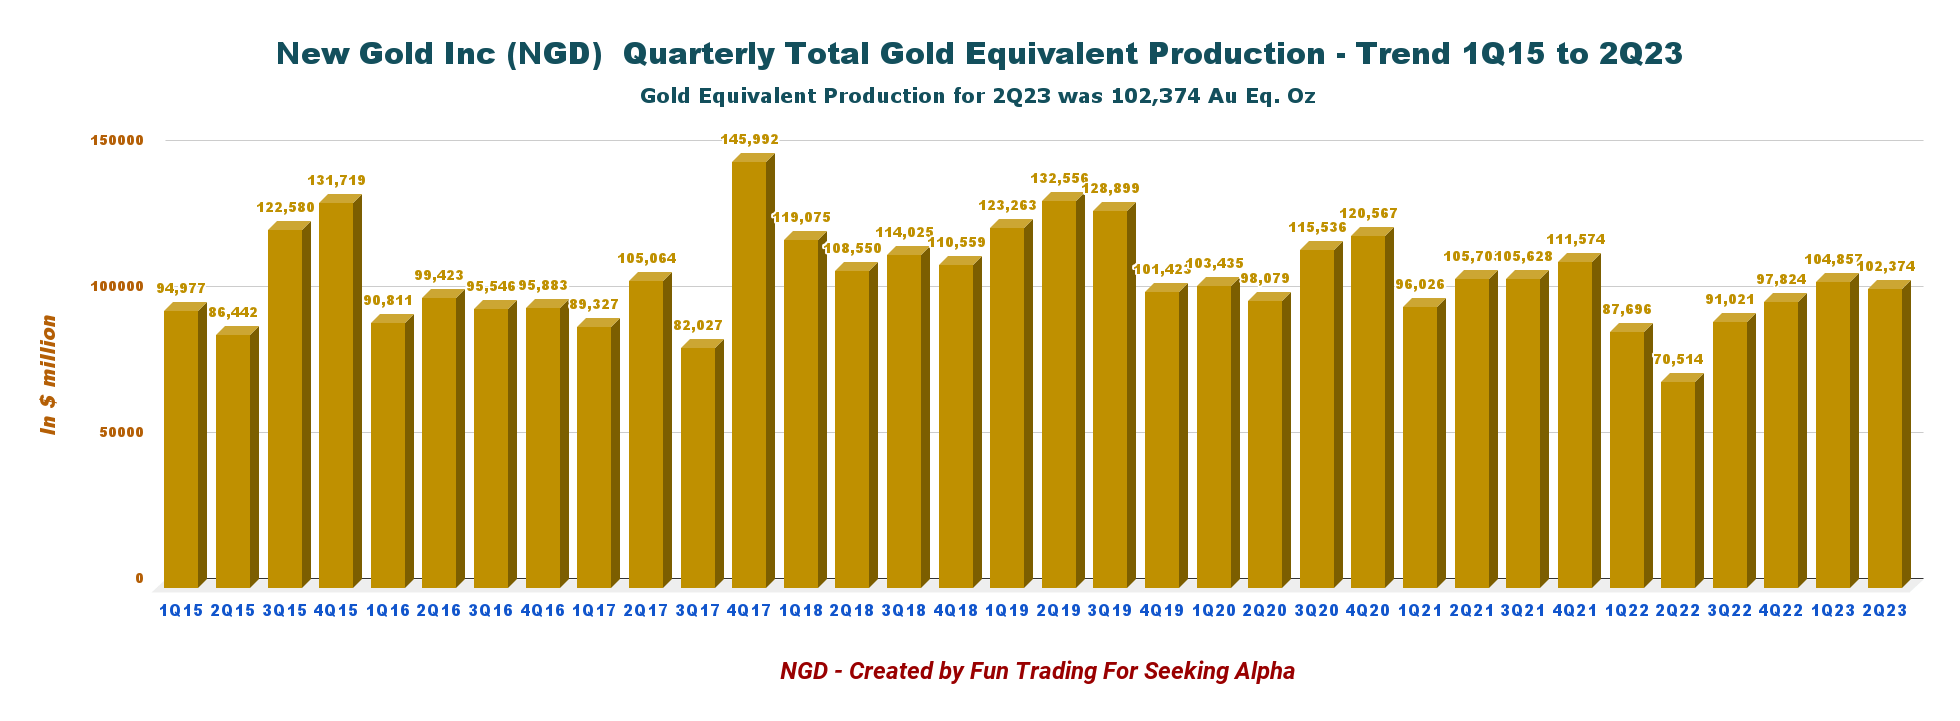
NGD Quarterly GEO Production History (Fun Trading)
NGD announced on July 11, 2023, that it produced 102,374 GEOs during the second quarter of 2023, up 45.2% compared to 2Q22 and down 2.4% sequentially. The production of gold equivalent ounces [GEO] includes gold, silver, and copper. Below are the details:
- Gold production was 76,527 Au oz.
- Silver production was 150,576 Ag oz.
- Copper production was 12.0 M Pounds.
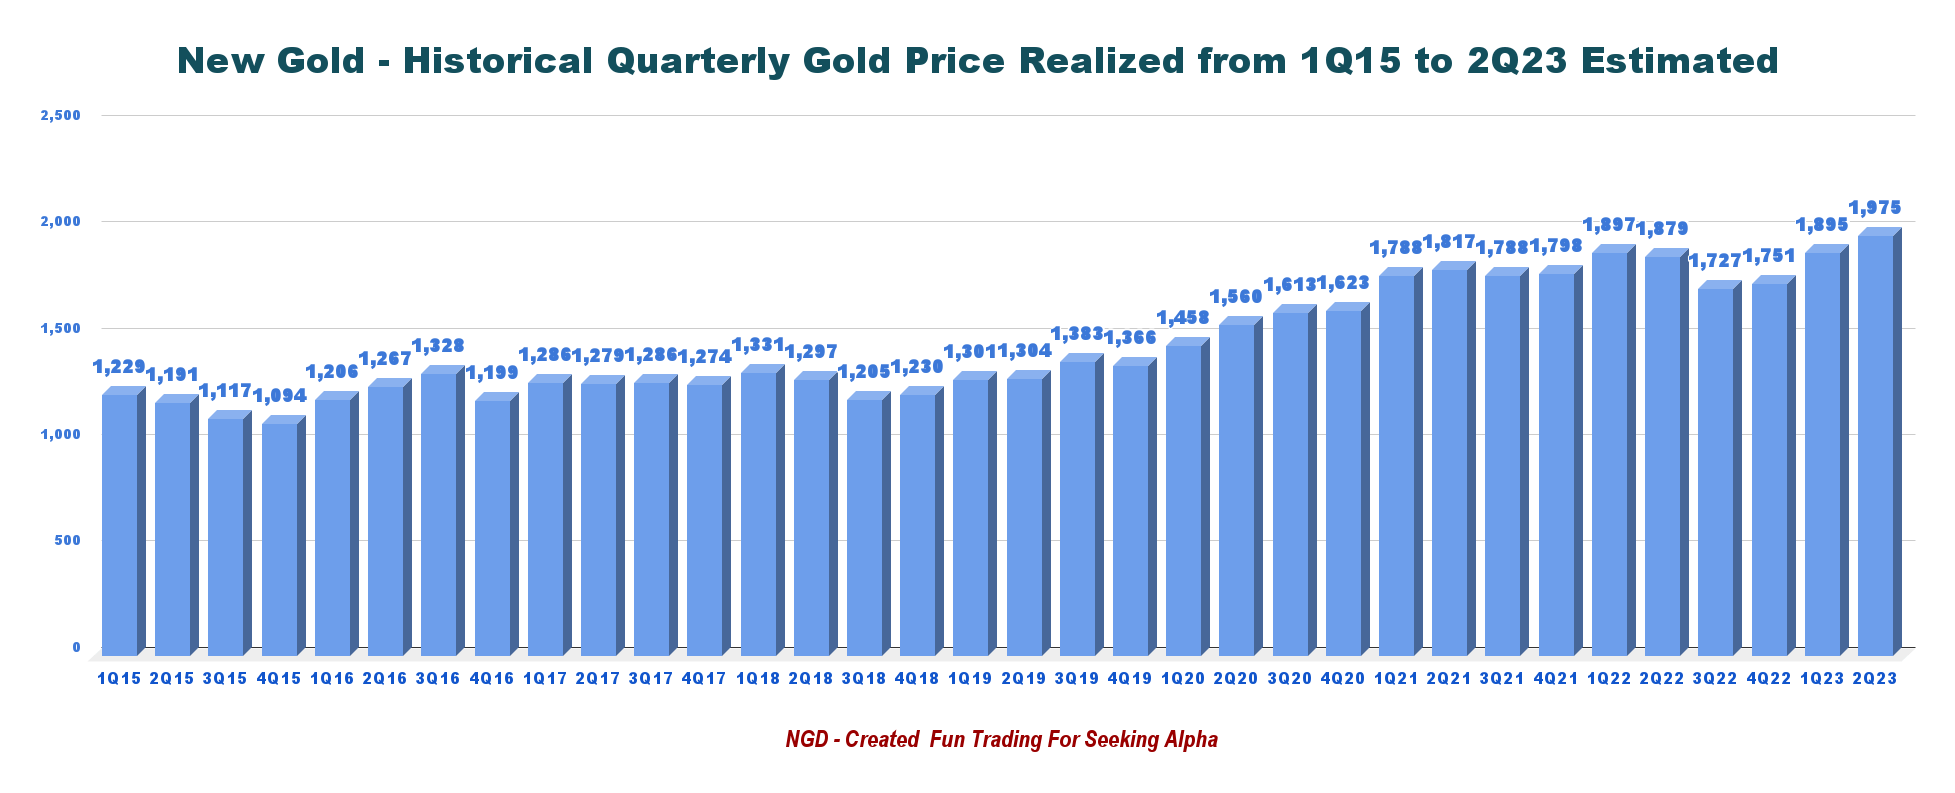
Note: The company did not indicate the amount sold in 2Q23. However, for those who want to estimate 2Q23 revenue, I have estimated the gold price at $1,975 per ounce in 2Q23, which is a record.
NGD Quarterly Gold Price History (Fun Trading)
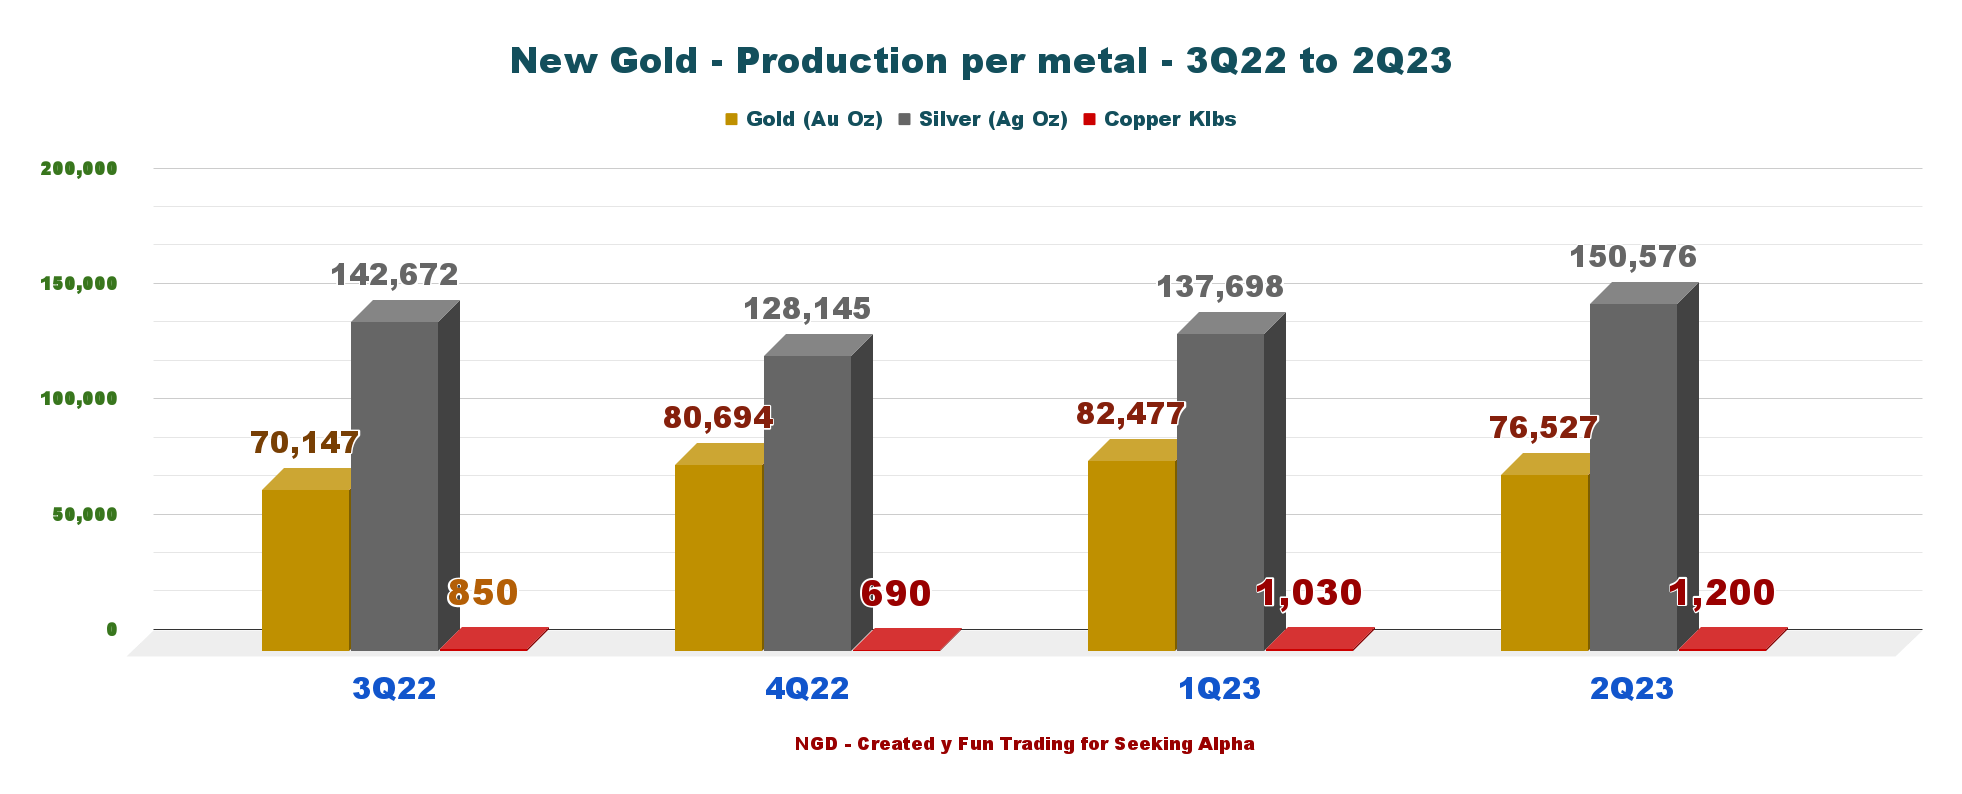
Below is shown the production for the last four quarters and per metal:
NGD Production detail per Metal 3Q22 to 2Q23 (Fun Trading)
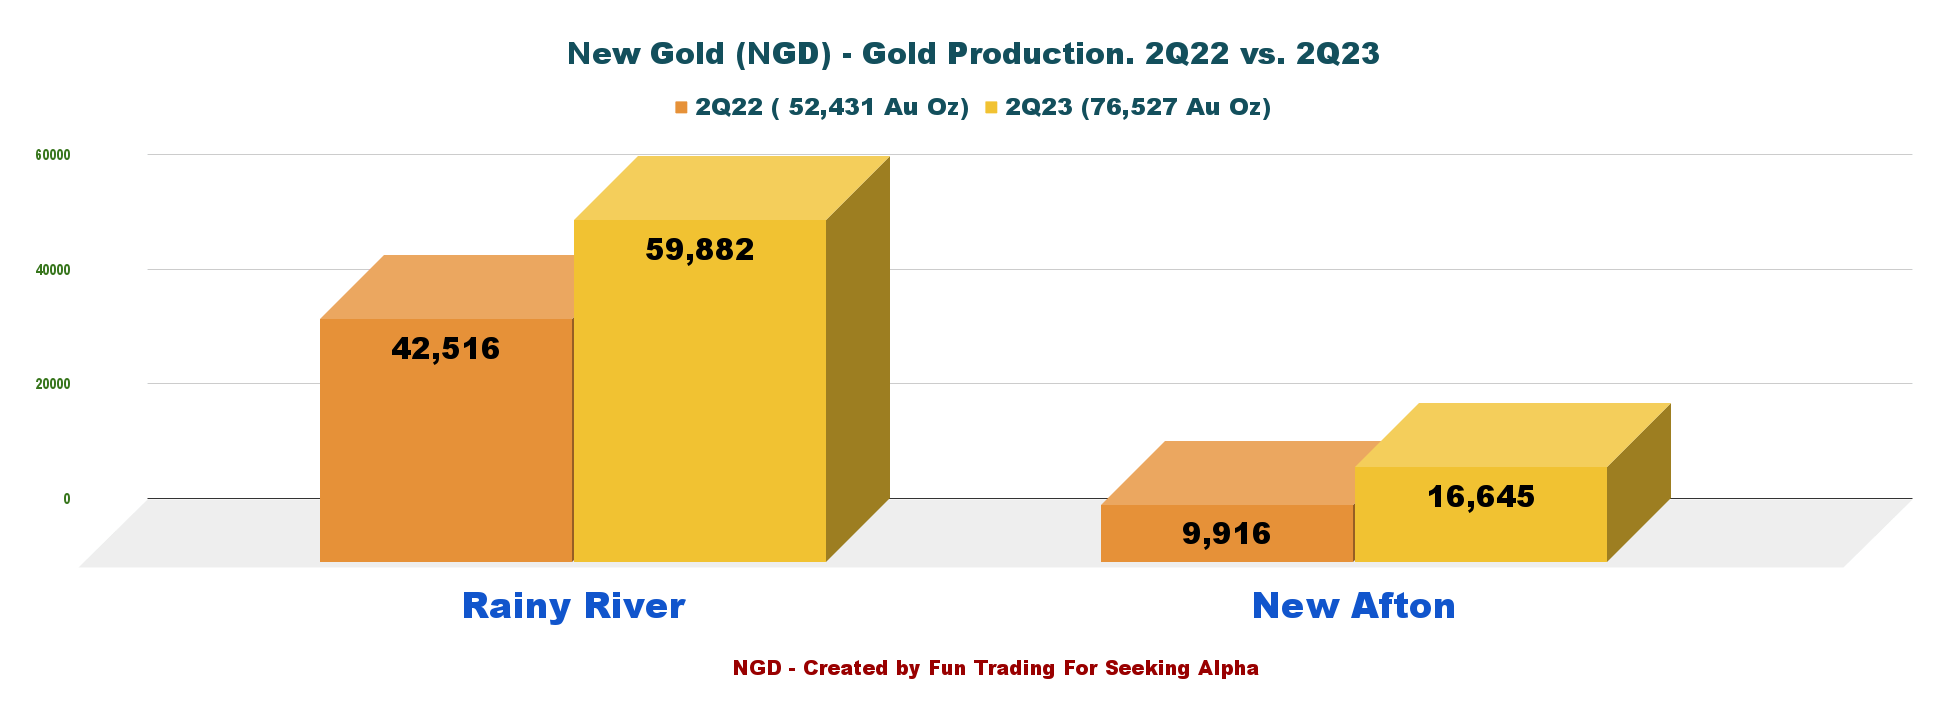
Gold production for the Rainy River mine was 59,882 Au ounces and 16,645 Au ounces for the New Afton mine.
CEO Patrick Godin said in the press release:
Continuity is key to our success, and as evidenced from our strong first half results, both the Rainy River and New Afton teams are delivering. As a result, we remain well positioned to meet all annual production guidance metrics outlined earlier this year.
At New Afton, gold and copper production improved nicely over the same period last year, as the operation's focus remained on steady-state mining of B3 and C-Zone development, which remains on track for first ore production in 4Q23. Tonnes mined per day (ore and waste) was 10,165 TPD.
NGD Gold production per Mine 2Q22 versus 2Q23 (Fun Trading)
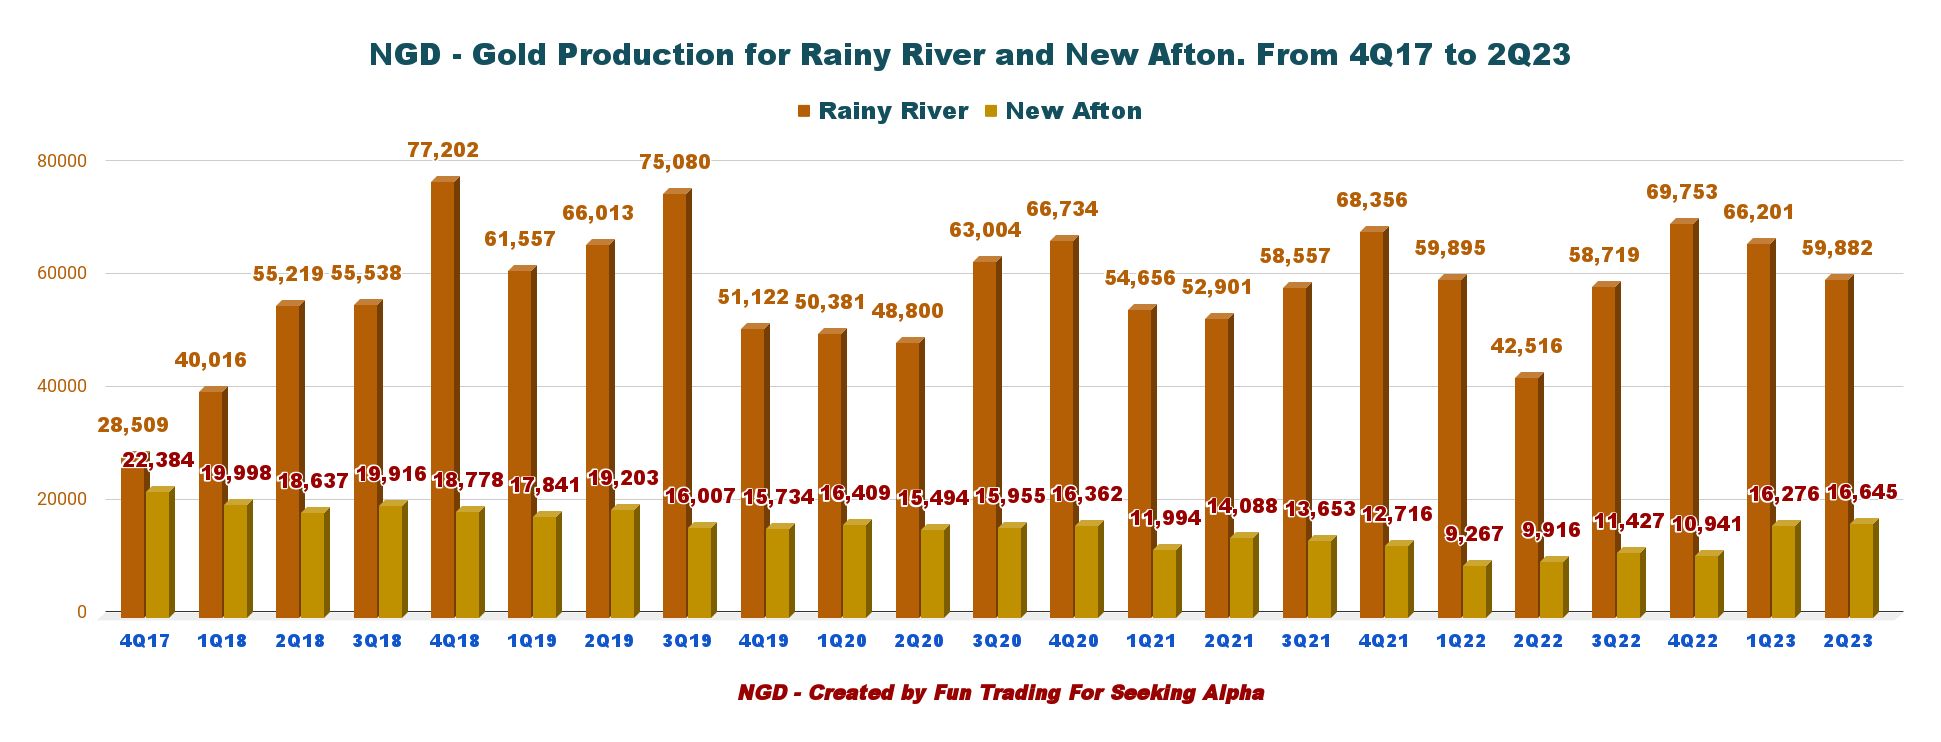
Gold production is back to a decent level, albeit weakening a little since 4Q22, as shown in the graph below:
NGD Quarterly Gold production per Mine History (Fun Trading)
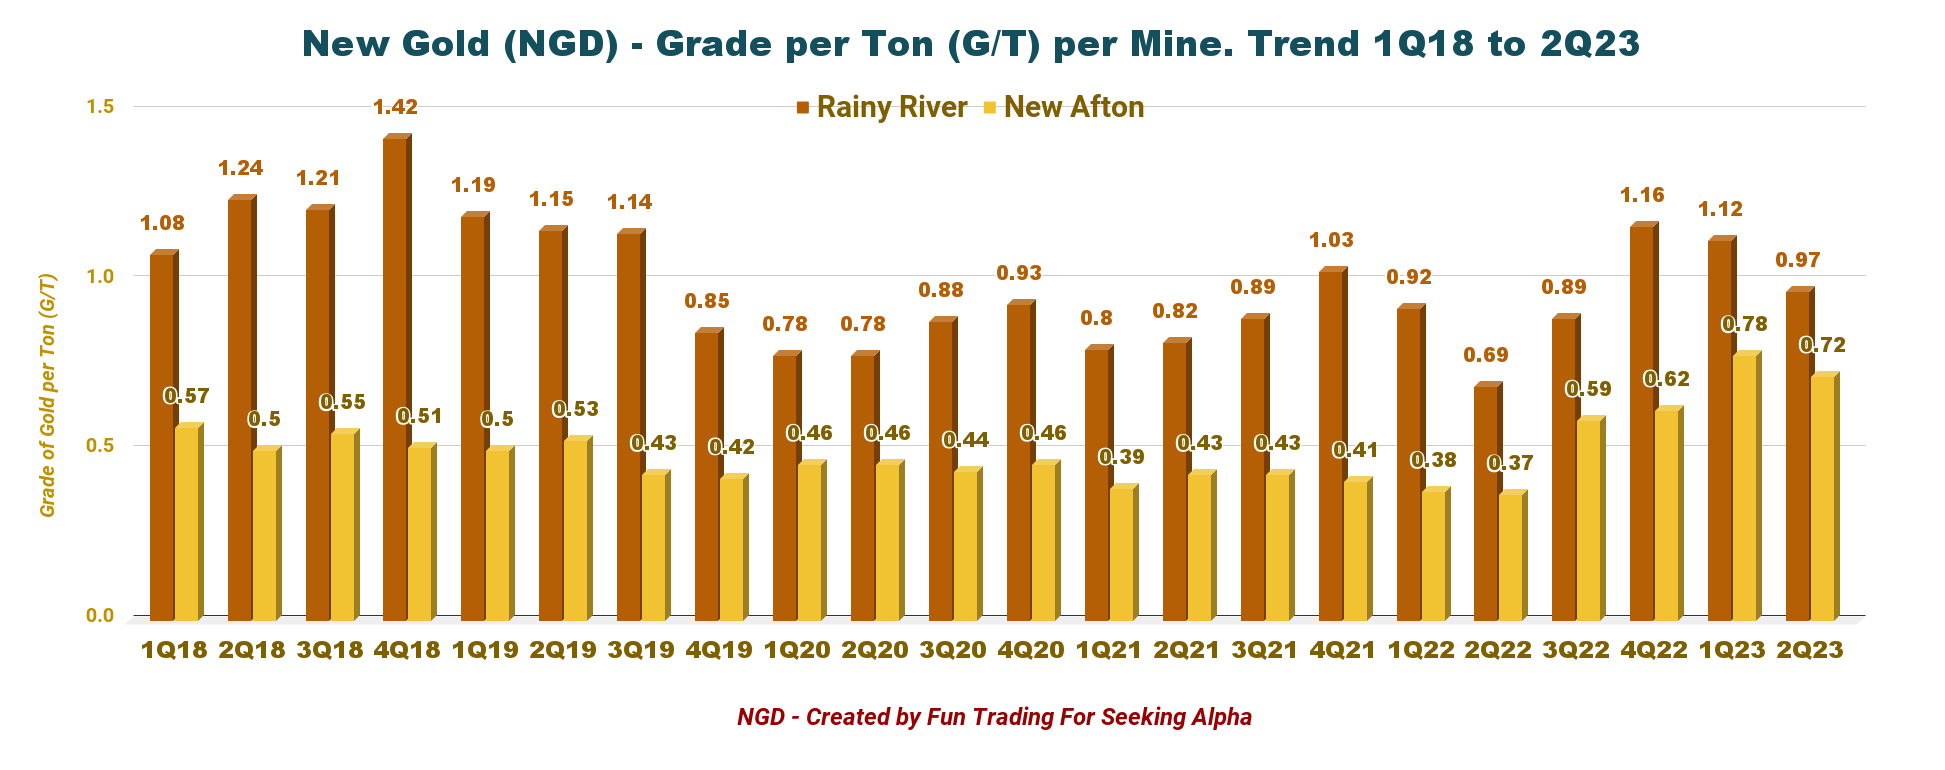
The gold grade per tonne is weakening at the Rainy River to 0.97 G/T , but it is still solid at New Afton.
NGD Quarterly G/T per Mine History (Fun Trading)
2 - 2023 Guidance unchanged
Gold equivalent production is expected to be between 365K to 425K ounces , approximately 13% higher than 2022 production, with 55% of the annual output expected in the year's second half.
AISC is expected to be $1,505 to $1,605 per GEO, down from the prior year due to lower sustaining capital spend and higher sales volumes.
NGD 2023 Guidance (NGD Presentation)
Technical analysis and commentary
NGD TA Chart Short-Term (Fun Trading StockCharts)
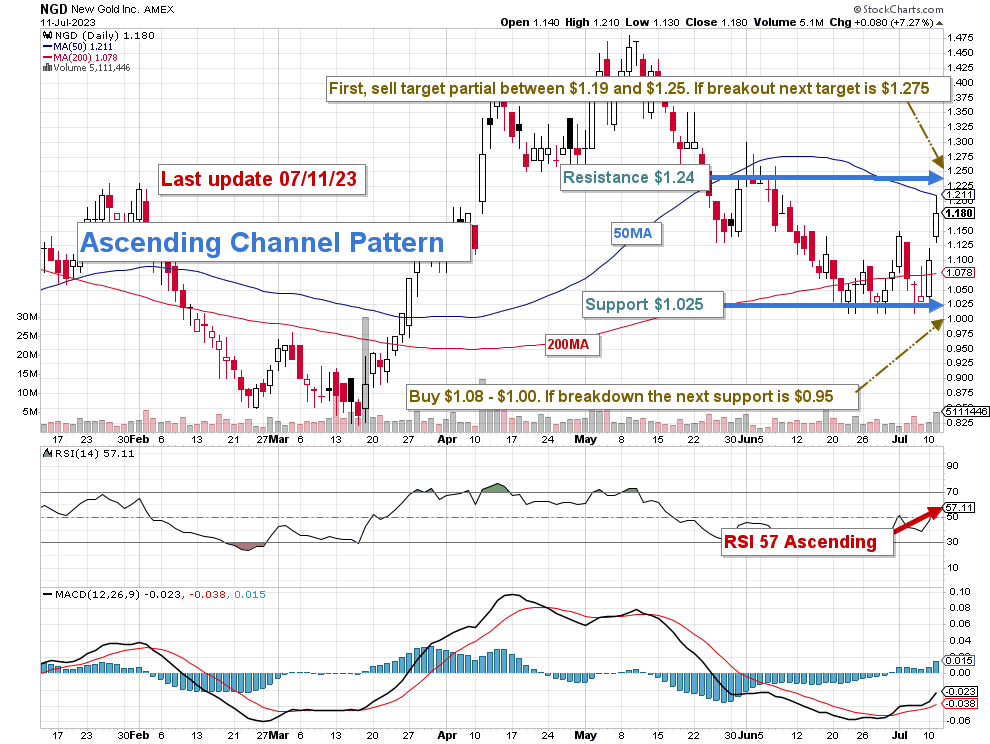
NGD forms an ascending channel pattern with resistance at $1.24 and support at $1.025 . RSI is now 58, which indicates that NGD may eventually reach $1.27-$1.28 , assuming a bullish gold price.
Ascending channel patterns or rising channels are short-term bullish in that a stock moves higher within an ascending channel, but these patterns often form within longer-term downtrends as continuation patterns. The ascending channel pattern is often followed by lower prices.
The strategy is to trade LIFO about 60% of your position and keep a small core long-term for a better payday above $1.40.
I recommend accumulating between $1.08 and $1.00 , with potential lower support at around $0.95.
NGD recovered from its lows last year and seems moving in correlation with the gold price, which could trend even higher in H2 2023. I expect the FED to raise interest rates twice in 2023 and then pause, pushing gold higher.
Conversely, I recommend taking profits between $1.19 and $1.25, with higher resistance at $1.275.
Watch the gold price like a hawk.
Warning: The TA chart must be updated frequently to be relevant. It is what I am doing in my stock tracker. The chart above has a possible validity of about a week. Remember, the TA chart is a tool only to help you adopt the right strategy. It is not a way to foresee the future. No one and nothing can.
For further details see:
New Gold: Solid Production This Quarter