CA - New Gold: The First Quarter Production Was A Good Surprise
2023-04-13 13:10:36 ET
Summary
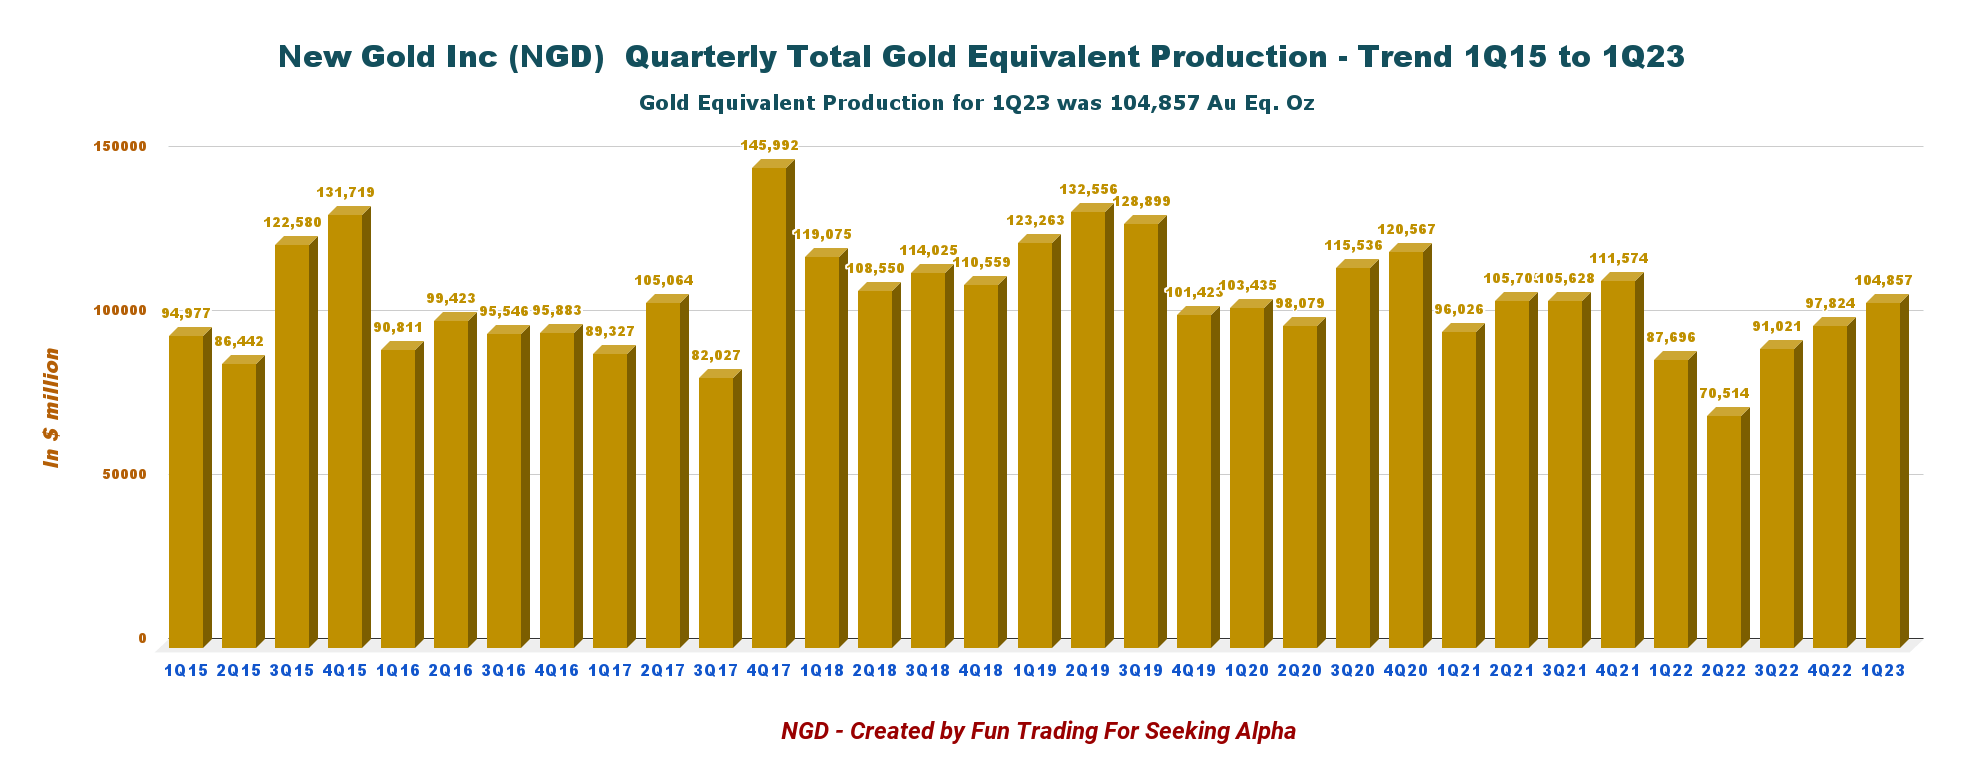
- NGD announced on April 10, 2023, that it produced 104,857 GEOs during the first quarter of 2023, up 7.2% sequentially.
- Gold equivalent production is expected to be between 365K to 425K ounces, approximately 13% higher than 2022 production.
- I recommend buying NGD stock between $1.22 and $1.17, with potential lower support at around $1.00.
Introduction
On April 10, 2023, Canada-based New Gold ( NGD ) released its first quarter 2023 operational results ending March 31, 2023.
Note: This article is an update of my article published on February 20, 2023. I have been following New Gold on Seeking Alpha since 2019.
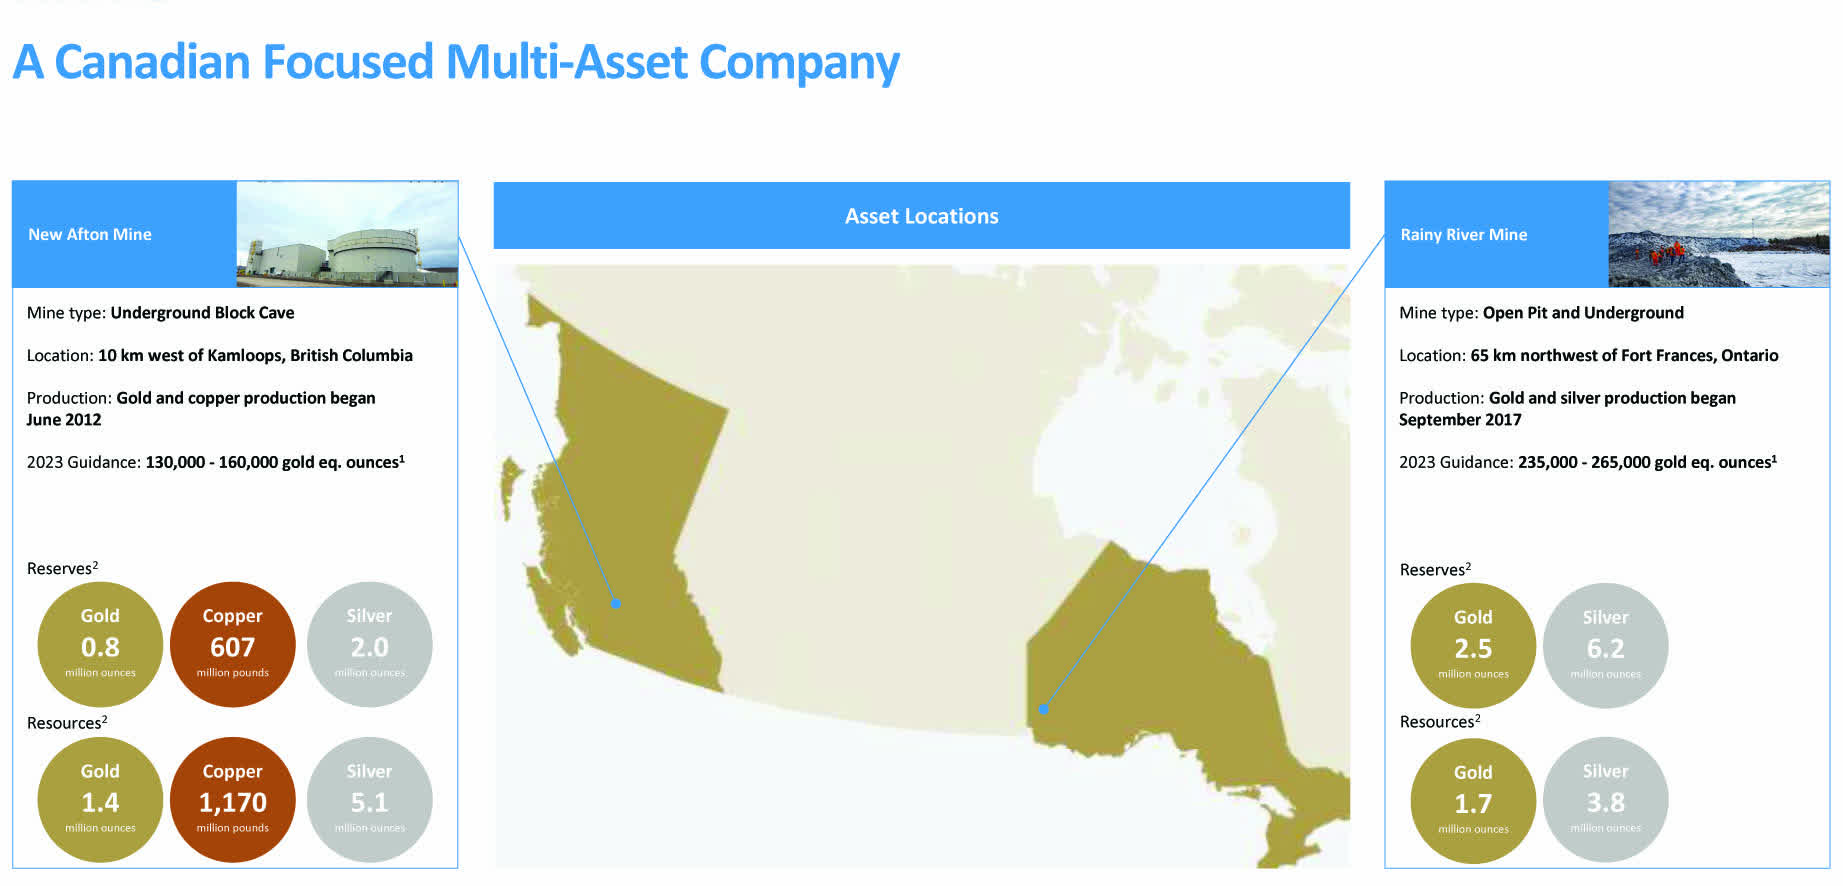
NGD Location and Reserves (NGD Presentation February)
Note: Consolidated Mineral Reserves decreased by approximately 385K gold ounces compared to the prior year.
1 - First quarter production release commentary
Gold equivalent production was strong this quarter, with 104,857 GEOs. Significant progress compared to the first quarter of 2022 of 87,696 GEOs.
CEO Patrick Godin said in the press release:
The first quarter of 2023 saw both of our operations excel, delivering gold equivalent production of 104,857 ounces, the strongest start to a year for our Company over the last four years, and a 20% increase over the prior year period
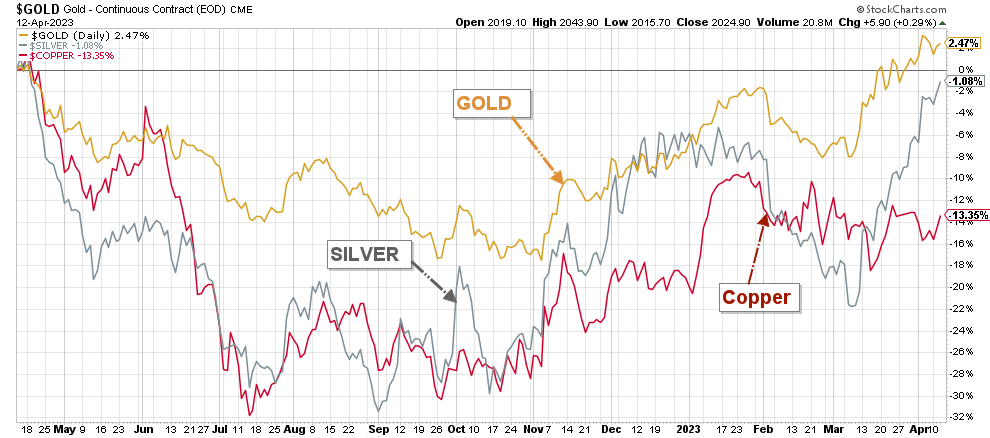
This record production came with higher gold, silver, and copper prices. Gold is now up 3% on a one-year basis after struggling significantly in H2 2022.
NGD 1-Year price comparison Gol, Silver, and Copper (Fun Trading StockCharts)
2 - Stock Performance
New Gold recovered from its collapse in September 2022 by demonstrating that the technical issues experienced in July were resolved. However, NGD is still down 27.3% on a one-year basis.
NGD rallied after the company released its first quarter production.
1Q23 Gold production analysis
1 - The raw numbers
NGD Quarterly GEO production history (Fun Trading)
NGD announced on April 10, 2023 that it produced 104,857 GEOs during the first quarter of 2023, up 7.2% sequentially. The production of gold equivalent ounces [GEO] includes gold, silver, and copper. Below are the details:
- Gold production was 82,477 Au oz
- Silver production was 137,698 Ag oz
- Copper production was 10.3 M Pounds.
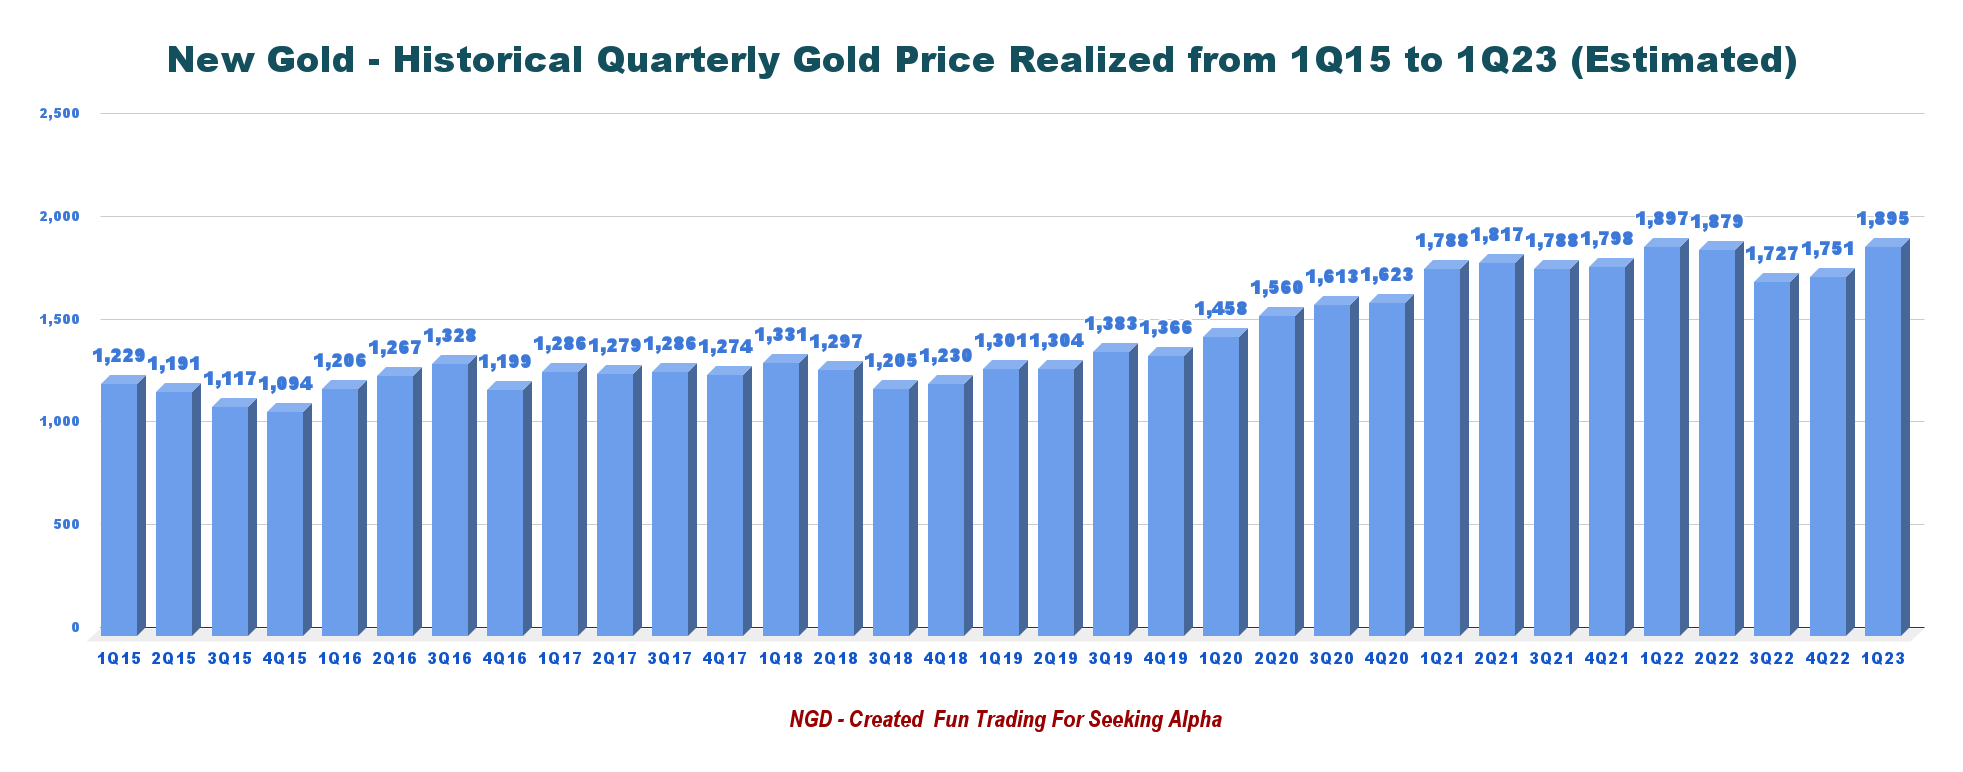
Note: The company did not indicate the amount sold in 1Q23. I have estimated the gold price at $1,895 per ounce in 1Q23.
NGD Quarterly Gold Price History (Fun Trading)
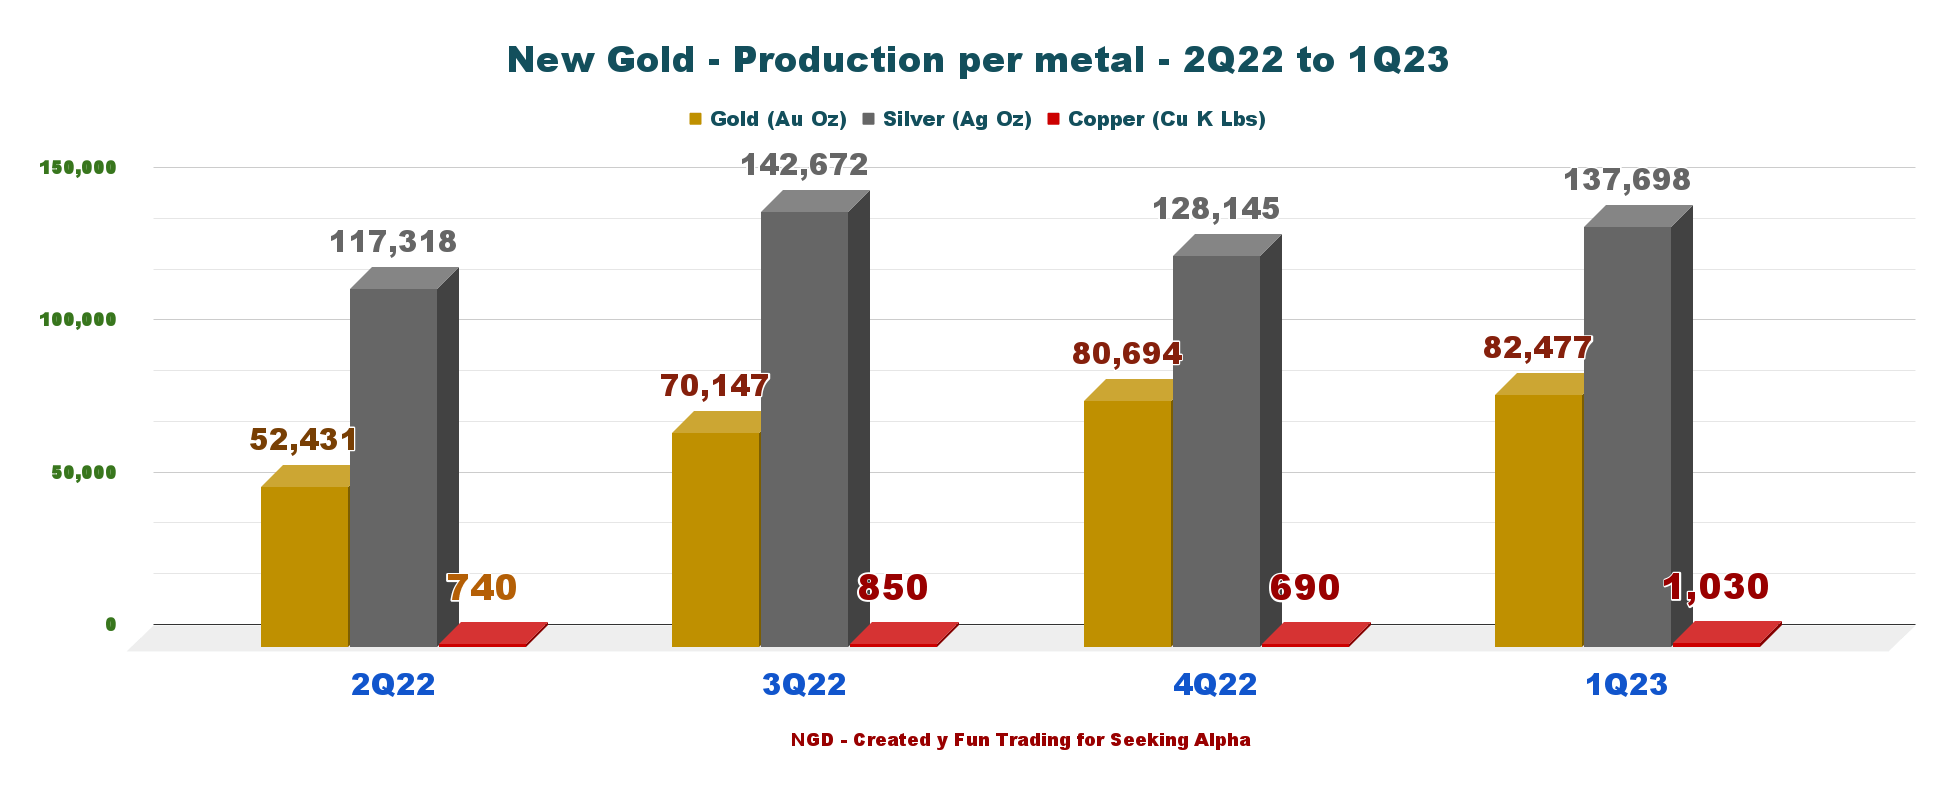
Below is shown the production for the last four quarters and per metal:
NGD Quarterly production per mine from 2Q22 to 1Q23 (Fun Trading)
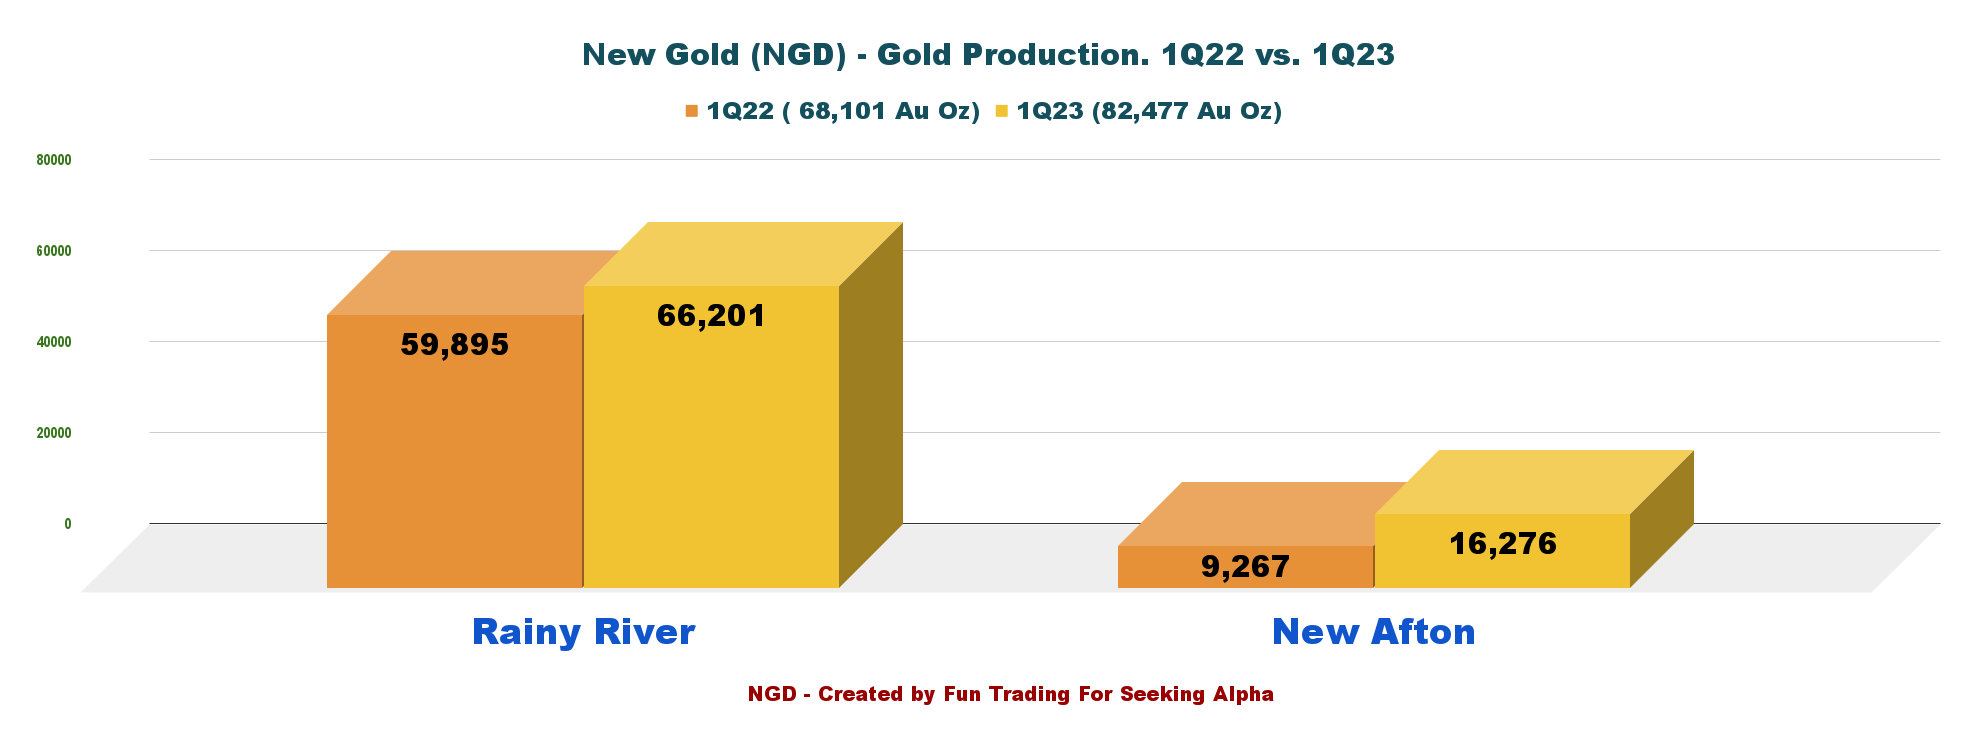
Gold production for the Rainy River mine was 66,201 Au ounces and 16,276 Au ounces for the New Afton mine.
CEO Patrick Godin said in the press release:
At Rainy River , we achieved our strongest first quarter of any year in the operation's history and delivered production growth of nearly 13% over the same period last year as greater underground ore tonnes contributed to better-than-expected grade, which more than offset lower tonnes milled. The milling rate was impacted during the quarter by mechanical maintenance on the SAG mill and crusher.
At New Afton, gold and copper production improved nicely over the same period last year, as the operation's focus remained on steady-state mining of B3 and C-Zone development. Tonnes mined per day (ore and waste) was 9,185.
NGD Gold production per mine 1Q22 versus 1Q23 (Fun Trading)
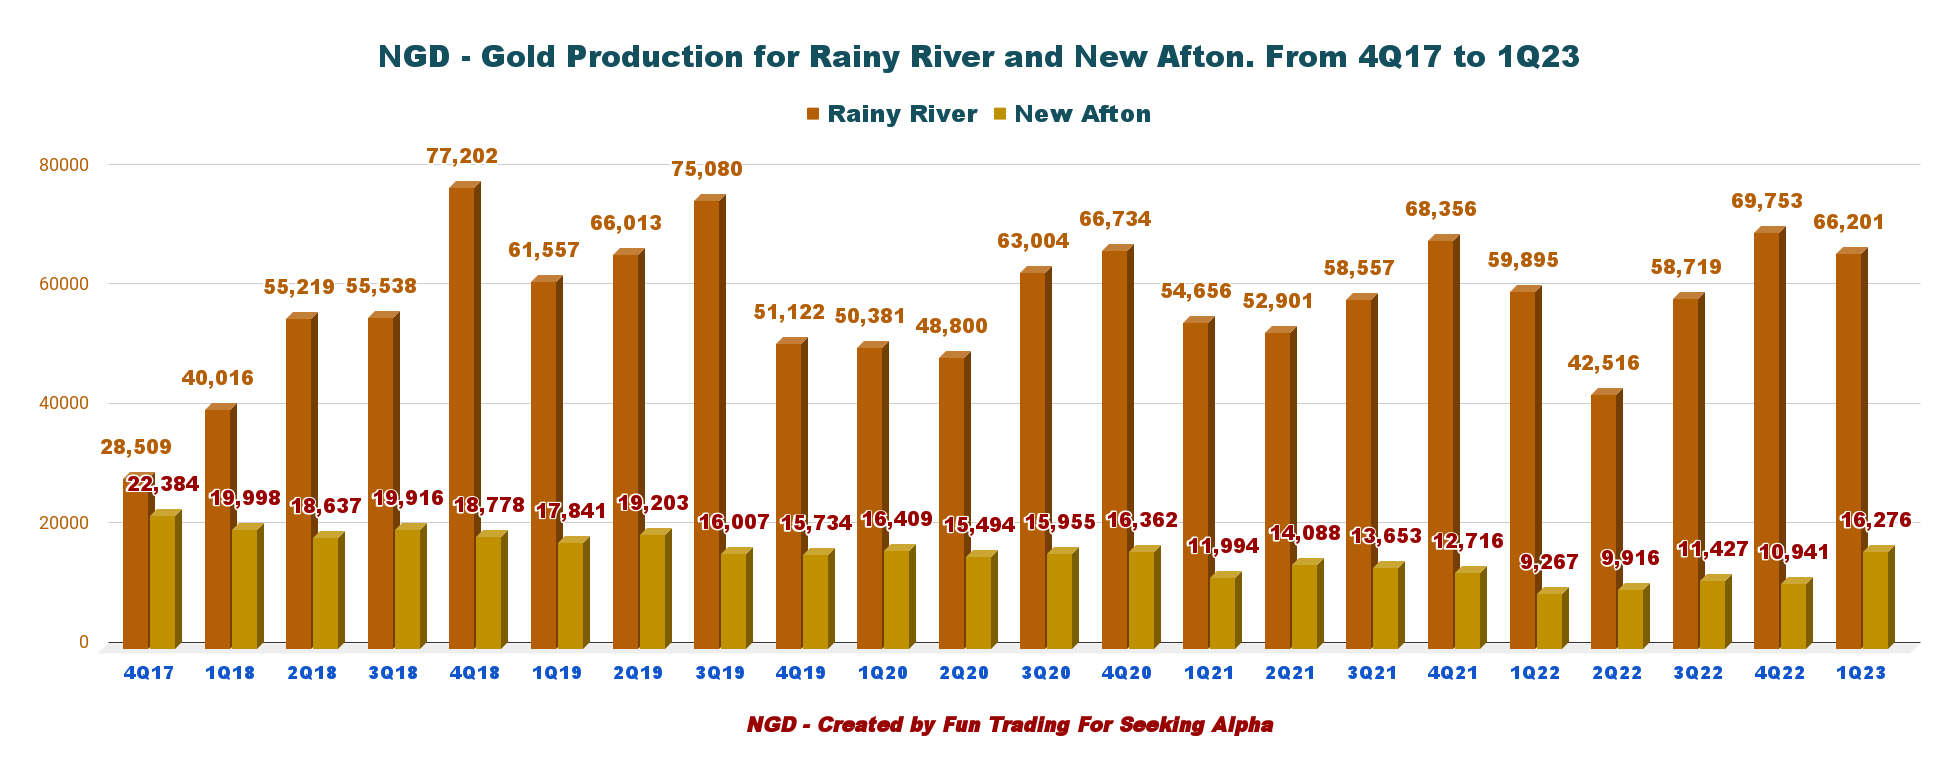
Gold production is back to a decent level, as shown in the graph below:
NGD Gold production per metal history (Fun Trading)
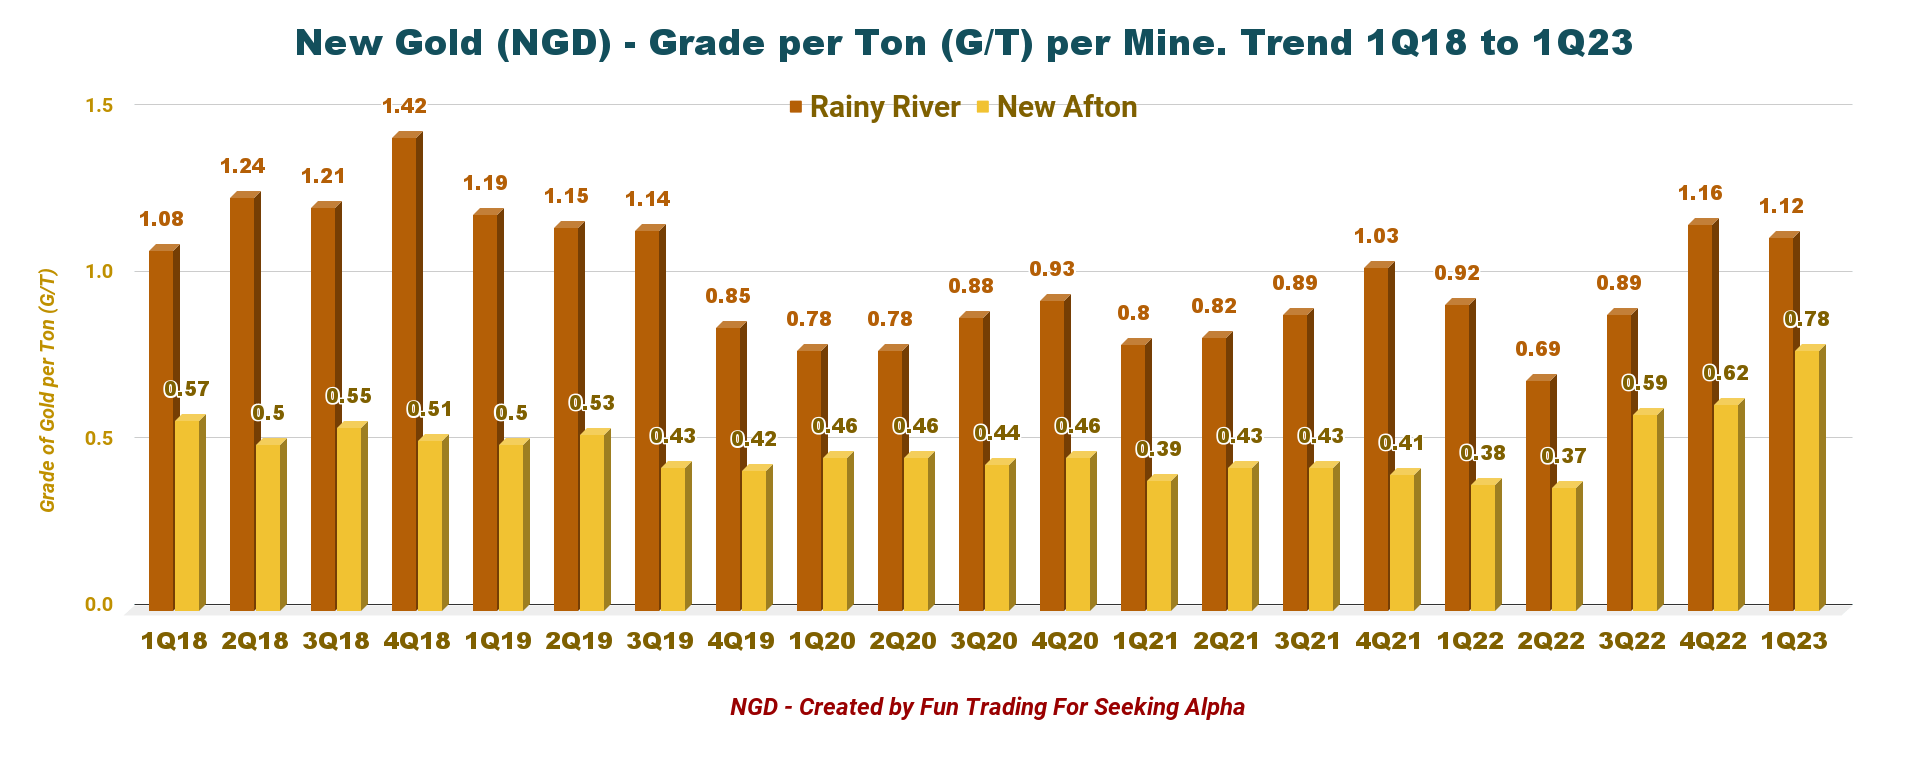
The gold grade was quite impressive this quarter.
NGD Quarterly Gold grade per mine history (Fun Trading)
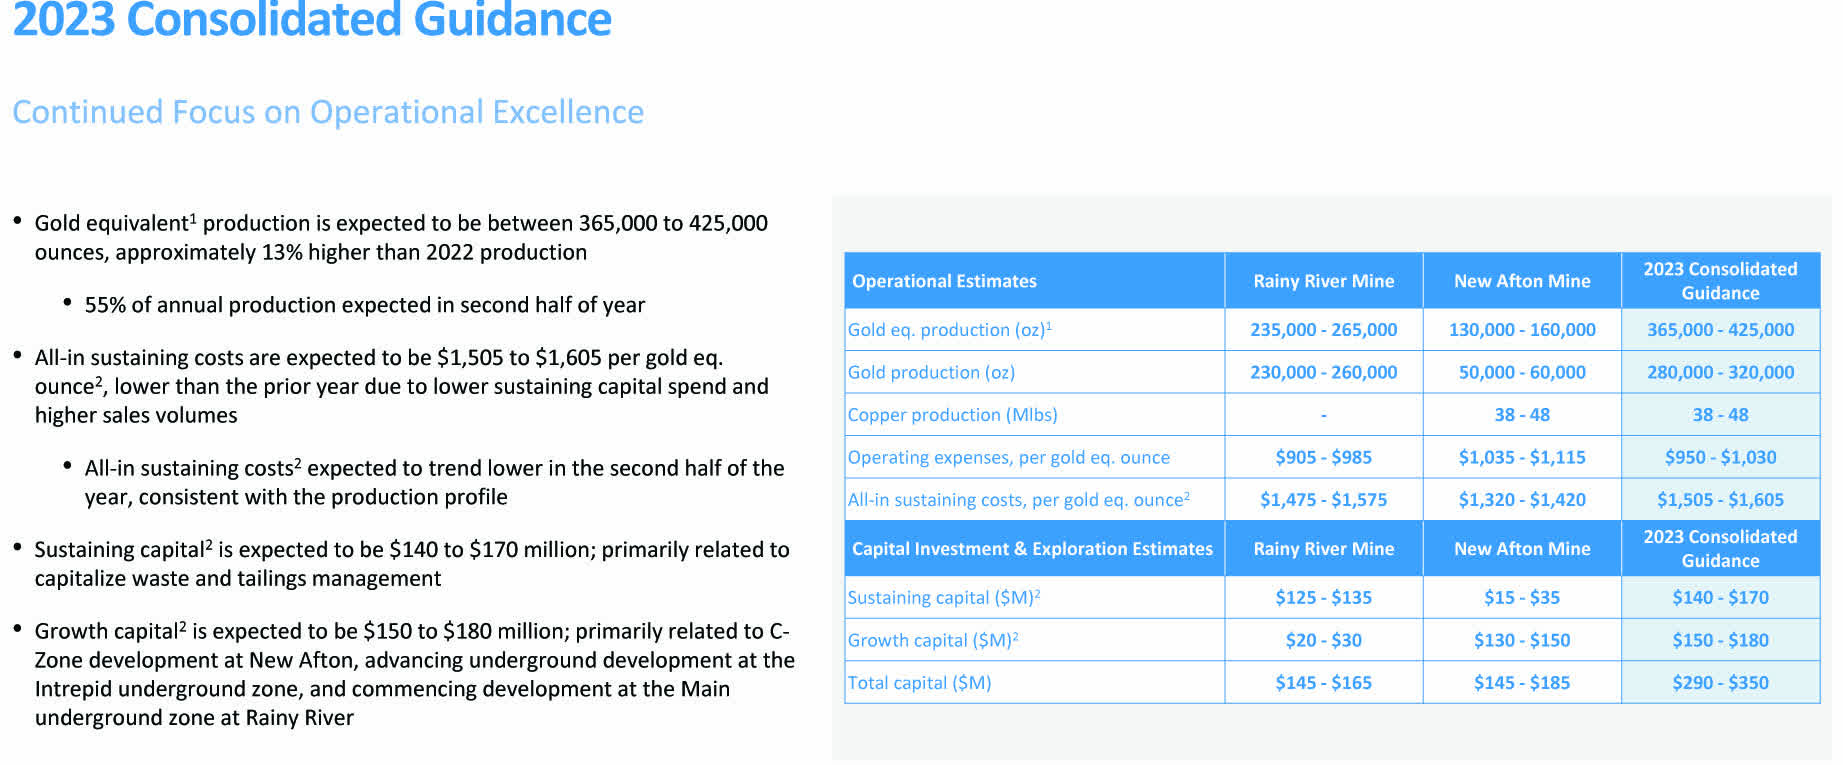
2 - 2023 Guidance
Gold equivalent production is expected to be between 365K to 425K ounces, approximately 13% higher than 2022 production, with 55% of the annual output expected in the year's second half.
AISC is expected to be $1,505 to $1,605 per GEO, down from the prior year due to lower sustaining capital spend and higher sales volumes.
NGD 2023 Guidance (NGD Presentation)
Technical analysis and commentary
NGD TA Chart Short-term (Fun Trading StockCharts)
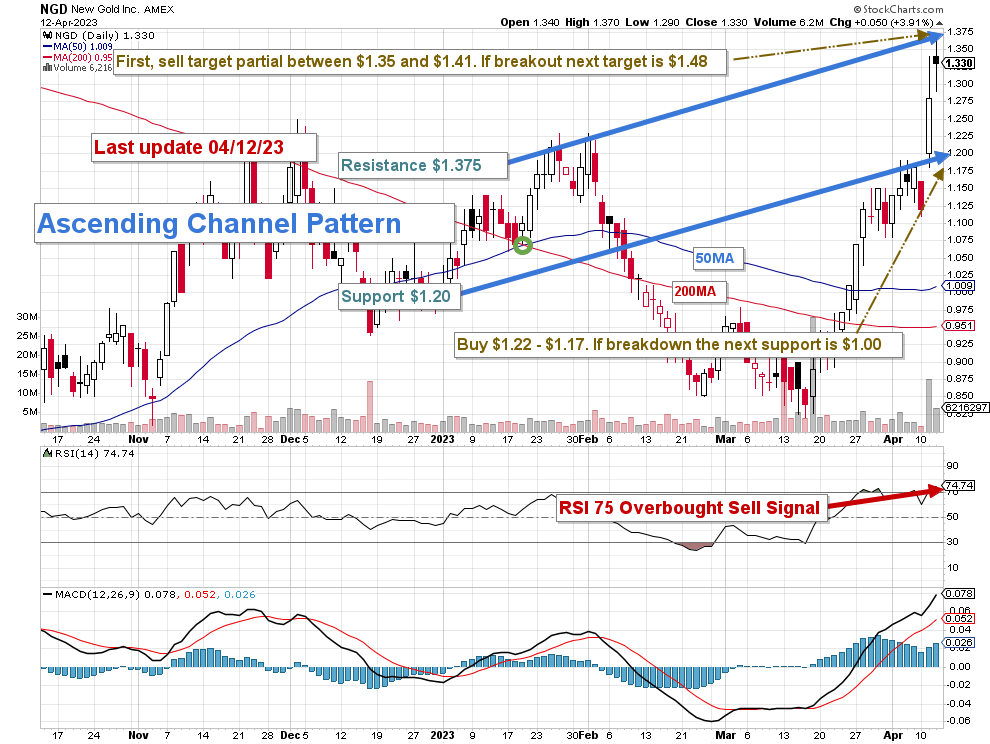
NGD forms an ascending channel pattern with resistance at $1.375 and support at $1.20. RSI is now 75, which is a Sell Signal.
Ascending channel patterns or rising channels are short-term bullish in that a stock moves higher within an ascending channel, but these patterns often form within longer-term downtrends as continuation patterns. The ascending channel pattern is often followed by lower prices.
The strategy is to trade LIFO about 60% of your position and keep a small core long term for a better payday.
I recommend accumulating between $1.22 and $1.17, with potential lower support at around $1.00.
NGD has recovered nicely since September and seems to be moving with the high gold price, which could trend even higher in H2 2023, depending on the Fed's action.
Conversely, I recommend taking profits between $1.35 and $1.41, possibly with higher resistance at $1.48.
Watch the gold price like a hawk.
Warning: The TA chart must be updated frequently to be relevant. It is what I am doing in my stock tracker. The chart above has a possible validity of about a week. Remember, the TA chart is a tool only to help you adopt the right strategy. It is not a way to foresee the future. No one and nothing can.
For further details see:
New Gold: The First Quarter Production Was A Good Surprise