CA - Newmont: Expecting More Consolidations Before The Next Rally
2023-11-27 20:59:10 ET
Summary
- Newmont Corporation faced challenges in Q3 2023 with decreased gold production at significant sites but improvements at Yanacocha.
- The company's financial standing showed a decline in revenue and net income but strong cash flow.
- Technical analysis of Newmont's stock reveals high volatility and the potential for further consolidation before an upward movement.
Newmont Corporation ( NEM ), a significant player in the mining industry, faced a challenging financial landscape in Q3 2023 that reflected the sector's inherent difficulties and external pressures. The Q3 results presented reduced gold production due to decreased output at significant sites like Peñasquito, Akyem, Ahafo, and the Pueblo Viejo joint venture. However, there were improvements at Yanacocha. This article offers a technical examination of its stock price to determine future trends and investment potentials. It reveals that the stock is currently experiencing significant volatility, and further consolidation is probable before an upward movement.
Newmont's Financial Standing
Newmont Corporation's financial performance in Q3 2023 reflected the complex and varied aspects of the mining industry, influenced by various external factors. The period was marked by a mix of setbacks and strategic advancements, reflecting both the challenges and resilience of the company. The company's gold production experienced a downturn, with a 13% decrease to 1.3 million attributable ounces. This decline was primarily attributed to reduced output at Peñasquito, Akyem, and Ahafo and complications at the Pueblo Viejo joint venture. However, improved production at Yanacocha provided some balance. The output of Gold Equivalent Ounces ((GEOs)) from copper plummeted by 81% to 58 thousand ounces, severely impacted by the suspension at Peñasquito.
Moreover, the revenue dropped by 5% to $2.493 billion, primarily due to lower sales volumes, as shown in the chart below. Net income also declined to $158 million, influenced by reduced sales from the Peñasquito strike and increased reclamation costs, although adjusted net income showed an increase to $286 million. Notably, Adjusted EBITDA rose by 10% to $933 million, demonstrating the company's robust profitability in challenging times. Cash flow was a highlight, with $1.0 billion generated from operations due to effective working capital management and ongoing investments, leading to a substantial rise in Free Cash Flow to $397 million.
Moreover, the company declared a consistent quarterly dividend of $0.40 per share, maintaining its established dividend policy. Financially, Newmont concluded the quarter with robust liquidity, possessing $3.2 billion in cash and a total liquidity of approximately $6.2 billion, with a net debt-to-adjusted EBITDA ratio of 0.7x.
Newmont Corporation also announced the completion of its acquisition of Newcrest Mining Limited, a move that positions it as the world's leading gold company with significant copper production. This acquisition brings together over half of the world’s Tier 1 assets, promising years of profitable production in favorable jurisdictions and bolstering Newmont's portfolio with operations that offer scale, margin, and longevity for sustainable returns. The merger is expected to strengthen Newmont's leadership in responsible gold mining, generate substantial annual pre-tax synergies, and maintain its commitment to balanced capital allocation and industry-leading dividends while enhancing its environmental, social, and governance performance.
Overall, Newmont's Q3 2023 performance encapsulates the dynamic and challenging nature of the mining industry, marked by setbacks in production and financial metrics and notable strategic advancements. Despite facing decreased gold production and revenue, the company managed to maintain a strong financial position, as evidenced by its consistent dividend policy, robust liquidity, and a significant rise in free cash flow. The strategic acquisition of Newcrest Mining Limited further solidifies Newmont's position as a global leader in gold and copper production, promising enhanced profitability, operational scale, and a commitment to sustainable mining practices, thus setting a strong foundation for future growth and resilience in the face of industry challenges.
Deciphering the Dynamics of Market Fluctuations
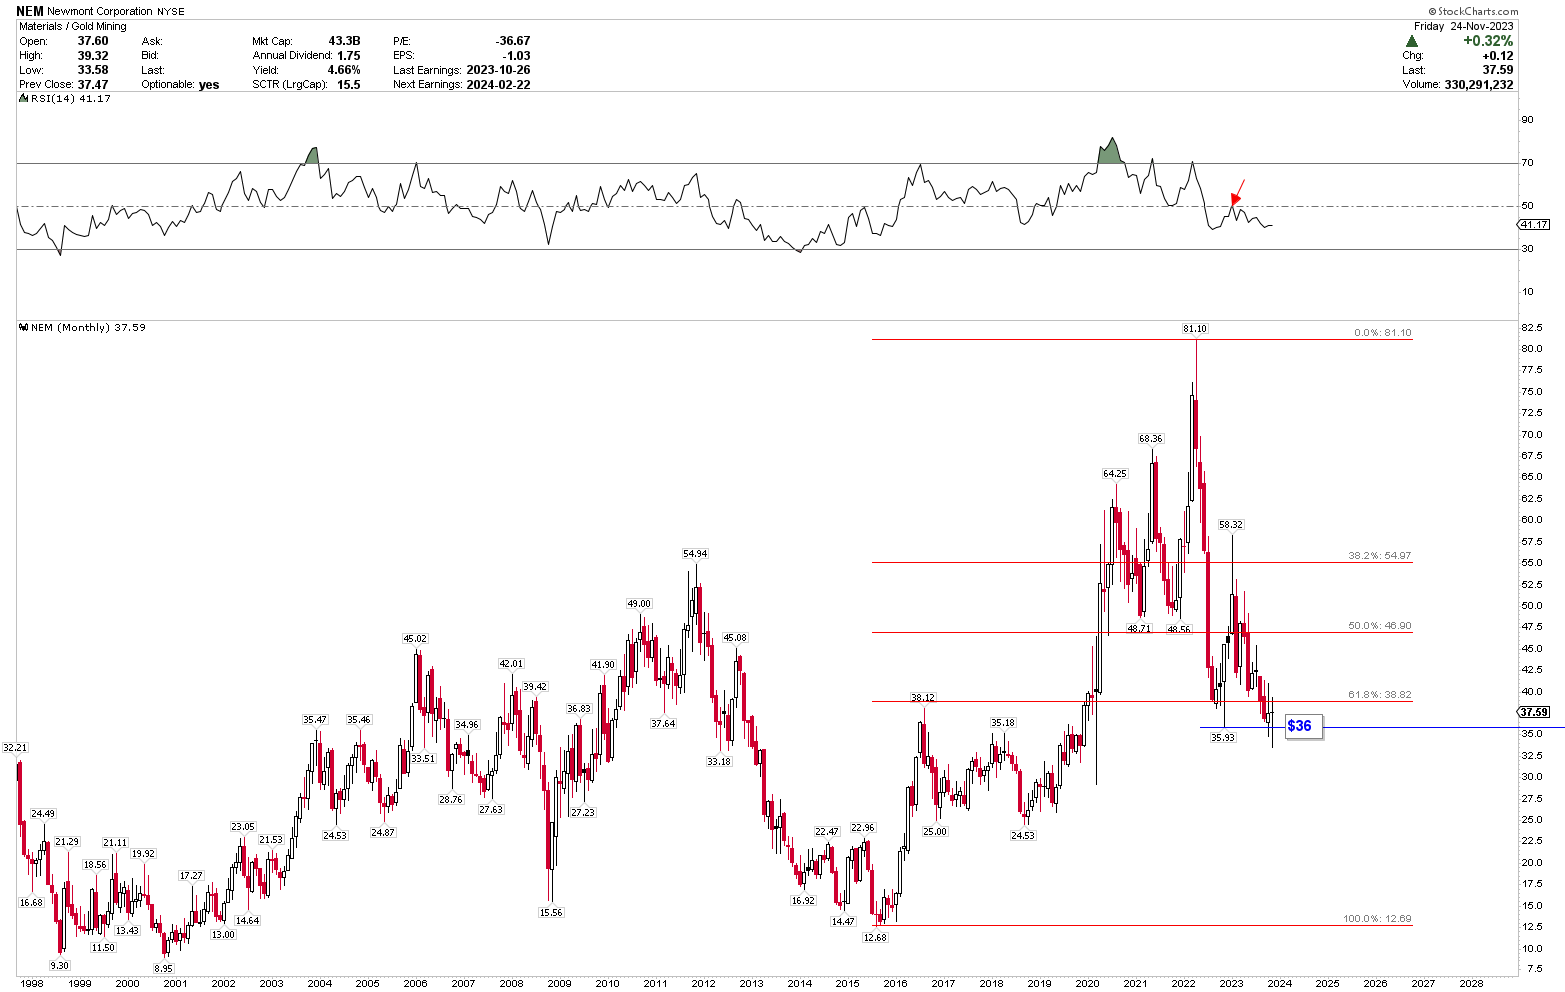
The technical analysis of Newmont's stock reveals significant price volatility, with movements spanning broad ranges. As the monthly chart below illustrates, Newmont's stock price established a solid bottom in 2016, reaching $12.68, before embarking on a substantial rally. This rally culminated in a record high of $81.10 in 2022, highlighting the stock's dynamic performance over this period. This upward trend was attributed to several key factors.
Firstly, the period saw a global increase in the demand for gold, driven by economic uncertainties, including trade tensions and geopolitical issues, which traditionally boosted the appeal of gold as a safe-haven asset. Additionally, the COVID-19 pandemic played a crucial role, as the resulting economic instability and stimulus measures led to a decrease in interest rates and a weaker dollar, further enhancing gold's attractiveness. Newmont's operational efficiency and strategic acquisitions during this period also contributed to its success. The company's focus on sustainable and efficient mining practices and its expansion through strategic mergers and acquisitions helped boost investor confidence. These factors and the general market sentiment towards precious metals during economic volatility propelled Newmont's stock to its record highs in 2022.
NEM Monthly Chart (stockcharts.com)
Newmont's stock exhibits high volatility, as evidenced by its peak in 2022, followed by a downward correction. When applying Fibonacci retracement levels from the 2015 low to the 2022 high, it's noticeable that the stock is breaching the critical long-term support at the 61.8% retracement level, at $38.82. This downward breakout would be further validated if the stock closed the month below $36, signaling a bearish trend. This negative sentiment is mirrored in the RSI, which remains below the mid-line of 50, and the stock's resistance at this mid-level during recent rebounds.
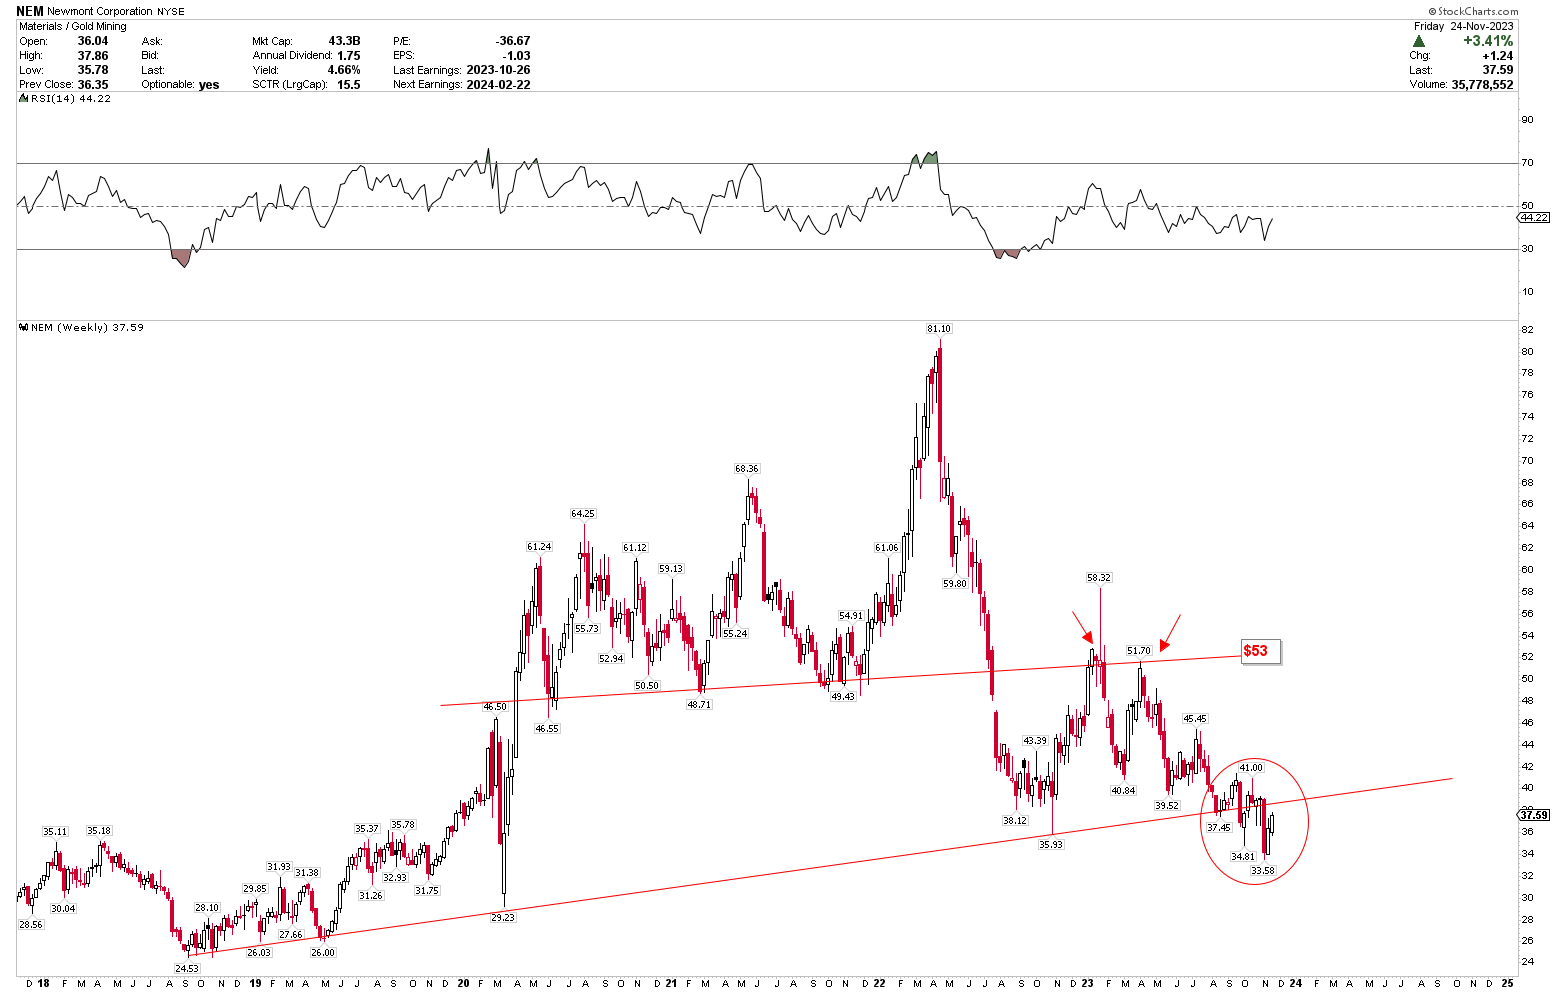
The weekly chart of Newmont further illustrates this volatility, particularly highlighting the consolidation phase at the long-term trendline. Although it appears that this trendline has been broken, a monthly close below $36 is necessary to confirm a potential further decline in the price. The red circle in the chart underscores significant price fluctuations at this key support level, suggesting weakening momentum and the likelihood of additional downward movement. Another important observation is the trendline around $53, marked by bearish candles at $58.32 and $51.70, indicating price vulnerability.
NEM Weekly Chart (stockcharts.com)
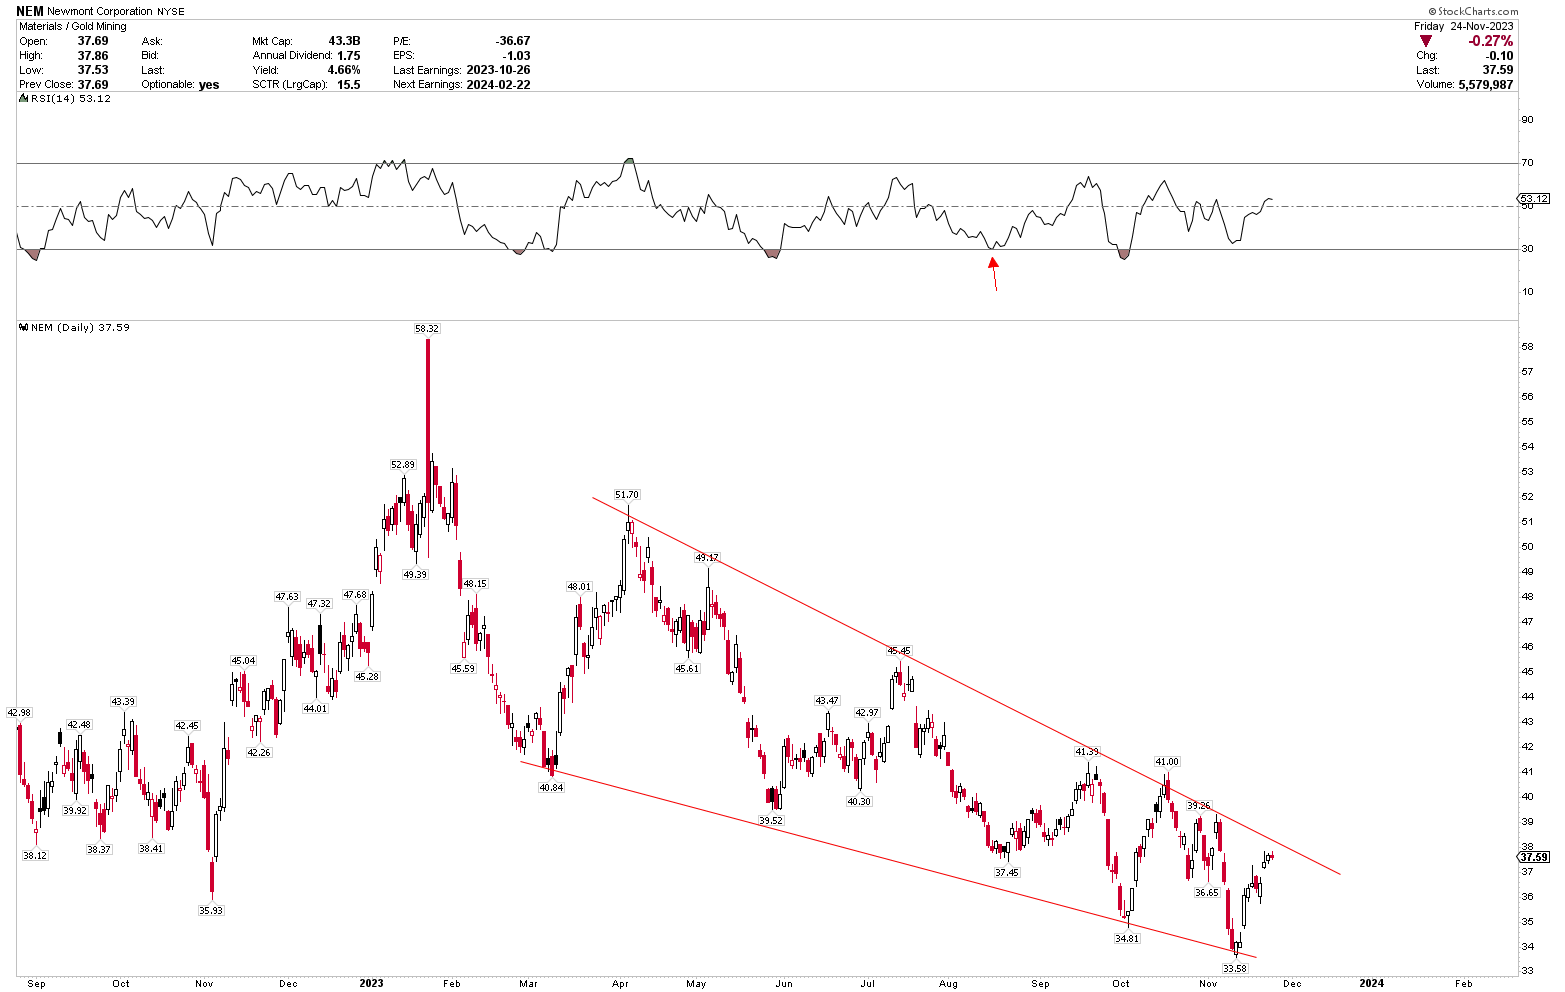
Conversely, short-term price action on the daily chart reveals a falling wedge pattern, with the price nearing the wedge's apex. A break above $41 could signal possible upward movements. However, the long-term chart suggests that the price is still within a sideways pattern on a broader scale. Investors might consider waiting for another downward price movement before anticipating an upward trend. For a bullish outlook, the stock price must consistently close above the monthly 61.8% Fibonacci retracement level to remain bullish.
NEM Daily Chart (stockcharts.com)
Market Risks
Newmont Corporation's financial results for Q3 2023 reflect significant operational challenges that pose risks to its market performance. The 13% decline in gold production, primarily due to reduced output at key sites, underscores the risk of operational disruptions. These disruptions can be caused by various factors, including labor strikes, geopolitical issues, and technical difficulties, as seen in the complications at the Pueblo Viejo joint venture.
The 5% decrease in revenue and fluctuations in net income, influenced by factors like lower sales volumes and higher reclamation costs, indicate a susceptibility to broader economic and market conditions. The mining industry, particularly gold, is sensitive to changes in global economic conditions, currency fluctuations, and commodity prices. Gold and copper prices, which influence Newmont's revenue streams, are volatile due to geopolitical tensions, trade dynamics, and macroeconomic factors like interest rates and inflation.
Technical analysis of Newmont's stock reveals high price volatility, which can be a risk for investors and the company's market valuation. The stock's peak in 2022, followed by a downward correction and the breach of the critical long-term support at the 61.8% Fibonacci retracement level, signal a potential bearish trend. This volatility is not just a reflection of Newmont's internal operations but also mirrors broader market sentiments towards precious metals and the mining sector. The RSI remains below the mid-line of 50, and the resistance at this level indicates weakened investor confidence.
Bottom Line
In conclusion, Newmont Corporation's performance in Q3 2023 is a microcosm of the complex and evolving landscape of the mining industry. Faced with a decrease in gold production and revenue, primarily due to operational challenges at critical sites, the company still demonstrated resilience through strategic advancements, including acquiring Newcrest Mining Limited. This move enhances Newmont's market position and promises future profitability and sustainable practices. Financially, despite setbacks, Newmont showed robustness through its consistent dividend policy, strong liquidity, and significant rise in free cash flow. These factors and the company's focus on efficiency and sustainability continue to maintain its appeal to investors, even in a challenging market environment.
However, the technical analysis of Newmont's stock paints a picture of significant volatility and uncertainty. The stock's past performance, characterized by a dramatic rise and subsequent correction, reflects the broader market's fluctuating sentiment towards precious metals and the mining sector. The current trend suggests further consolidation may be necessary before witnessing an upward trajectory. Investors can closely monitor key technical levels and market dynamics as the stock navigates through these turbulent times before making investment decisions.
For further details see:
Newmont: Expecting More Consolidations Before The Next Rally