NOC - Northrop Grumman Or Raytheon Technologies - Which One Gets Our Vote?
2023-04-19 15:10:48 ET
Summary
- Raytheon is a more well-rounded option, with a better long-term earnings outlook, and cheaper valuations.
- NOC’s FCF growth potential in FY23 looks compelling, and could ensure superior dividend growth yet again.
- Despite a subdued performance in recent months, Northrop still looks overbought relative to its defense and aerospace peers.
Introduction
A nation’s commitment to national security should not be underestimated, particularly in an increasingly fractious world, chequered with geo-political tensions of differing hues. For instance, this year, in the US, the defense budget will increase by 8%, whilst in the Far East, in places like Japan, the annual increase could be much higher at 26% (the highest YoY increase in 70 years).
Northrop Grumman Corporation ( NOC ), and Raytheon Technologies Corp ( RTX ), are currently considered to be amongst the most prominent defense contractors around and are also well-positioned to attract these increased defense bounties. However, given a choice between one or the other, which one should you pick?
Diversification
When I’m gauging the operating model of large industrial enterprises, I would prefer it if these stocks are not too unidimensional, with the dexterity to spread their tentacles across different terrains. In that regard, Raytheon comes across as a more well-rounded play. Northrop is heavily dependent on business from the US government which accounts for 86% of total group sales. However, with RTX, things are less concentrated, with the US government only contributing 45% of group sales. This way, RTX is better positioned to cope with growing risks linked to a steep budget deficit which could have serious ramifications over time.
10K of RTX and NOC
Also consider that RTX is just more diversified across geographies (international sales account for 39% of group sales vs 13% for NOC), and is better positioned to benefit from increased defense spending trends across the world, not to mention the ongoing dollar weakness, which should translate to more encouraging reported revenue figures in the short-term.
R&D and Capital Intensity
When you look at defense stocks, you also want to consider if these guys are devoting ample resources in beefing up and refreshing their tech IP and infrastructure. Without a relentless commitment to these initiatives, these defense pros won’t quite have the right foundation to ensure pricing power. In that regard, it also pays to measure the level of R&D and Capex spend as a function of group sales. Even here, it appears as though RTX is just more committed, devoting $9bn in R&D and CAPEX, which accounted for 13.4% of group sales. On the other hand, NOC’s commitment to R&D and Capex as a percentage of sales was almost half as much, at just 7%.
RTX Earnings Transcript and NOC Earnings Presentation
Financial Leverage and FCF Capabilities
To fund these investment ambitions, and also meet shareholder distributions, you want these operating models to facilitate solid internally generated cash flow. Since these companies are already heavily operationally geared, it would also be preferable if the companies are making an effort to not be too financially geared, particularly during a down cycle and a tightening rate environment. It is commendable that both companies have made a concerted effort to bring down their debt-to-capital ratios, but yet again, RTX appears to be less financially geared, with a debt-to-capital ratio that is around 1500bps lower than Northrop Grumman's figure.
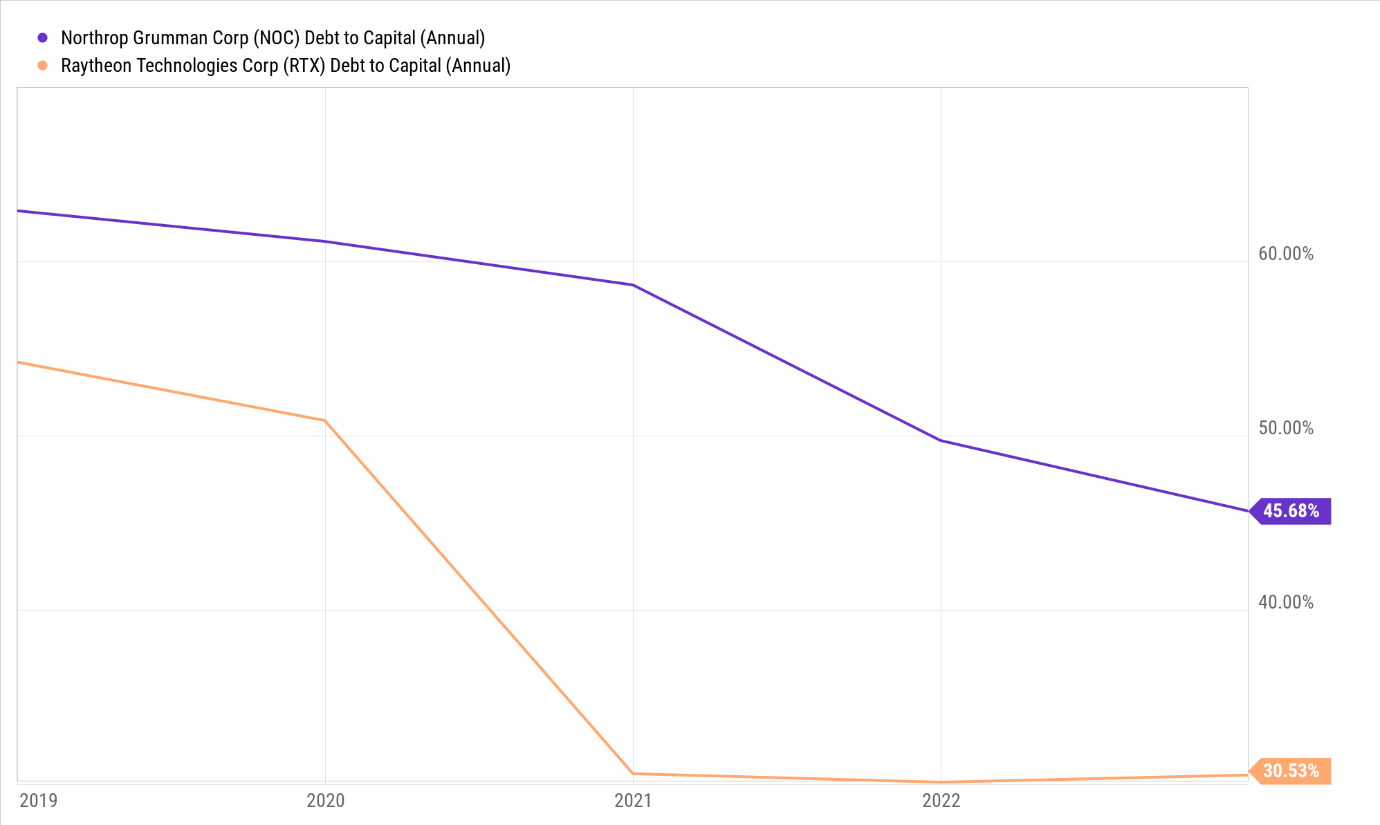
YCharts
On the free cash flow front, NOC looks poised to deliver compelling free cash flow growth in FY23 ( 34% YoY growth at the mid-point of management’s FCF guidance of $1.85-$2.15bn, and could potentially even rise to 57% YoY growth). Conversely, RTX is poised to face some working capital headwinds in FY23, which could prevent FCF growth (-2% YoY decline). That is certainly not ideal, but do also consider that RTX will still generate solid FCF of $4.8bn for this year. Crucially, if one were to consider the revenue estimates (source: YCharts) for both companies next year, it looks like the RTX model still does a better job of converting a higher threshold of sales into free cash flow.
Q4 Earnings Presentation, YCharts
Nonetheless, a superior FCF threshold in FY23 could prompt NOC to be more generous with their annual dividend growth, which has already been growing at a more compelling pace than RTX in recent years (3-year Dividend CAGR of 9.4% vs RTX’s figure of 5.9% ).
Financial Outlook
Last year, RTX closed the year on a stronger note, and this should set it up nicely to generate solid revenue growth for the foreseeable future. Despite having a larger backlog ($175bn vs $78.7bn for NOC), RTX witnessed far greater YoY growth in FY22, with the backlog growing at over 3x the pace of NOC’s equivalent figure (3.6% YoY) providing solid revenue visibility.
Also consider that after trading over the 1.2x mark for four years, NOC’s book-to-bill ratio is now precariously close to the 1x mark, indicating that the underlying demand isn’t as resilient as you’d like. Worryingly, management stated that in FY23, the book-to-bill ratio could drop below the 1x mark which certainly does not bode well for the future. Conversely, RTX’s book-to-bill ratio remains sturdy at 1.28x.
Earnings transcripts, 10K
Thus, in light of what I've covered above, it's no surprise to discover that the sell-side analyst community expects Raytheon to witness a superior revenue growth runway through FY25. It’s not just that, you can even get a sense of the operating leverage that could come through as the company’s EPS growth will likely exceed revenue growth through FY25. In FY23 RTX management is looking to bring through additional pricing power, particularly in the commercial aftermarket segment, whilst they also hope to negate $2bn of inflationary pressures. Conversely, with Northrop Grumman, EPS trends are likely to be subdued over the next three years, coming in at a slower pace than the revenue growth.
YCharts
Forward Valuations and Yield
Considering the more alluring growth runway highlighted in the section above, one would have expected RTX to trade at a higher forward P/E over NOC, but note that it only trades at a forward P/E (based on the expected FY24 EPS) of 18.1x, 8% cheaper than the NOC’s corresponding multiple.
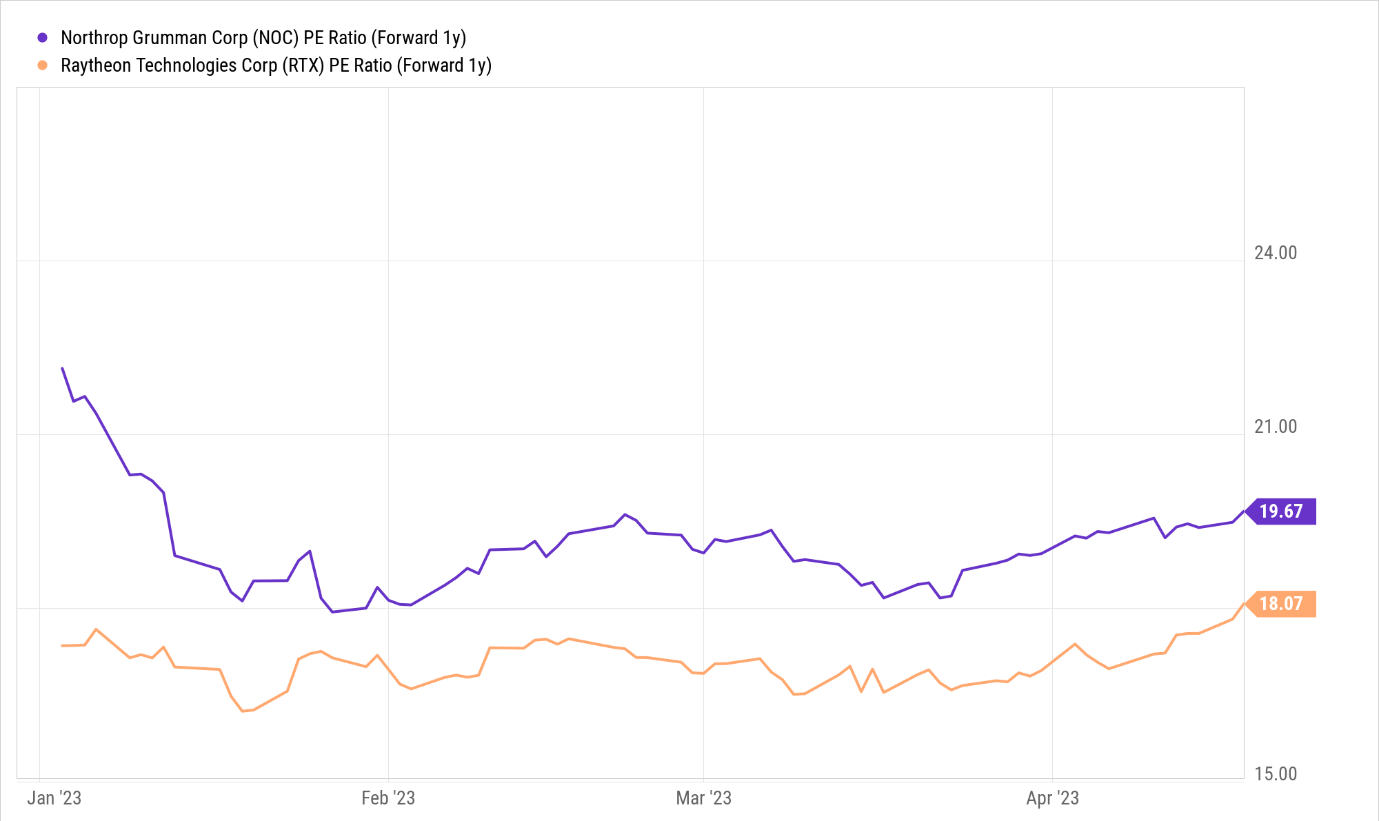
YCharts
Besides the cheaper valuation, you also get the benefit of a superior dividend yield of 2.1% with RTX, over 60bps higher than NOC’s corresponding number.
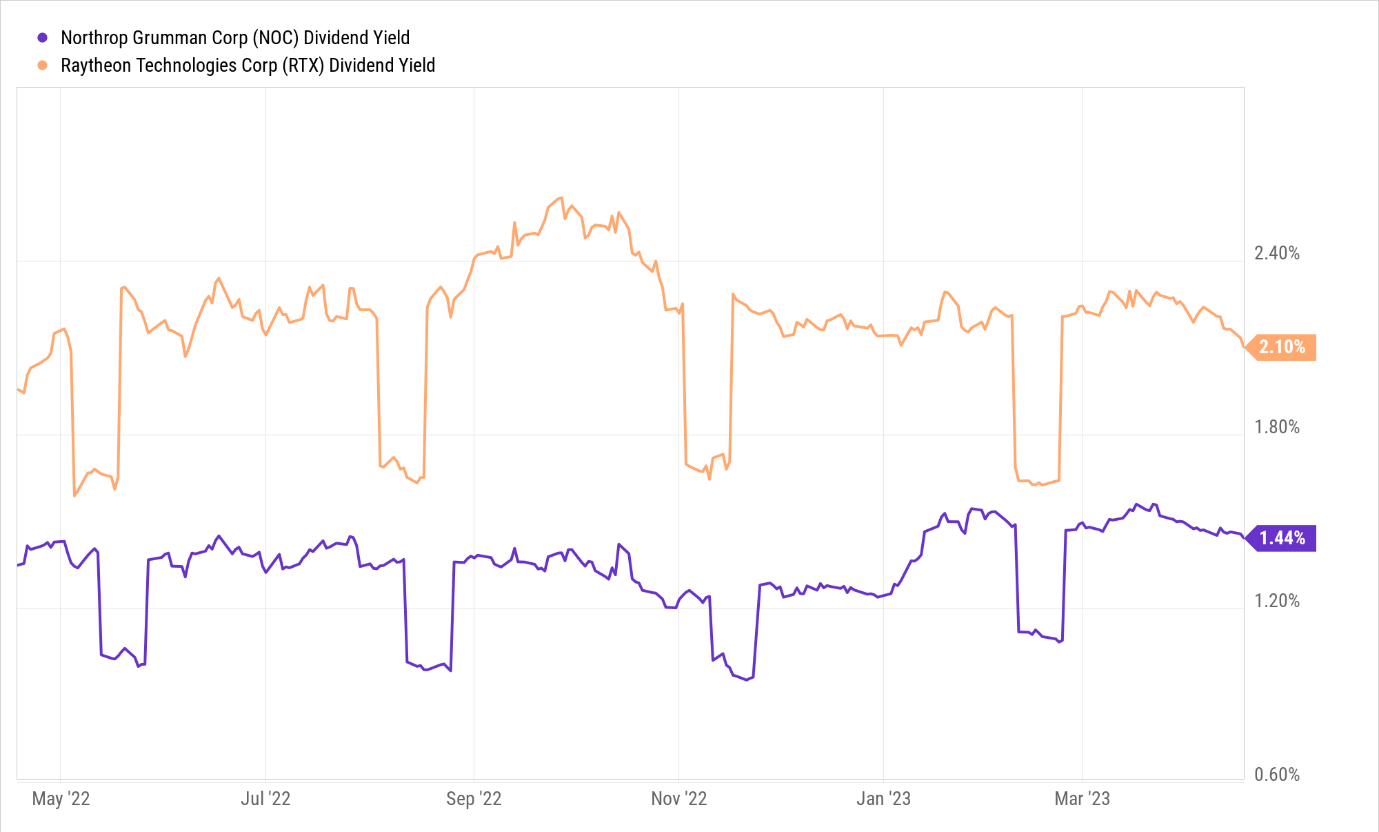
YCharts
Relative Positioning
We also thought it would be pertinent to see how these stocks are positioned relative to their peers from the broad aerospace and defense sector. The chart below shows that even though RTX has recovered some of its old stature, it is still below the mid-point of its range, and may continue to benefit from further mean-reversion momentum relative to other options in this space.
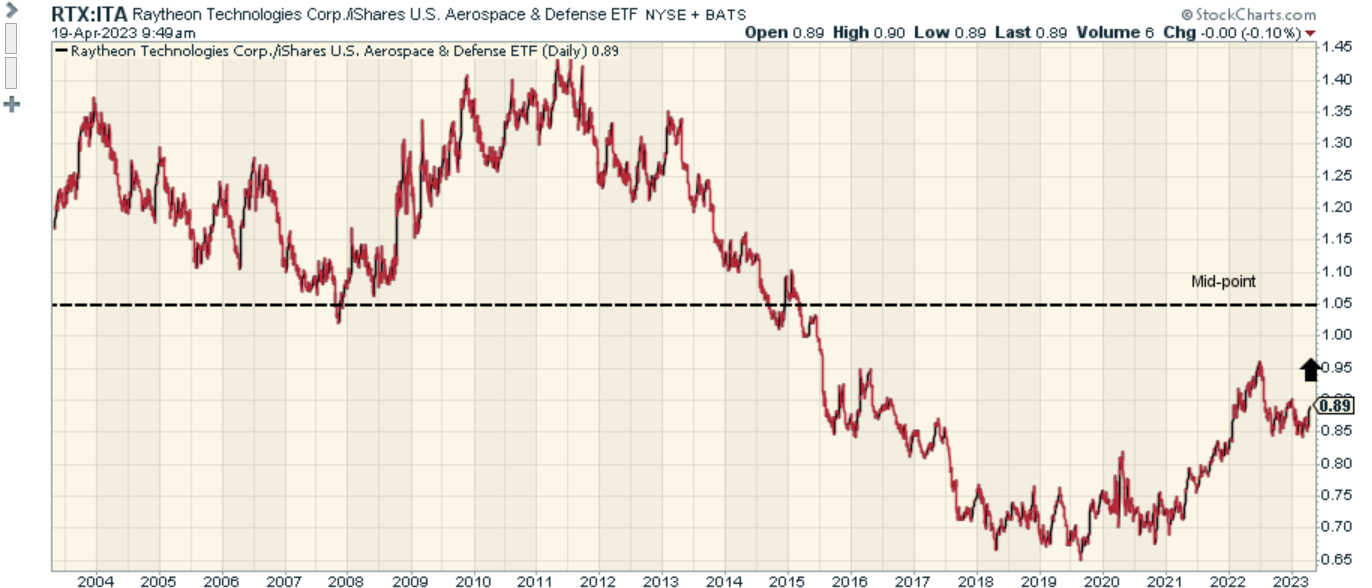
Stockcharts
Stockcharts
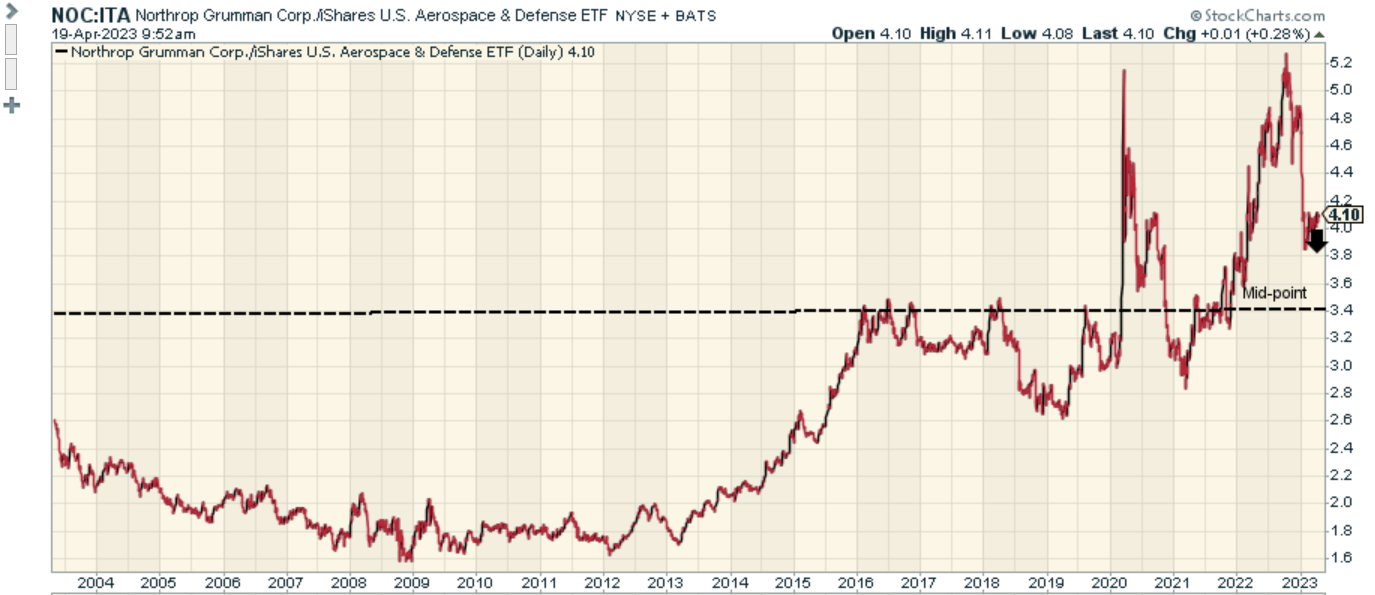
Conversely, when you look at NOC’s RS chart we can see that despite a steep pullback in its relative strength ratio from record highs late last year, it is still some way from the mid-point of the long-term range, which may prompt some investors to continue to rotate away from this ticker.
Closing Thoughts
In this article, we’ve gauged two major defense stalwarts across various parameters, and whilst Northrop Grumman is no slouch, it’s pretty evident that Raytheon is just a more compelling option trumping the former across most parameters. Despite coming up short relative to RTX, NOC advocates can take heart from the fact that the company’s superior FCF growth trajectory next year should hold it in good stead, even as RTX witnesses a slump on this front. Nonetheless, all things considered, our vote still goes to Raytheon Technologies.
For further details see:
Northrop Grumman Or Raytheon Technologies - Which One Gets Our Vote?