TOL - NVR: Lots Of Cash But No Margin Of Safety
2023-07-02 03:02:30 ET
Summary
- NVR is a low-growth cyclical company as its performance is tied to US Housing Starts where there was no growth in the long-term annual average over the past 70 years.
- Any analysis and valuation of NVR should be based on its cyclical performance. A valuation of NVR on such a basis showed that there is no margin of safety.
- NVR is financially sound with strong performance over the past cycle - 2005 to 2022 (peak-to-peak). It is a sound company there is not enough margin of safety currently.
Investment thesis
From 2005 to 2022, NVR, Inc. (NVR) revenue grew at a CAGR of 3.6 %. This is lower than the long-term GDP growth rate. During this period that was a strong correlation between NVR revenue and Housing Starts.
Housing Starts are cyclical. But over the past 70 years, there was no growth in the long-term annual average Housing Starts. As such, you should view NVR as a low growth cyclical company. A valuation of NVR on such a basis showed that there is no margin of safety.
Even if you assumed that there would be a 1/3 increase in the long-term annual average Housing Starts, there is not enough margin of safety if you consider that it would take another 5 years to reach this level. Furthermore even if you view NVR as a non-cyclical company, I still cannot get my 30% margin of safety.
Thrust of my analysis
In my article “ Home Builders' Base Rates: A Reference For Better Fundamental Analysis ”, I identified 9 listed home builders. These are companies with readily available financial data from 2005 to 2022 – the latest peak-to-peak Housing Starts cycle. NVR is one of the companies on that list.
I had previously determined the intrinsic value of Lennar (LEN), Toll Brothers (TOL), and Pulte (PHM) based on their performance over the 2005 to 2022 cycle. Refer to:
- Lennar – the market is pricing a change in the long-term Housing Starts.
- Toll Brothers: No Margin Of Safety Even With Uptick In Long-Term Annual Average Housing Starts.
- PulteGroup: No Margin Of Safety Based On A Cyclical Perspective
I will analyze and value NVR using the same approach as those for the others. You can then compare them on an “apple-to-apple” basis. This is the fourth article in my series to determine the cyclical value of the top 9 home builders. To recap:
NVR is a cyclical company and as such any analysis and valuation should be based on its performance over the cycle.
While nobody disputed the cyclical nature of the sector, we have different views on the long-term annual Housing Starts. As such I will value NVR based on 3 Scenarios:
- Scenario 1 – no change in the long-term annual Housing Starts of 1.5 million units.
- Scenario 2 – an increase in the long-term annual Housing Starts to 2.0 million units.
- Scenario 3 - assuming NVR is not a cyclical company. I assumed that the 2021 and 2022 performances represented the long-term performance.
The Gross Profits for the homebuilding segment under Scenarios 1 and 2 were computed based on Gross Profits = Settlements X Selling Price X Cyclical Gross Profit Margins. The Cyclical Gross Profit Margins were assumed to be the average 2005 to 2022 Gross Profit Margins (normalized margins).
The above formula was along the lines of Damodaran suggestion to reflect the current size of the business. According to him, we should take the current revenue and determine the cyclical earnings by multiplying it with the normalized margins.
NVR has 2 major operations – homebuilding and financial services. The homebuilding is the larger earnings contributor and I modeled the revenue based on Settlements X Selling Price.
The financial services operations only contributed about 2% of the total revenue in 2022. I modeled the revenue for this operation based on a linear regression equation. This was derived using the EXCEL plotting function as illustrated in Chart 1.
Chart 1: Link between Finance Services Revenue and Homebuilding Revenue (Author)
Cyclical sector
NVR operates in a cyclical sector as acknowledged by the company.
In my previous articles of this series, I drew the following conclusions based on my analysis of the Housing Starts and House Price Index. Refer to them for the details.
- Over the past 70 years, there is no growth in the long-term annual average Housing Starts. I took this long-term average as 1.5 million units per year.
- In the past 2 years, Housing Starts seem to be at the long-term annual average level.
- Over the past 70 years, there have been 4 occasions when the annual Housing Starts had exceeded 2 million units.
- While there is no growth in the annual average Housing Starts, there was long-term price growth. The revenue growth for the homebuilding sector resulted from both volume growth and price growth.
- There is debate about whether the current drop in Housing Starts is merely a temporary pullback from an uptrend, or the start of its downtrend leg.
I used these conclusions to determine the various parameters and assumptions for my valuation of NVR.
While nobody disputed the cyclical nature of the sector, we have different views on the long-term annual Housing Starts:
- I have assumed that there is no change to the long-term annual average Housing Starts. My basic argument is that 70 years of data cannot be wrong.
- There are many Seeking Alpha readers who believe that there is some fundamental change to this long-term annual average Housing Starts.
I have already covered the pros and cons of these 2 views in the previous articles. Refer to them.
I do not have a crystal ball on how the future will unfold and as such I will value NVR under both views and let you decide what to do.
Performance
I look at 3 metrics to get an overview of the performance over the cycle – revenue, profit after tax (PAT), and gross profitability (gross profits/total assets).
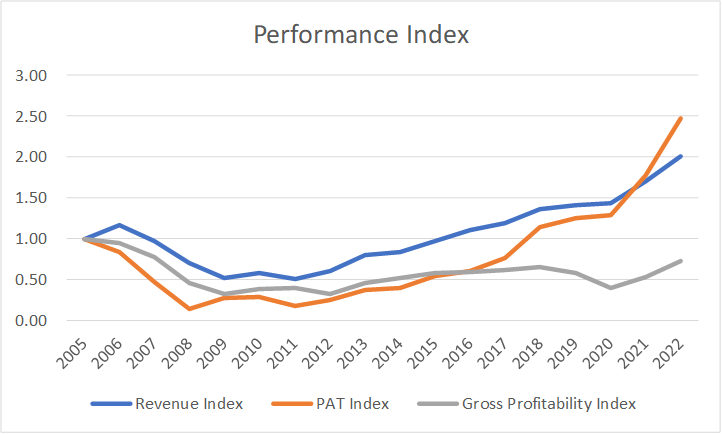
Chart 2: NVR Performance Index (Author)
Chart 2 shows the performance of NVR over the 2005 to 2022 cycle. During this period there were:
- 0.69 correlation between NVR revenue and the Housing Starts.
- 0.71 correlation between the US Housing Starts and NVR’s Settlements.
The conclusion is that NVR is a cyclical company whose performance is tied to the US Housing Start.
Note the following performances:
- Revenue doubled from 2005 to 2022. But looking at Chart 3, you can see that this was driven more by an increase in Settlements than price growth.
- NVR managed to be profitable throughout the cycle.
- While profits grew from 2005 to 2022, gross profitability did not. You should not be surprised. The total assets over the past 2 years averaged USD 5.7 billion compared to an average of USD 2.4 billion for 2005/16. In other words, there was no improvement in capital efficiency.
Chart 3: Homebuilding Performance Index (Author)
The revenue performance is interesting. From 2005/06 to 2021/22, revenue grew at about 3.6 % CAGR. But this was due more to volume growth than price growth
I estimated that during this period physical volume (as measured by Settlements) grew at 2.9 % compounded per year while unit selling price grew at 0.7 % CAGR.
The main difference between NVR and the 3 other homebuilders that I had covered is that NVR’s growth was all organic. There was hardly any acquisition.
What does all this mean?
- NVR is a low-growth company in a no-growth (volume terms) cyclical sector. We can value it using a single-stage valuation model.
- We do not have to account for the improvements in gross profitability. This is unlike my Pulte analysis where its 2020/21 gross profitability was double that of 2005/06.
Financial position
I would rate NVR as financially strong based on the following:
- As of the end of Dec 2022, it has USD 2.5 billion in cash. This is about 44 % of its total assets. This is a very high ratio as the ratios for the 3 other homebuilders only ranged from 7 % to 12 %.
- It has a Debt Equity ratio of 0.29 at the end of 2022. My base rate for the sector was a mean Debt Equity ratio of 0.41 for 2022.
- Over the past 18 years, it generated an average of USD 560 million per year in Cash Flow from Operations compared to the average PAT of USD 547 million per year. The mean Cash Flow from Operations over the same period for my base rate was USD 328 million.
- It managed to generate positive Cash Flow from Operations for all 18 years. It was the best-performing company for this metric among the 9 companies covered in my base rate analysis.
I would like cyclical companies to be financially sound going into the downtrend leg of a cycle as I do not know how severe the downtrend will be. NVR more than fits the bill.
Valuation
I valued NVR based on using the single-stage Free Cash Flow to the Firm (FCFF) model.
I focused on 3 Scenarios:
- Scenario 1. I assumed that 2021/22 represented the long-term annual average Housing Starts of 1.5 million units.
- Scenario 2. This assumed that the long-term annual average Housing Starts was increased to 2.0 million units.
- Scenario 3 – This assumed a non-cyclical scenario. I assumed that the 2021 and 2022 performances represented the long-term performance. As such I used the actual average 2021 and 2022 Gross Profit Margins.
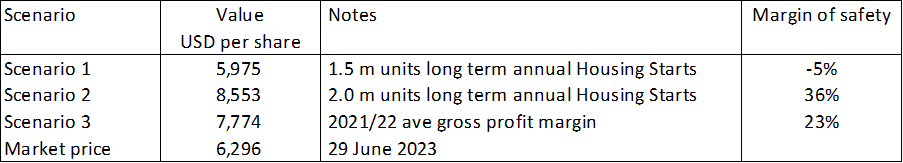
Table 1 summarized the results. You can see that there is no margin of safety under Scenario 1. While there is a margin of safety under Scenario 3, I do not think that this is realistic. Besides this is still lower than my target 30% margin of safety.
Note that the value under Scenario 2 is over-estimated as it assumed that we are now at the 2.0 million units of Housing Starts. In reality, it would take a few more years to reach this level and the valuation would be reduced accordingly. If we assumed that it will another 5 years to reach the 2.0 million units long-term annual average Housing Starts, the margin of safety is reduced to 12 %.
Table 1: Summary of NVR Valuation (Author)
Sensitivity analysis
For the valuation shown in Table 1, I took the average Gross Profit Margins for each year from 2005 to 2022.
But in my earlier Lennar article, I had computed the normalized Gross Profit Margins = (sum of 2005 to 2022 Gross Profits) divided by the (sum of the 2005 to 2022 revenue).
This was different from what I did for NVR above.
If I had adopted the Lennar approach, the value of NVR would be about 5% higher as shown in Table 2. Changing how the average gross profit margins are computed does not change the conclusions for Scenarios 1 and 2.
Table 2: Value with a different basis for estimating the gross profit margins (Author)
Valuation model
I valued NVR on the same basis as I did for the other homebuilders using the single-stage Free Cash Flow to the Firm (FCFF) model.
Value of the operating assets of the firm = FCFF X (1 + g) / (WACC – g)
Where:
FCFF = EBIT X (1 – t) X (1 – Reinvestment rate)
g = growth rate. I assumed that this was the 3.6 % per annum historical growth from 2005 to 2022.
t = tax rate based on the past 3 years average rate.
WACC = weighted average cost of capital derived from the first page of a Google search for the term “NVR WACC” as summarized in Table 3.
Table 3: Estimating the WACC (Various)
Reinvestment rate = average 2005 to 2022 Reinvestment rates taking into consideration the past 3 years’ average tax rate.
EBIT = Gross profits – Selling, Admin, and Selling or SGA expenses – Other expenses and asset write-downs
Gross Profits
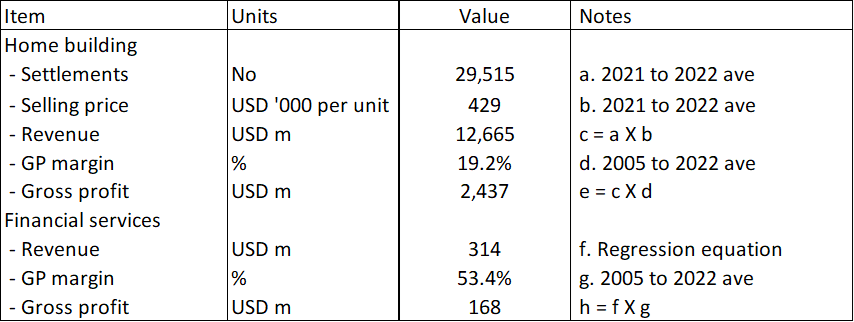
The Gross Profits for NVR were derived as shown in Table 4.
Table 4: Deriving the Gross Profits (Author)
The Gross Profits for the homebuilding operations = Settlements X Selling Price X Gross Profit Margins.
The Gross Profits for the financial services operations = Revenue X Gross Profit Margins.
The revenue for the financial services we derived based on the linear regression equation using EXCEL as shown earlier in Chart 1 where:
- Revenue for the homebuilding operations was the independent variable.
- Revenue for the financial services operations was the dependent variable.
The Gross Profit Margins for the financial services operations were based on 2005 to 2022 average margins.
Sample calculation
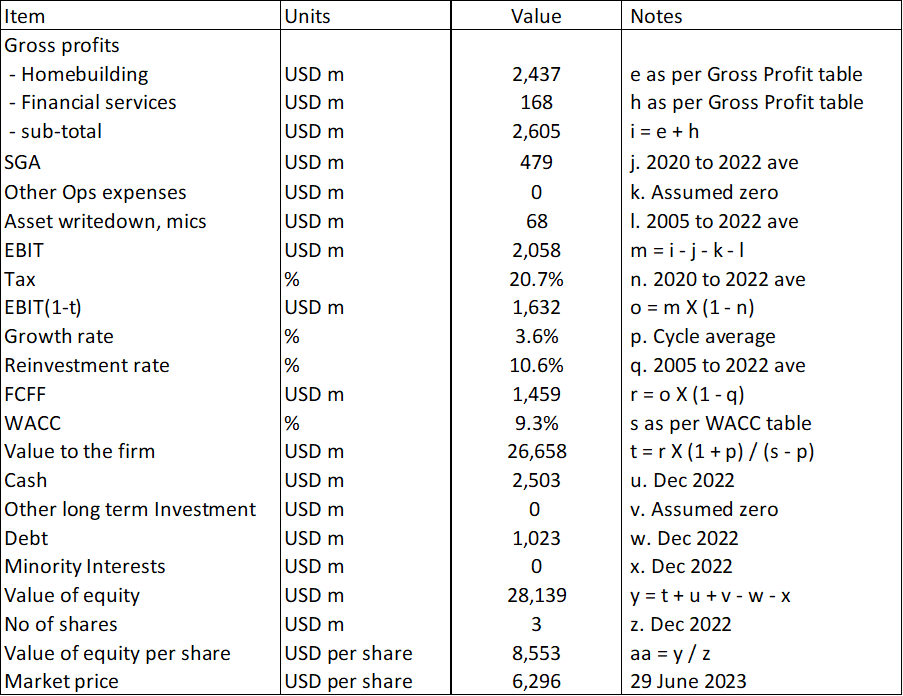
Table 5 shows a sample calculation for the intrinsic value.
Table 5: Calculating the intrinsic value (Author)
Notes to Table 5: Over the past 18 years, NVR incurred some asset write-downs and other one-off charges. I included the average in my valuation.
Risks and limitations
For NVR, I used the same valuation model as that for the other homebuilders. So my comments on the risks and limitations for NVR are no different from the others. If you want to see an example, you can refer to the Pulte article where I have summarized them into 3:
- Low WACC.
- Growth
- Regression equation.
The only other comment I would make for NVR is its high cash position. This high cash of course affected its returns as measured by the gross profitability. Chart 4 shows what I mean.
Chart 4: Comparative gross profitability (Author)
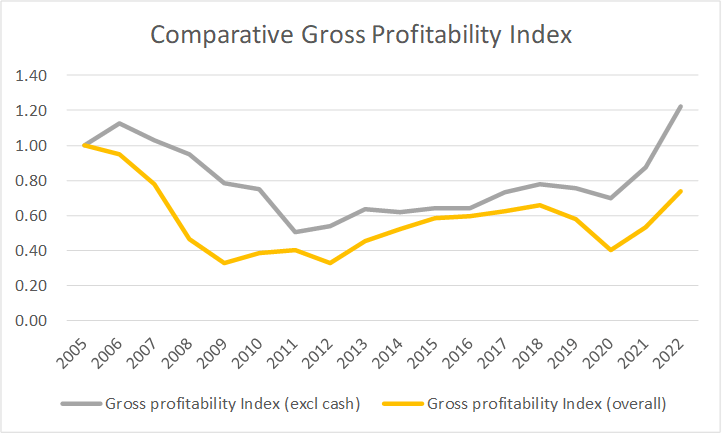
In this Chart, I compared the conventional gross profitability defined as gross profits / (total assets) with one computed as gross profits / (total assets – cash).
You can see that if you ignore cash, there are improvements in gross profitability relative to 2005. This augurs well for NVR. According to Professor Novy-Marx, this metric has the same power as PBV in predicting cross-section returns.
I would interpret this as the company being stronger going into the current downtrend compared to 2005. In 2005, it had cash-to-total assets of 8%. In 2022 it was 44 %. I would consider this another form of margin of safety.
Note that I did not cover a Scenario where I considered the improved gross profitability. This was different from what I did for Pulte. This was because for Pulte, the gross profitability doubled from 2005 to 2022. But for NVR there was only a 20 % improvement. Besides Pulte's gross profitability had an improving trend since 2009.
Conclusion
While I would rate NVR as financially sound, I would not consider it a high-growth one. Given this and that it is a cyclical company, any analysis, and valuation of NVR should be based on its performance over the cycle.
I assumed that the cycle is represented by the 2005 to 2022 performance. This is pegging it to the latest peak-to-peak Housing Starts cycle.
My valuation of NVR over the cycle showed that there is no margin of safety. The crux of my valuation is that there is no long-term annual average Housing Starts growth.
Even if you assumed that there is a 1/3 increase in the long-term annual average Housing Starts, my analysis showed that there is only a 12% margin of safety if I assumed that it would take 5 years to reach this increased level. This is not sufficient as my target is a 30% margin of safety.
There is also not enough margin of safety if you assumed that NVR is a non-cyclical company and that the past 2 years’ performance represented its future.
NVR is the best among the 4 companies I covered so far. But I would not invest in NVR at the current price. But there may be a buying opportunity if interest rates continue to go up this year and affects NVR's 2023 sales. Let us hope the short-term investors get spooked by this and exit.
“We expect that demand for new homes will continue to be negatively impacted by higher mortgage interest rates and lower consumer confidence driven by affordability issues, high inflation, anticipated further interest rate increases and the possibility of a recession.” NVR From 10k 2022.
I am a long-term value investor and my analysis and valuation is based on the long-term prospects of a company. This is not an analysis for those seeking to make money over the next few weeks or months.
For further details see:
NVR: Lots Of Cash But No Margin Of Safety