NVDA - OEF: A Premium Valuation Monitoring Technical Strength And Seasonal Risks
2023-12-11 17:49:19 ET
Summary
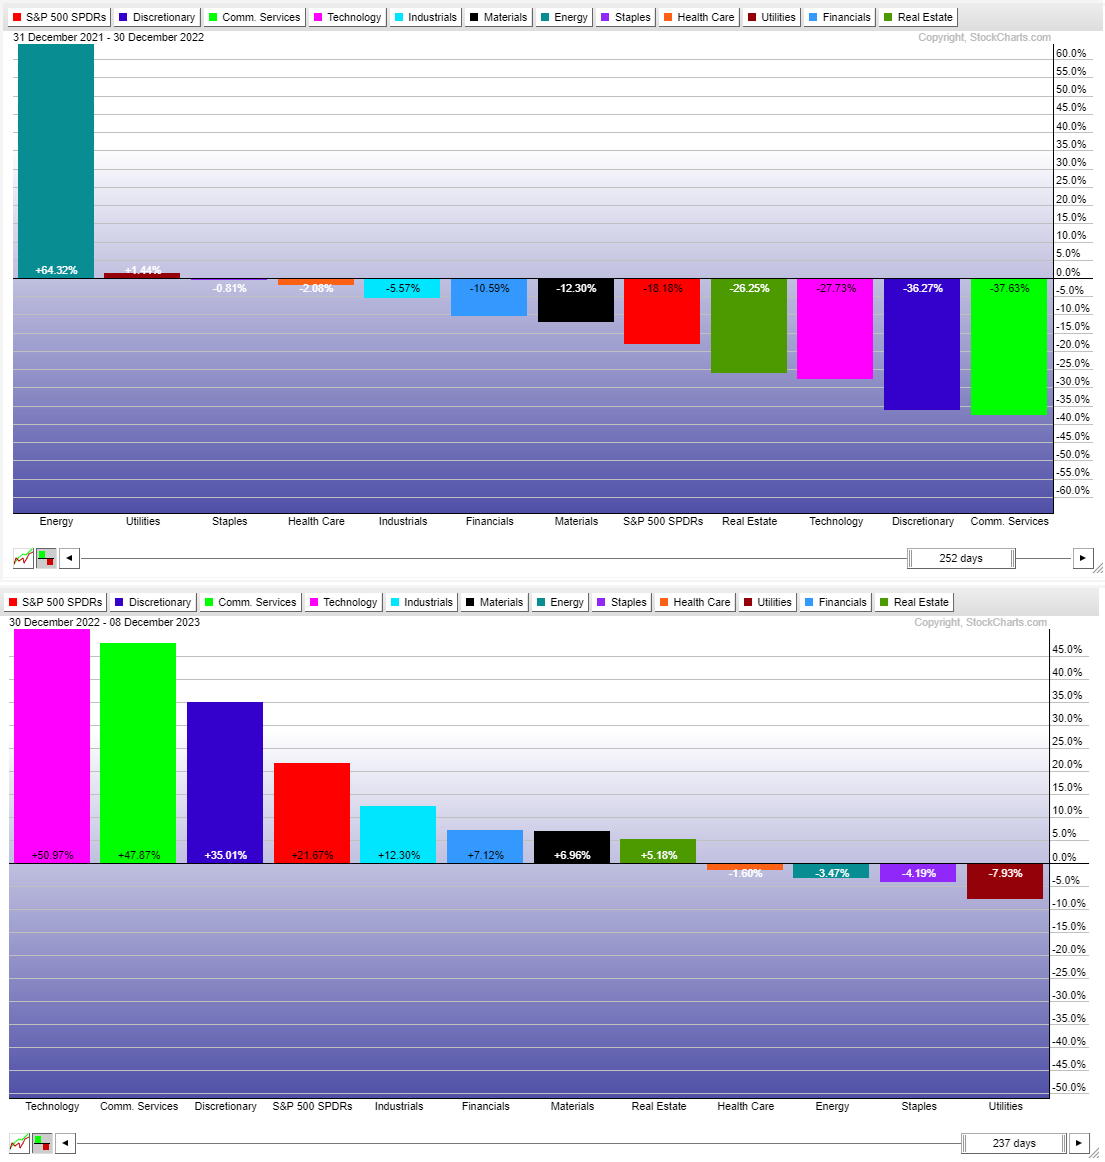
- Stocks surged in 2023, with the tech and communication services sectors leading the way and Energy, Staples, and Utilities performing poorly.
- The iShares S&P 100 ETF is a large portfolio with strong share-price performance and favorable characteristics.
- OEF has a high concentration in the Information Technology sector and its performance trends have been positive, but its valuation is considered rich.
- I highlight key price levels to watch as we approach 2024.
It has been a whirlwind year for investors. Stocks surged to jumpstart 2023 but then a regional-banking crisis slammed value stocks and small caps while mega caps enjoyed AI-related tailwinds throughout the first half. It was a reversal of fortune among styles and sectors this year compared to what worked in 2022.
Indeed, it’s become commonplace to see such inflections take place at the turn of the year. Recall how stocks peaked during the first week of 2022 before a bear market got underway.
So far this year, the TMT sectors of Information Technology, Communication Services, and Consumer Discretionary have led the way, while Energy, Staples, and Utilities (the top 3 sectors from 2022) have been the worst.
Considering this trend and other factors that I will detail, I have a hold rating on the iShares S&P 100 ETF ( OEF ). I see the fund as richly valued, though its high-quality portfolio warrants some degree of a valuation premium. Its technical view remains healthy, however.
2023's Sector Winners Were the 2022 Laggards
According to the issuer , OEF offers investors exposure to the 100 largest US companies in a single ETF. It can be used as a long-term core holding, though I encourage investors to consider diversification through other funds that feature exposure to domestic SMID caps and non-US equities. The ETF seeks to track the investment results of an index composed of 100 large-capitalization U.S. equities.
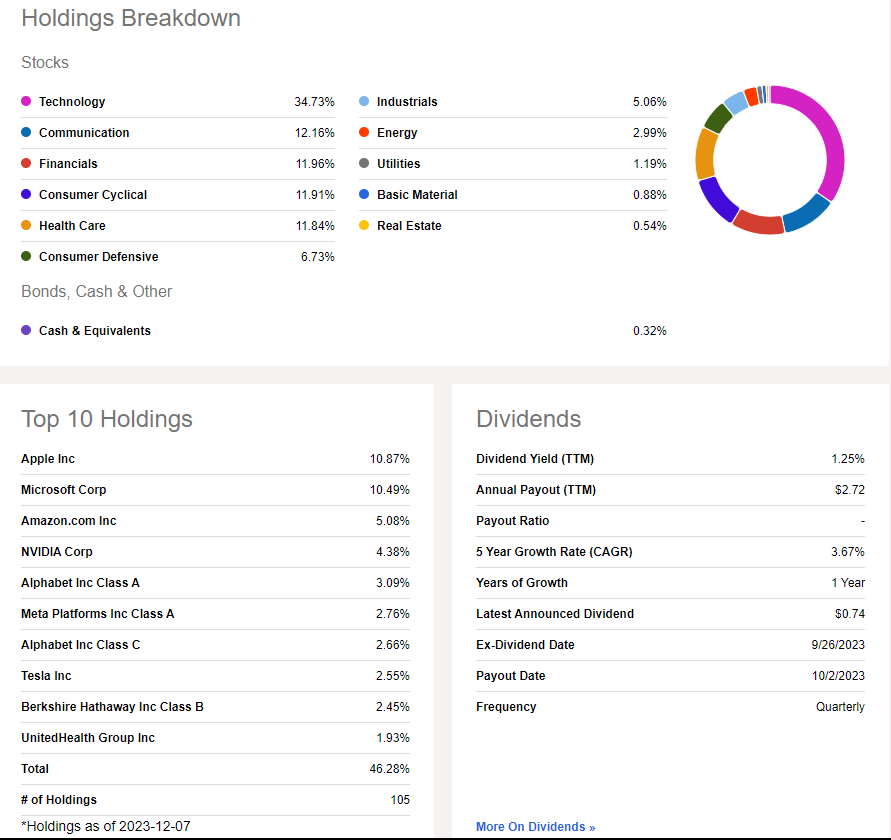
OEF is a large portfolio with more than $12 billion in assets under management and it pays a below-market 1.25% dividend yield as of December 8, 2023. Ranked 3 out of 177 in its ETF Sub Class, per Seeking Alpha’s Quant Ranking system, the fund sports strong share-price momentum and favorable risk characteristics.
Liquidity is also robust with OEF given its average daily trading volume of more than 400k shares and a narrow 30-day median bid/ask spread of just two basis points. OEF has a low 0.20% annual expense ratio , though you can invest in the broad US stock market for just a few basis points through other index products.
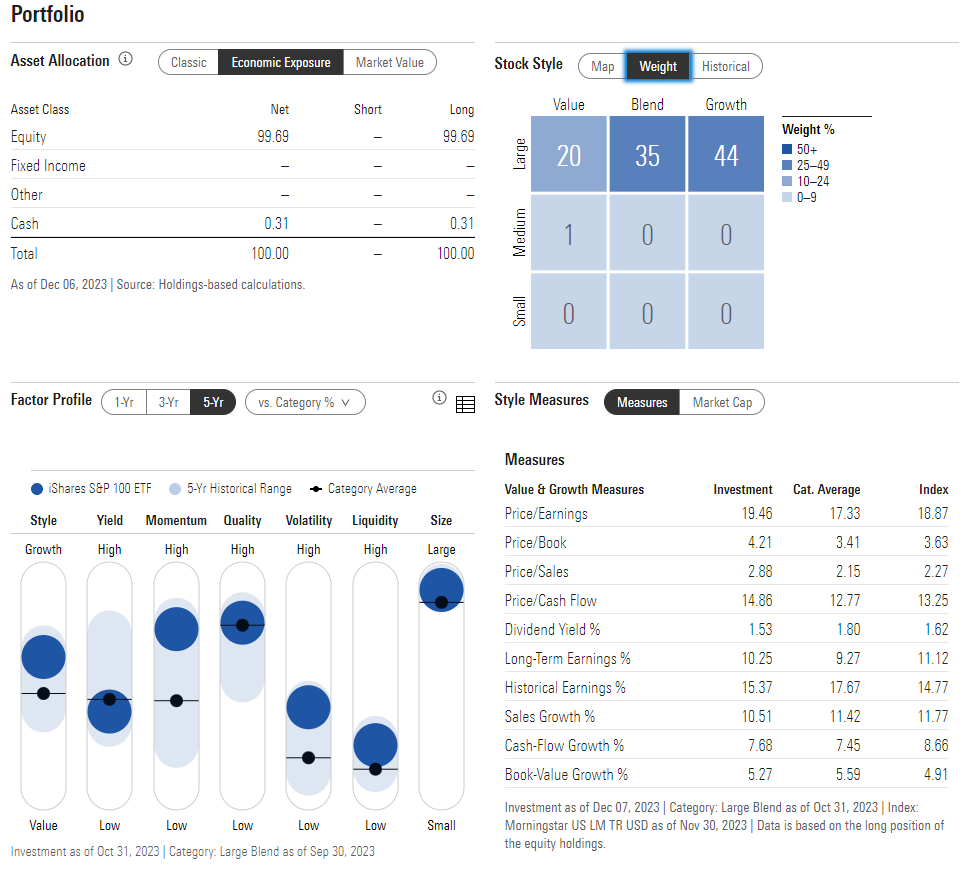
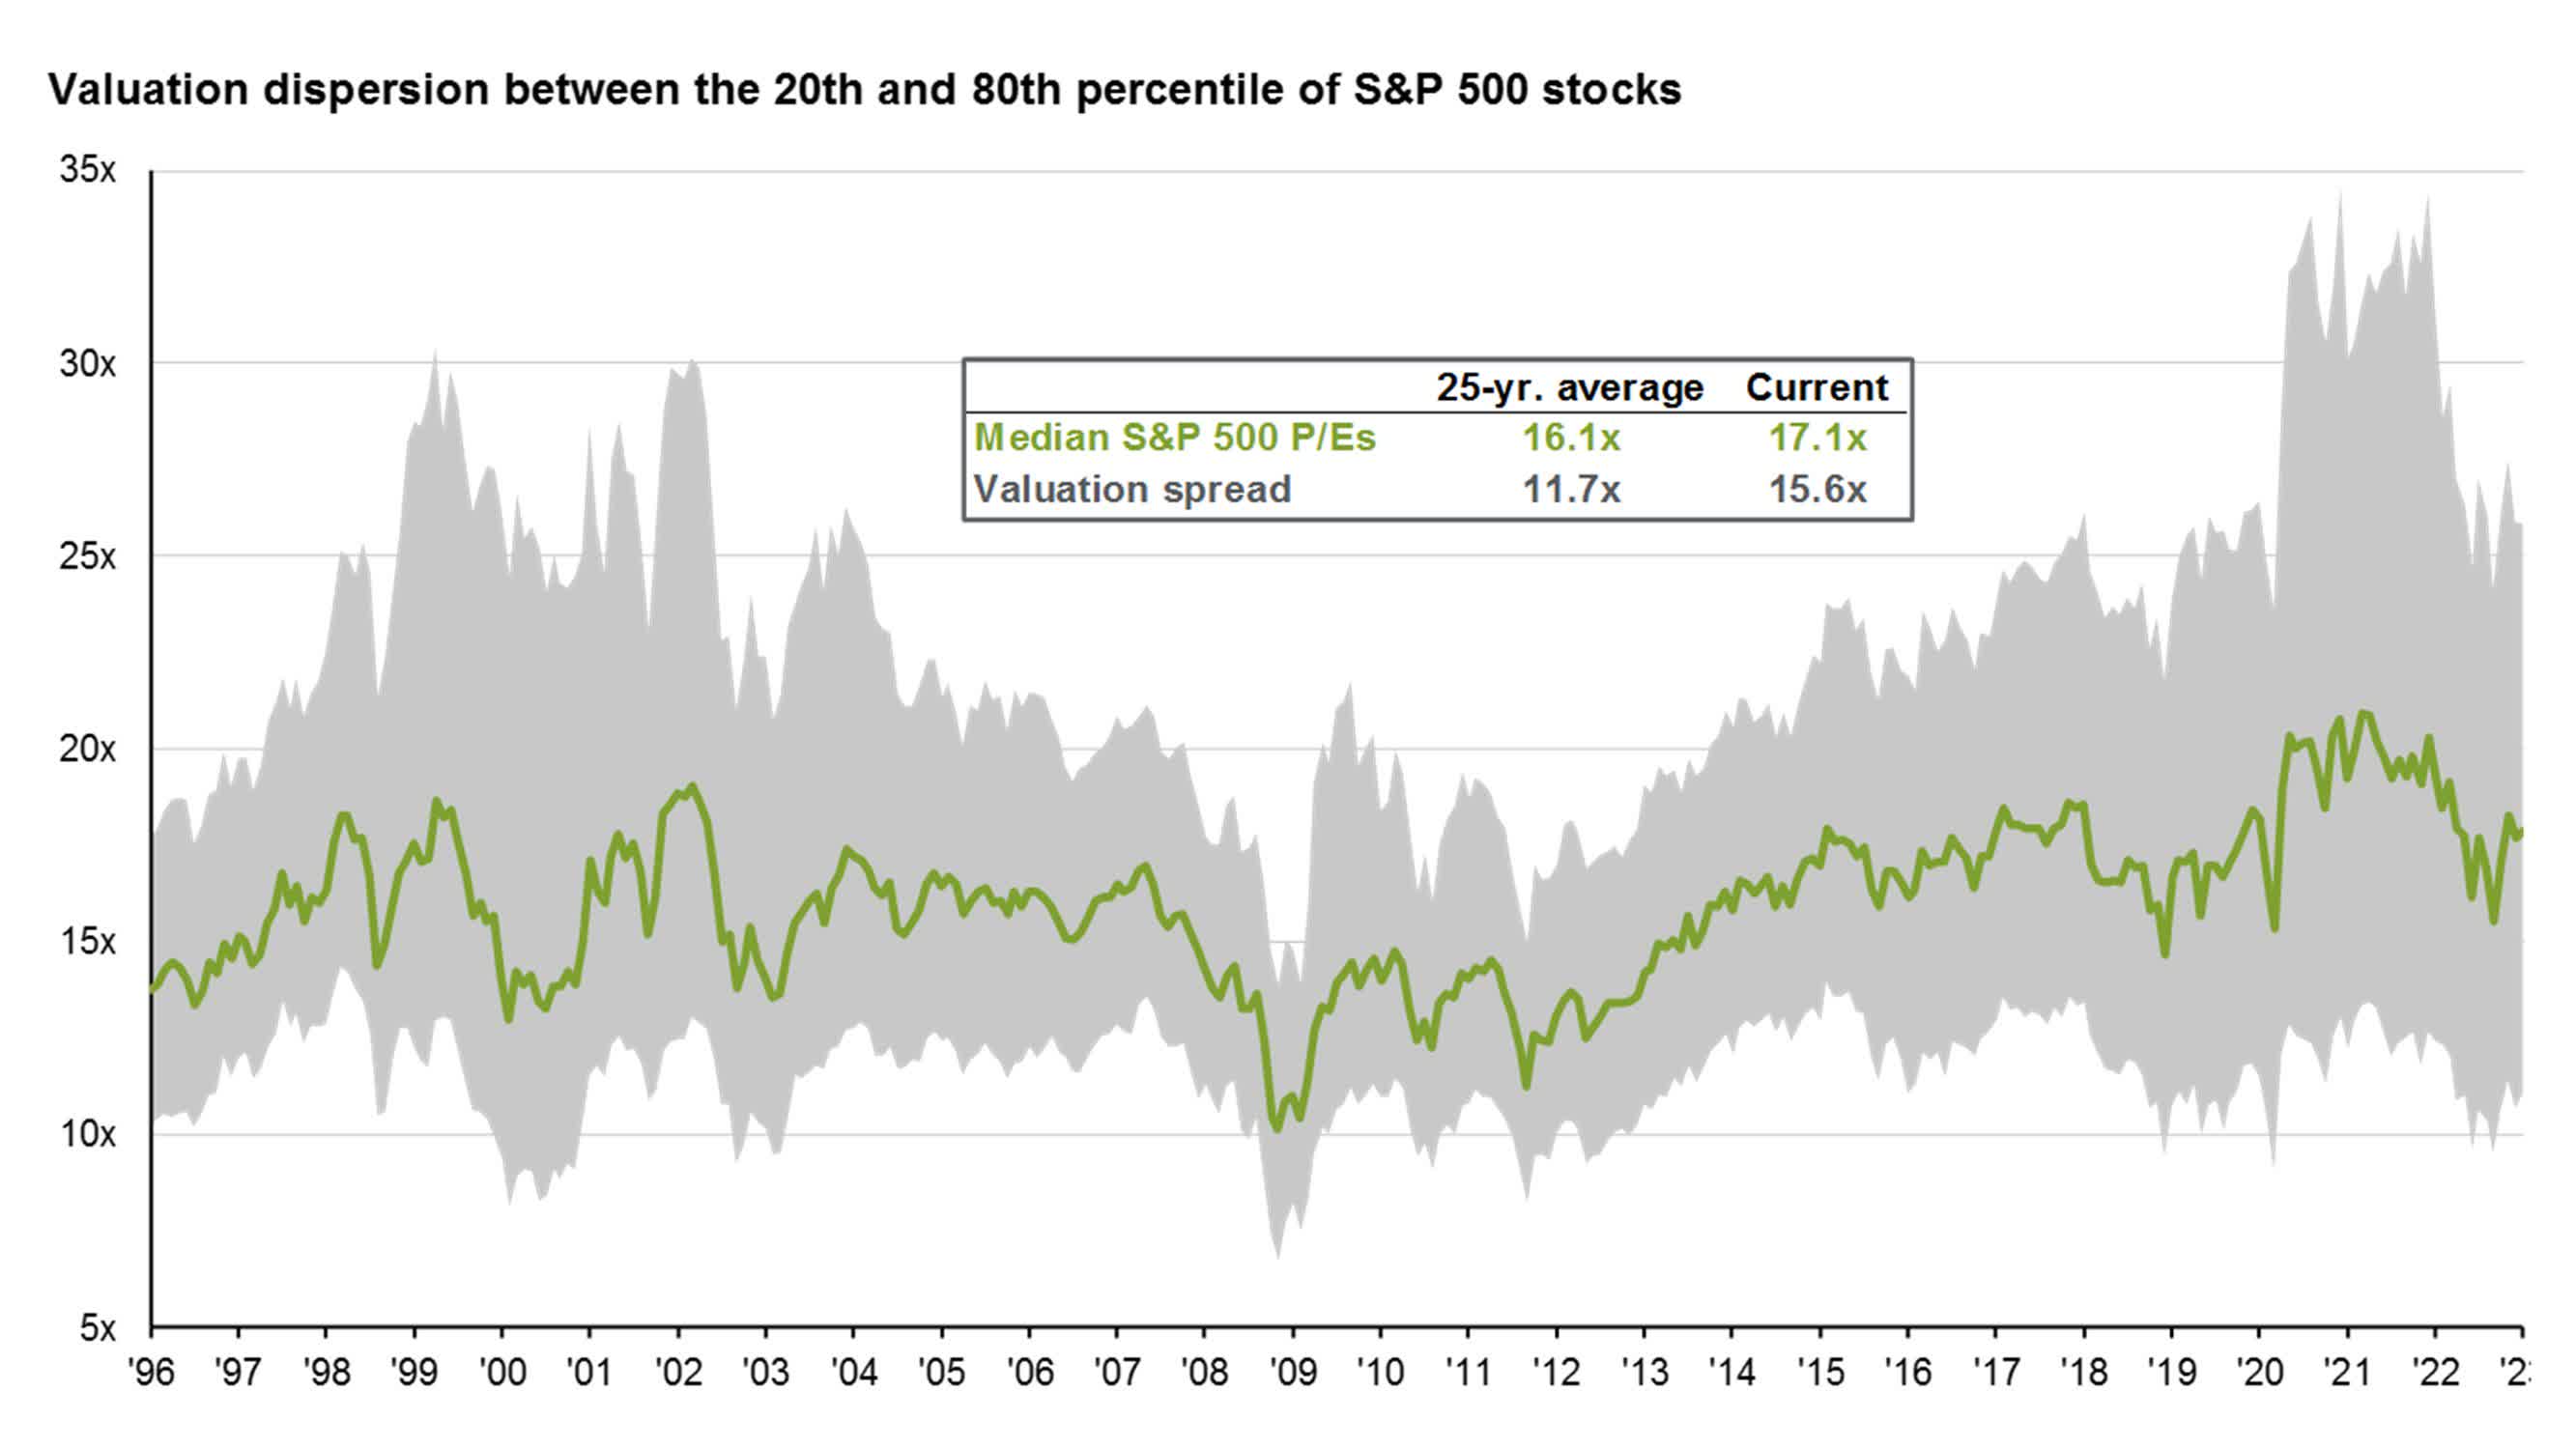
Digging into the portfolio, the 5-star, Silver-rated by Morningstar, portfolio is concentrated in the mega caps with lean towards a Growth-style. Its current price-to-earnings ratio is close to 20, above the average of the S&P 500 and considerably higher than the S&P 500’s median company earnings multiple of 17.1, according to J.P. Morgan Asset Management’s December Guide to the Markets.
Still, OEF sports a high long-term earnings growth rate above 10%, so the PEG ratio is not at nosebleed levels. With a price-to-sales ratio approaching three, I assert that valuation is rather rich today.
OEF: Portfolio & Factor Profiles
Big S&P 500 Valuation Dispersion
OEF is also a focused fund given its high 35% weight to the growth-heavy Information Technology sector, the top-performing area of the market in 2023 (charted earlier in the article). There’s relatively light value exposure, though the Financial space is the third-biggest sector weight at 12%.
Of course, it is key to pay attention to trends with the five largest companies in the fund as they make up more than one-third of the allocation. Apple ( AAPL ), Microsoft ( MSFT ), Google ( GOOGL ), Amazon ( AMZN ), and NVIDIA ( NVDA ) will have an outsized impact on OEF compared with the S&P 500 ( SPY ) or Total US Stock Market ETF ( VTI ).
OEF: Holdings & Dividend Information
Seasonally, the easy money may have already been made in OEF, according to 20-year performance trends provided by Stockcharts.com . December often features a modest gain, but we are already higher on the month, though the back half of December is usually up, with strong returns during the traditional Santa Claus Rally period – the last five days of the year and the first two trading sessions of the new year.
Returns have been soft in January and February, though, with volatility often seen at times in March. So, the seasonal view is less favorable compared with, say, two months ago.
OEF: Performance Trends Lackluster Starting In January
The Technical Take
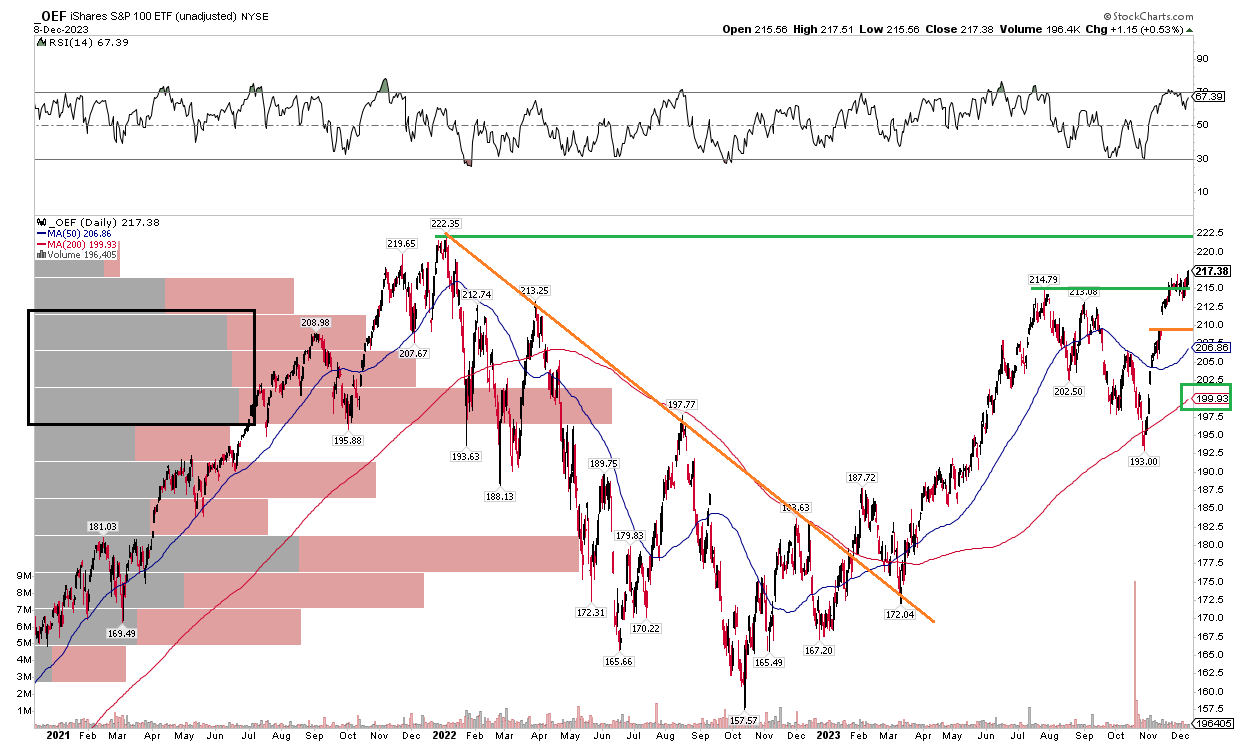
OEF has been a relative winning ETF in 2023. Notice in the chart below that shares are encroaching on the all-time high notched in early 2022, just above $222. Settling at a fresh 23-month high last week, the largest 100 stocks in the S&P 500 have strong absolute and relative momentum. I like that the fund is above its summertime highs, though I caution investors about a gap that is seen near $209 – that level could be filled before new all-time highs are made. Still, with a long-term 200-day moving average that is positively sloped and with a significant amount of volume by price underneath the current share price, there are supportive indicators to pay attention to.
But what might 2024 have in store for OEF from a technical point of view? Let’s do some charting based on the magnitude of the Q3-Q4 correction. The drop of $22 allows us to project a possible upside price objective. If we add that amount on top of the previous resistance point of $215, then $237 could be in the works over the coming months. While anything could happen, I see support at the rising 200dma, currently near $200, and at that near-term gap just below $210.
Overall, with solid relative strength, OEF has a lot working for it when assessing technical trends.
OEF: Bullish Momentum, All-Time Highs In Play
The Bottom Line
I have a hold rating on OEF. I like the technical situation and relative strength, but its valuation heading into the new year is not a screaming buy, and we have historically seen key turns in styles and sector preferences when the calendar flips.
For further details see:
OEF: A Premium Valuation, Monitoring Technical Strength And Seasonal Risks