REIT - Office REITs: The New Malls
2023-05-19 09:00:00 ET
Summary
- The new pariah of the commercial real estate sector, Office REITs, have remained in free-fall in recent months, plunging another 30% this year following a plunge of nearly 40% last year.
- Just how bad is it? The surge in interest rates has turned a weak-but-manageable situation into a bleak one, but there is more nuance than what the prevailing narrative would suggest.
- Debt service expenses have been the primary culprit behind the wave of recent loan defaults from private equity firms Brookfield, Blackstone, and Pimco, and the eight dividend cuts from office REITs.
- Nationally, property-level cash flows remain within 5% of pre-pandemic levels, but leasing activity has dipped by over 30%. Coastal tech-heavy markets remain at sub-50% daily utilization rates, but Sunbelt and secondary markets have recovered to over 75%.
- Much like the e-commerce impact on malls, supply/demand conditions will eventually normalize as properties get repurposed or outright abandoned. We remain bearish on coastal REITs with transit-heavy commutes - the new "Class C/D malls" - but we're calling a bottom for the handful of Sunbelt-focused REITs.
REIT Rankings: Office
This is an abridged version of the full report and rankings published on Hoya Capital Income Builder Marketplace on May 16th.
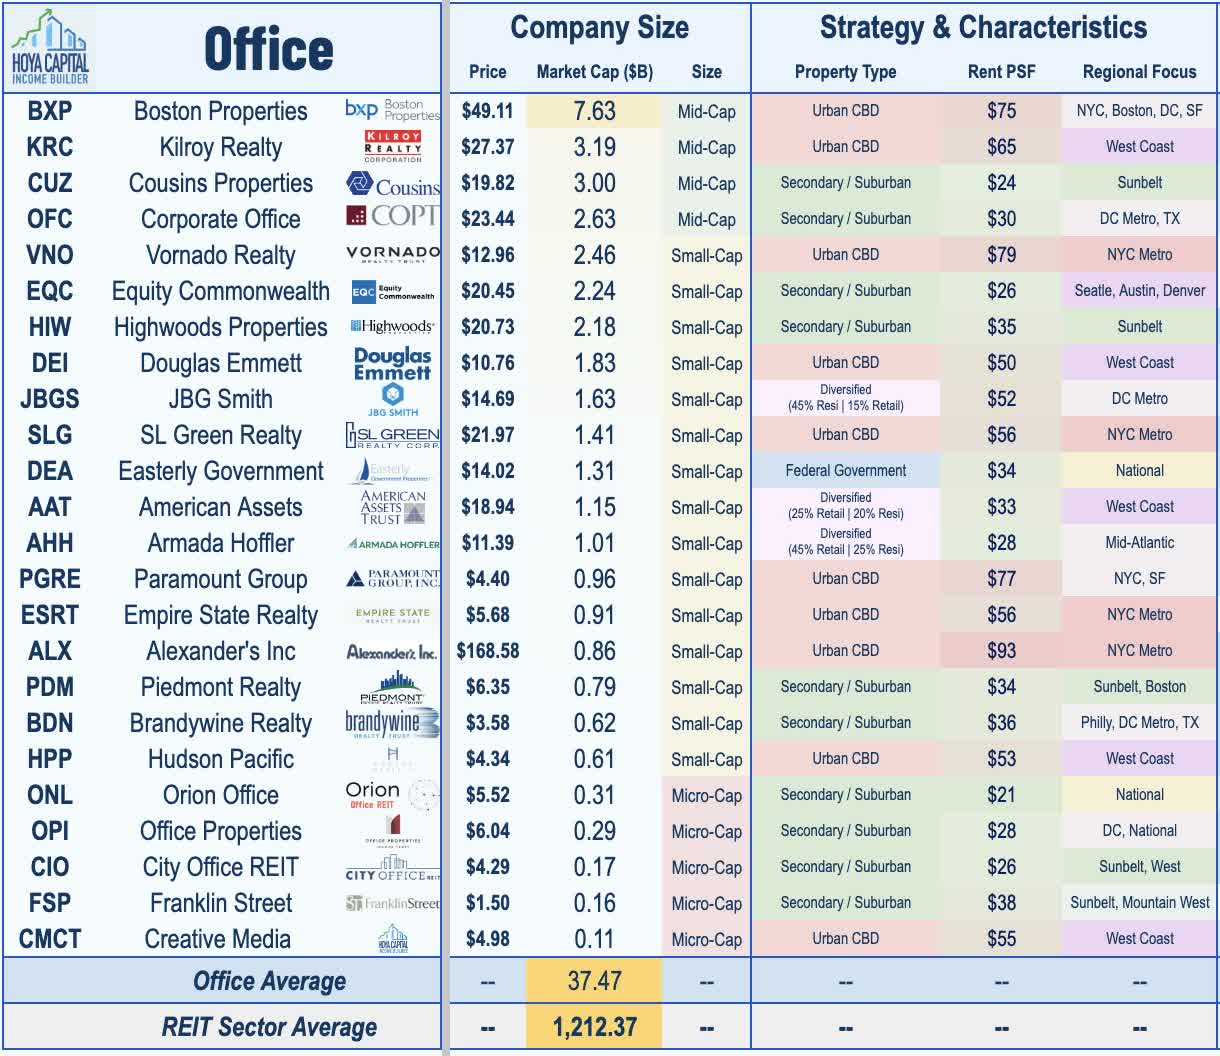
The new pariah of the commercial real estate sector, Office REITs have remained in free-fall in recent months, plunging another 30% this year following a plunge of nearly 40% in 2022. Just how bad is it, though? As we'll explain throughout this report, the surge in interest rates has turned a weak-but-manageable situation into a bleak one, but there is more nuance than what the prevailing narrative would suggest. Coastal tech-heavy markets remain at sub-50% daily utilization rates, but Sunbelt and secondary markets have recovered to over 75%. Leasing trends and rental rates have exhibited similarly wide variance with Sunbelt and secondary-focused REITs, so far, exhibiting leasing trends that are more akin to a typical recession than a catastrophic collapse that the current valuations would suggest. Within the Hoya Capital Office REIT Index , we track the 23 office REITs, which account for roughly $37 billion in market value and comprise 5% of the market-cap-weighted REIT Indexes.
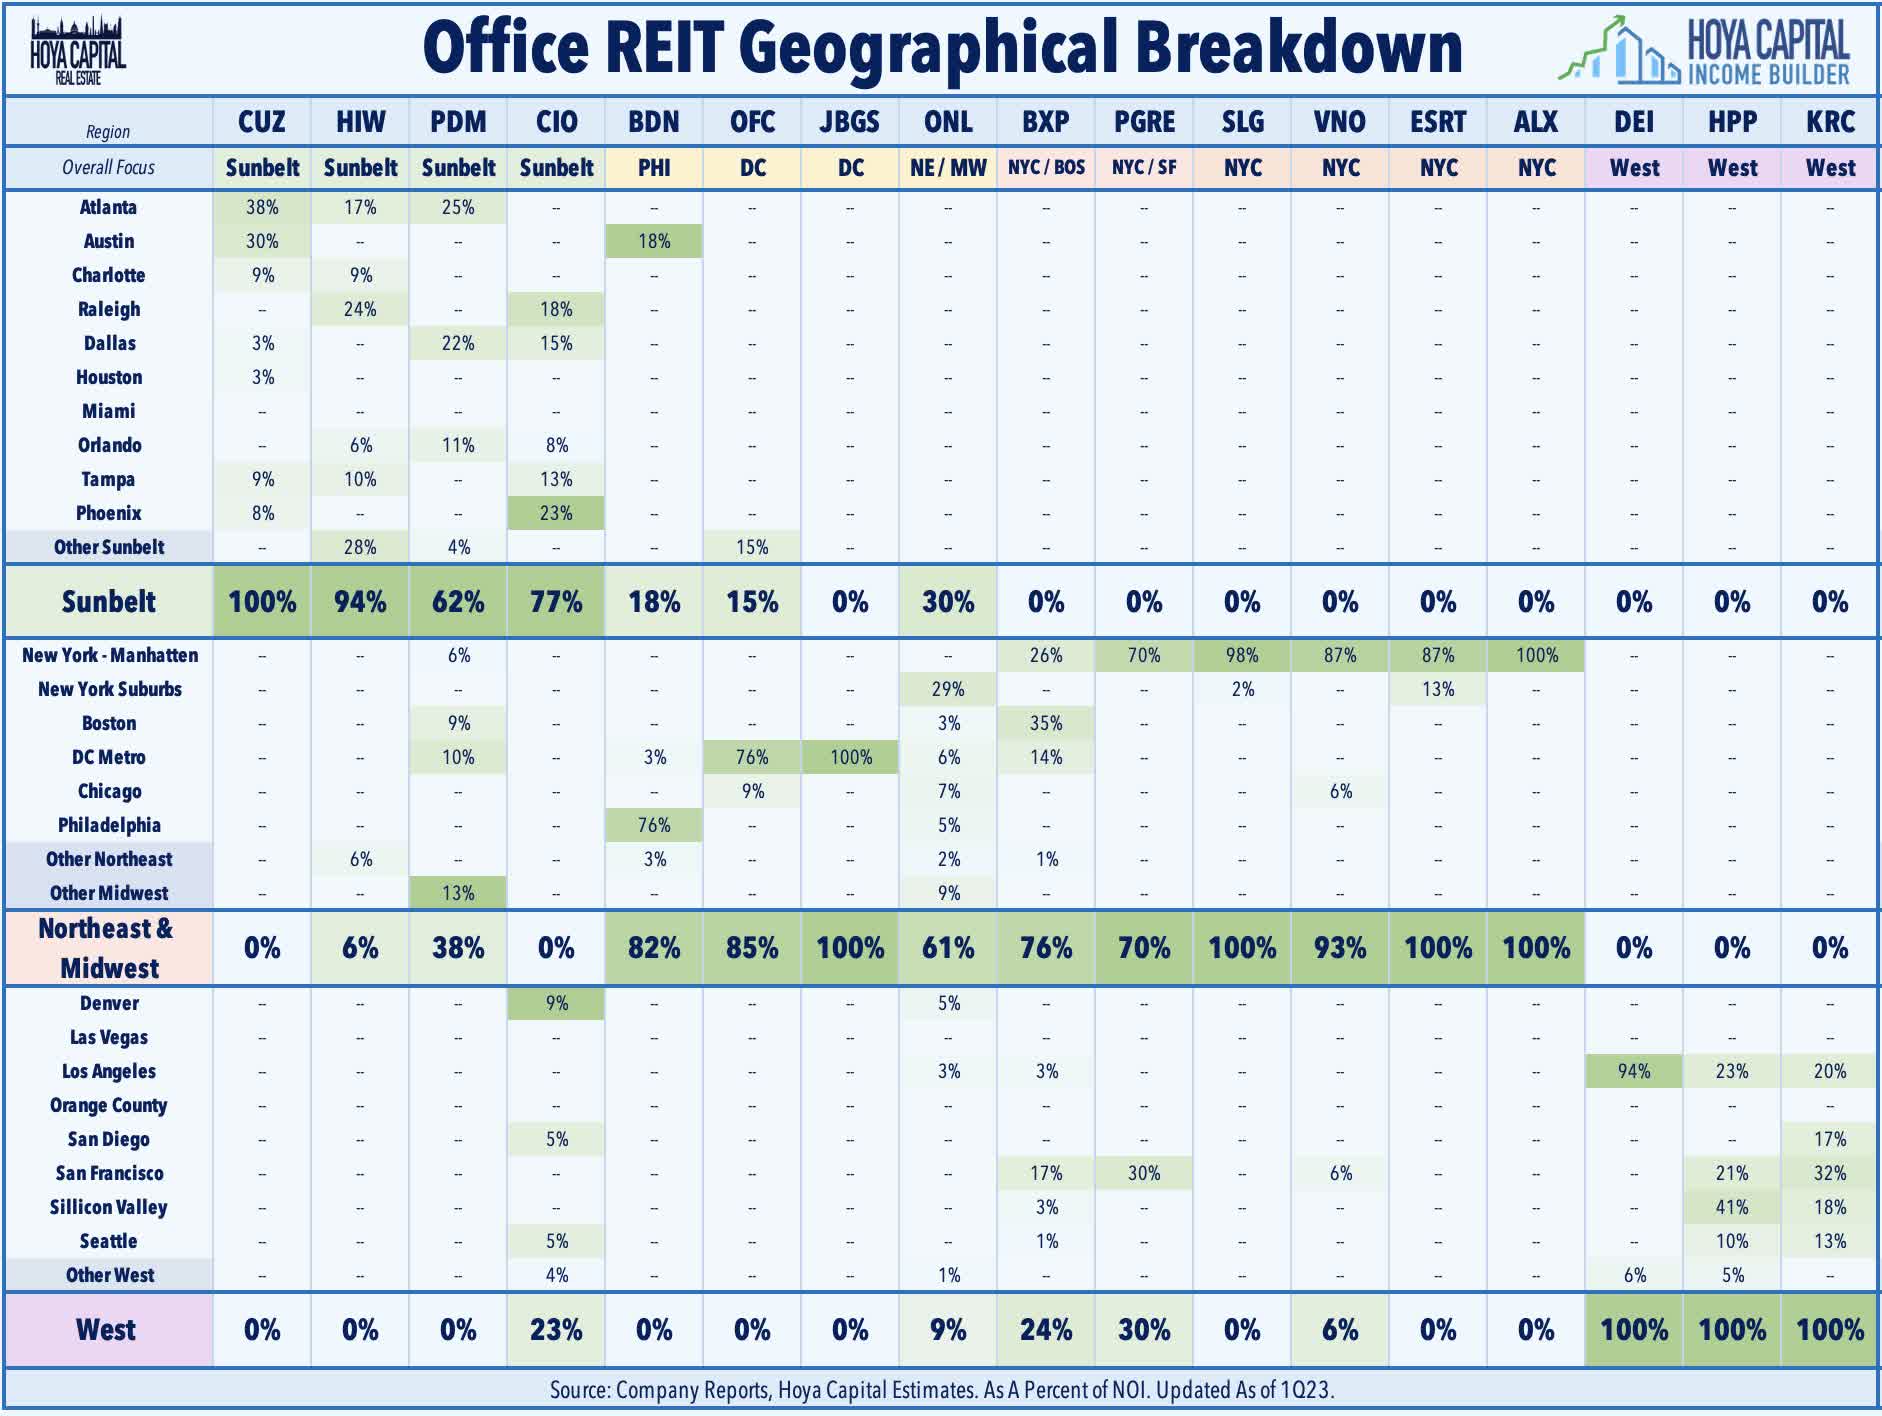
The office sector is typically segmented into two categories. Urban CBD ("Central Business District") or ' Gateway' REITs hold portfolios that are concentrated in the six largest U.S. cities: New York City, Chicago, Boston, Los Angeles, San Francisco, and Washington, D.C., a segment that has been hit especially hard by the pandemic. Secondary/ Suburban REITs , which have generally outperformed throughout the pandemic, hold portfolios concentrated in the Sunbelt regions and/or in secondary markets. As we'll discuss throughout this report, we believe that the longer-term outlook remains far "sunnier" in the Sunbelt and in secondary markets with net population growth, shorter commute times, and a more favorable industry mix.
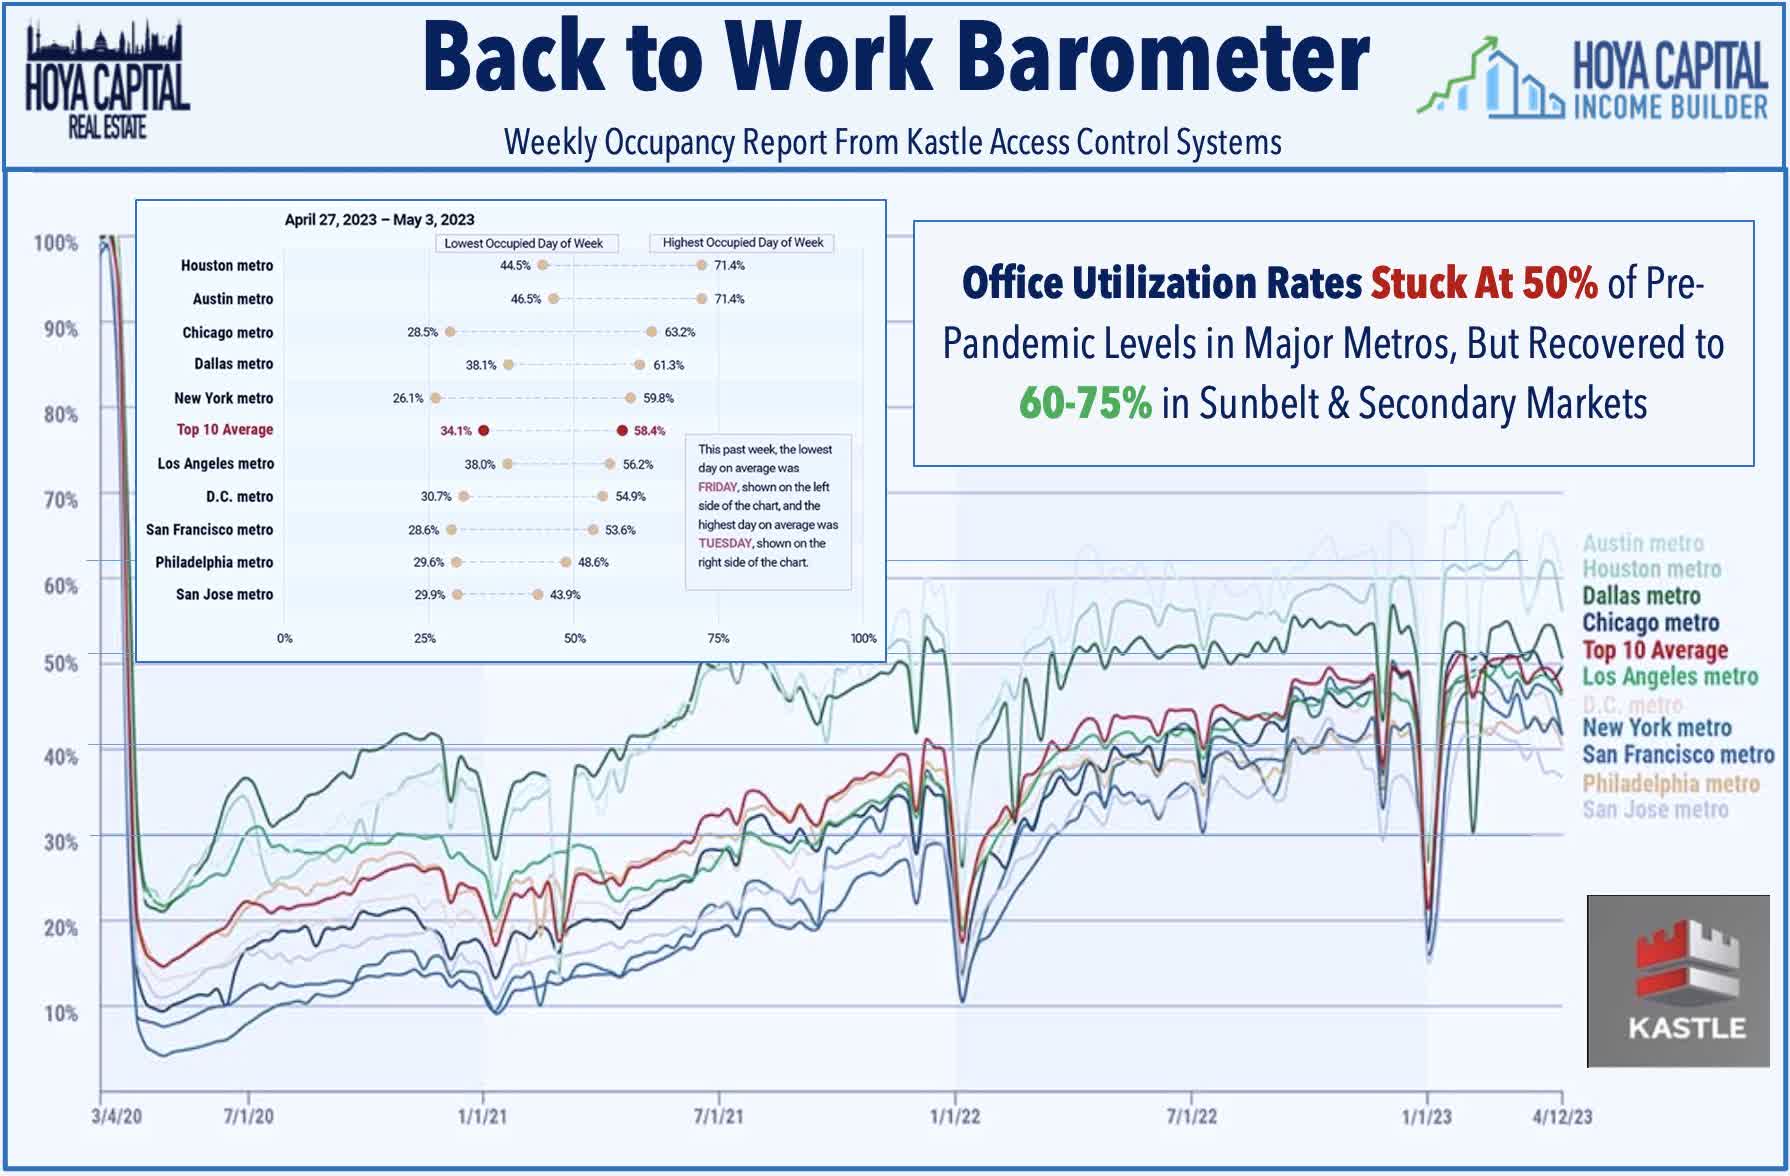
Since early in the pandemic, we've held the view that the Work-From-Home era is truly a "new normal" - a catalyst that accelerated a pre-destined trend of lower office utilization rates - and that the return to the office would be particularly slow in cities with longer average commute times and heavier reliance on public transit. Consistent with that expectation, utilization rates have recovered only a fraction of pre-COVID levels in dense coastal markets with longer and more transit-heavy commutes. According to recent data from Kastle Systems, office utilization have hovered around 50% nationally since January. While utilization rates remained at 50% or below in all of the major coastal urban markets, Sunbelt and secondary markets have seen materially higher utilization rates throughout the pandemic with Austin and Houston seeing mid-week occupancy rates around 70% or above.
Based on recent survey data discussed in more detail below, we believe the ultimate post-pandemic "trend level" of utilization rates is around 60% of pre-pandemic levels in primary urban metros - up from roughly 45% today, implying a 3-day/week average in-person attendance. In secondary markets where the economic benefits of in-office attendance are more likely to outweigh the costs, utilization rates will be closer to 80% - up from roughly 60% today, implying a 4-day average workweek. We believe that this final 20% of upside utilization will be unlocked as labor markets finally begin to materially loosen, and we have indeed seen more companies use office "mandates" as part of their workforce reduction strategies, including recent examples from BlackRock ( BLK ), Disney ( DIS ), and Google ( GOOG ).
Just How Bad Is It Really?
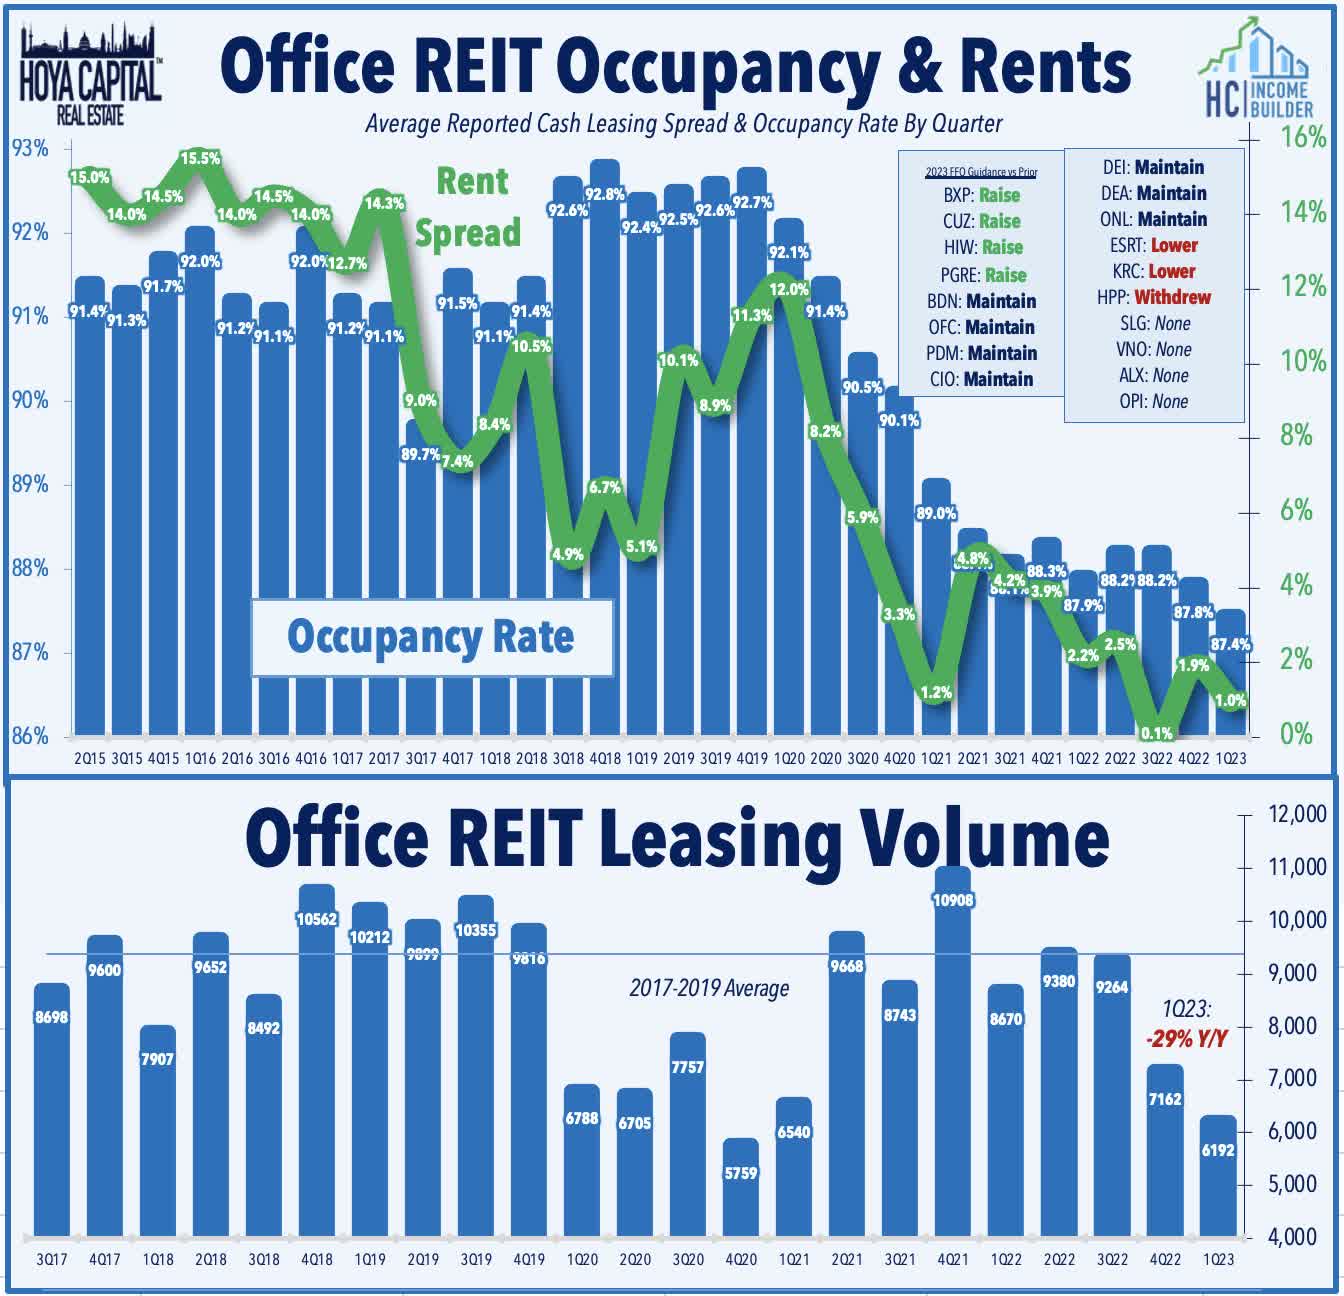
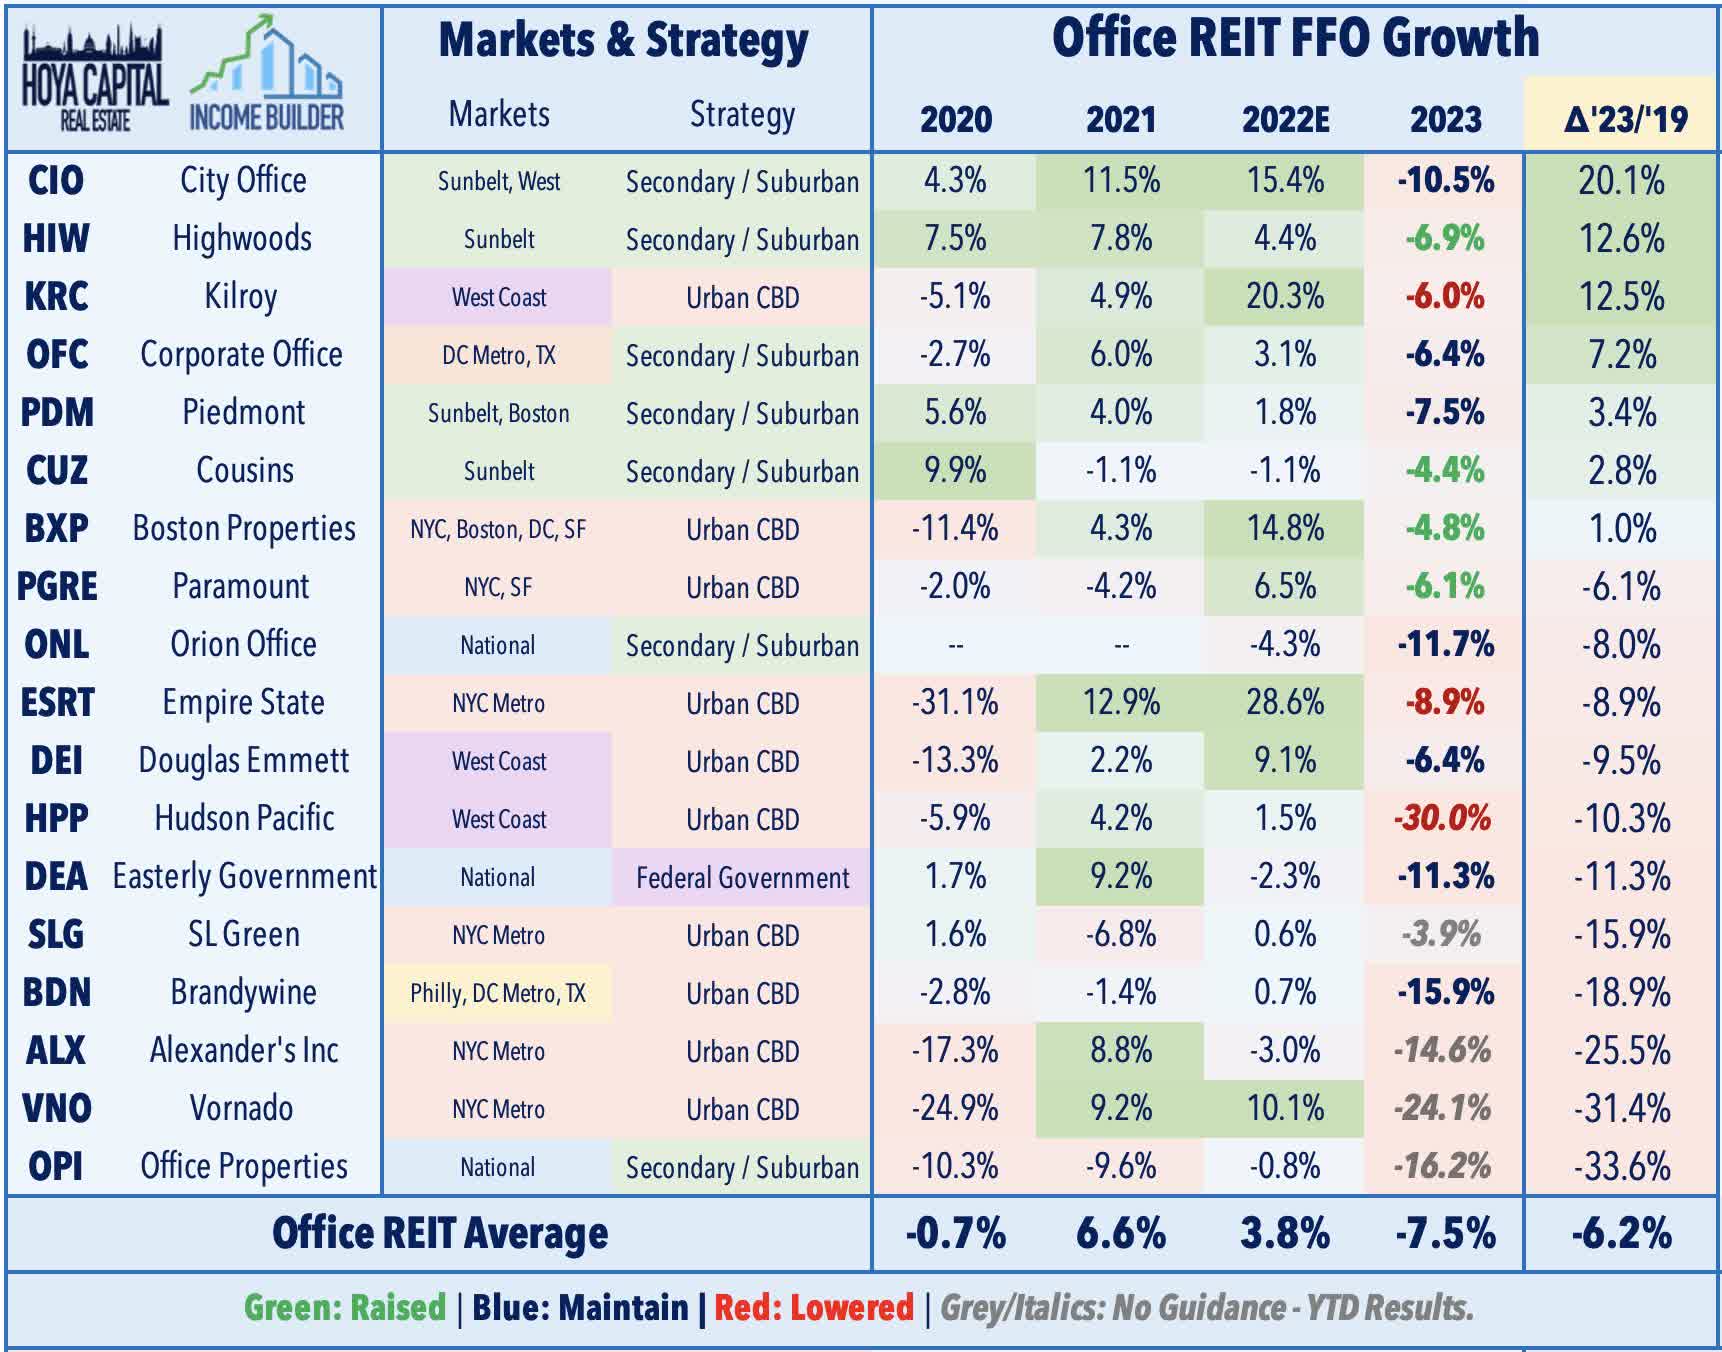
Nationally, property-level cash flows and occupancy rates are still only about 5% below pre-pandemic levels - albeit on a clear downward trajectory - while asking rents have continued to hover around all-time highs nationally. Office REIT Funds From Operations ("FFO") in 2022 was actually 4% above 2019-levels, on average, while same-store Net Operating Income ("NOI") was about 5% above pre-pandemic levels - each being around "middle of the pack" for the REIT sector. Ignoring the future outlook for a moment, these are far from crisis-level fundamentals. Four office REITs actually raised their full-year FFO outlook this past quarter - including the two major Sunbelt-focused REITs.
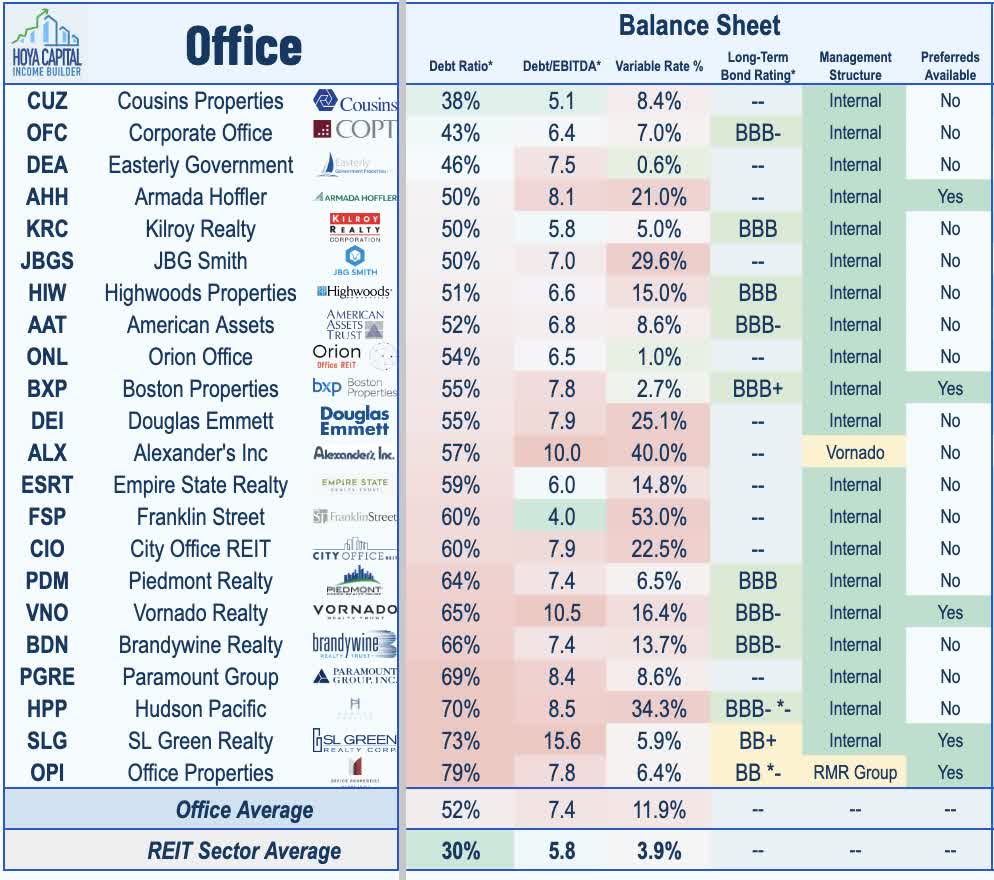
Debt service expenses have been the primary culprit behind the wave of recent loan defaults from private equity firms such as Brookfield, Blackstone, Pimco, and RXR. These private equity owners typically operate with loan-to-values in the 60-70% range and have witnessed their equity in office assets effectively diminish due to the approximately 25% decline in appraised office valuations. Faced with interest expenses three times higher than a year ago, these owners have chosen to return the keys to the bank. Despite operating with generally more conservative debt levels, office REITs have experienced all the pain of private markets and then some. As we saw with mall REITs in the late 2010s, depressed equity valuations can fuel a negative feedback loop, underscored by the surge in Debt Ratios (as measured by Debt/Enterprise Value) from around 35% in 2021 to over 50% currently.
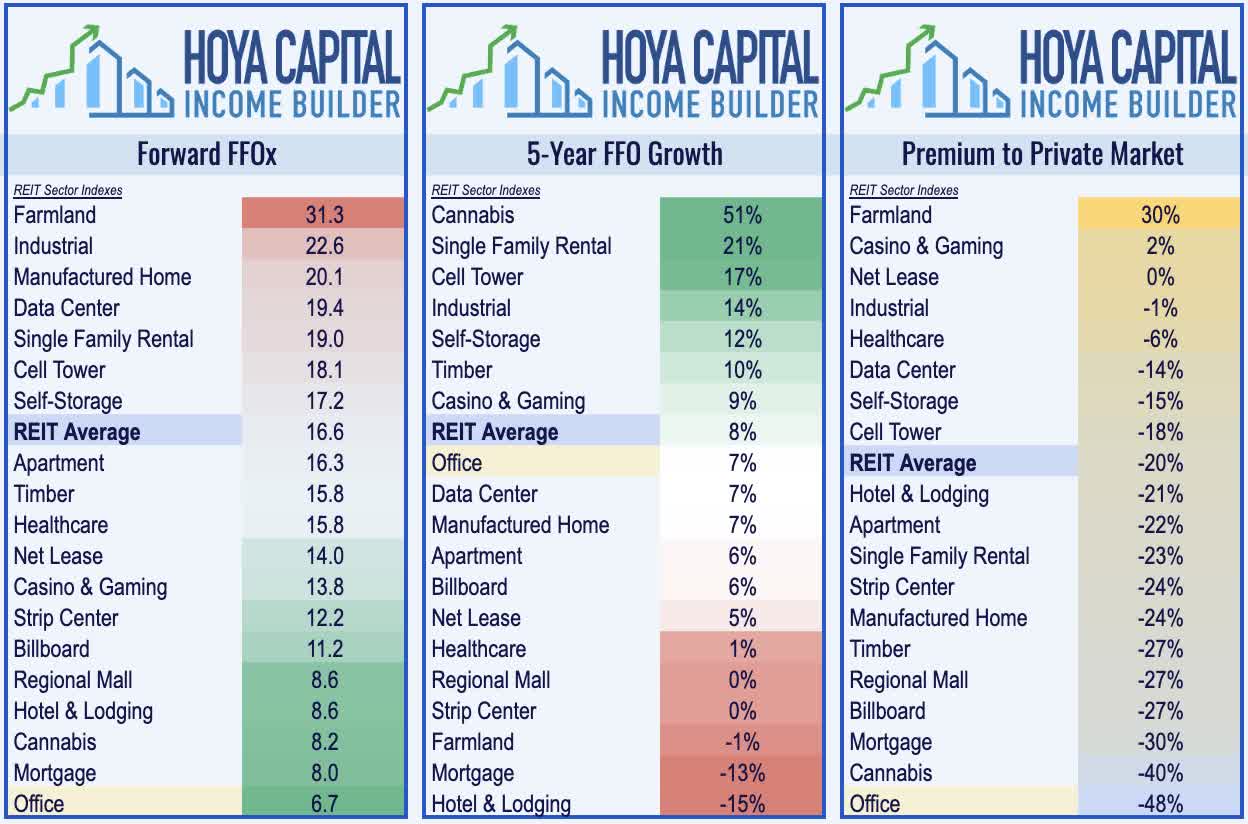
Even when considering the most pessimistic private market appraisals, however, office REITs trade at steep discounts to their implied Net Asset Value, with discounts ranging from roughly 30% to 40%, alongside mid-single-digit Price-to-FFO metrics. Much like the e-commerce impact on malls, work-from-home ("WFH") trends are likely to result in a half-decade or more of lingering oversupply of available space. But as we've seen with some renewed strength displayed by retail REITs in recent years, supply/demand conditions do eventually normalize as properties get repurposed or outright abandoned.
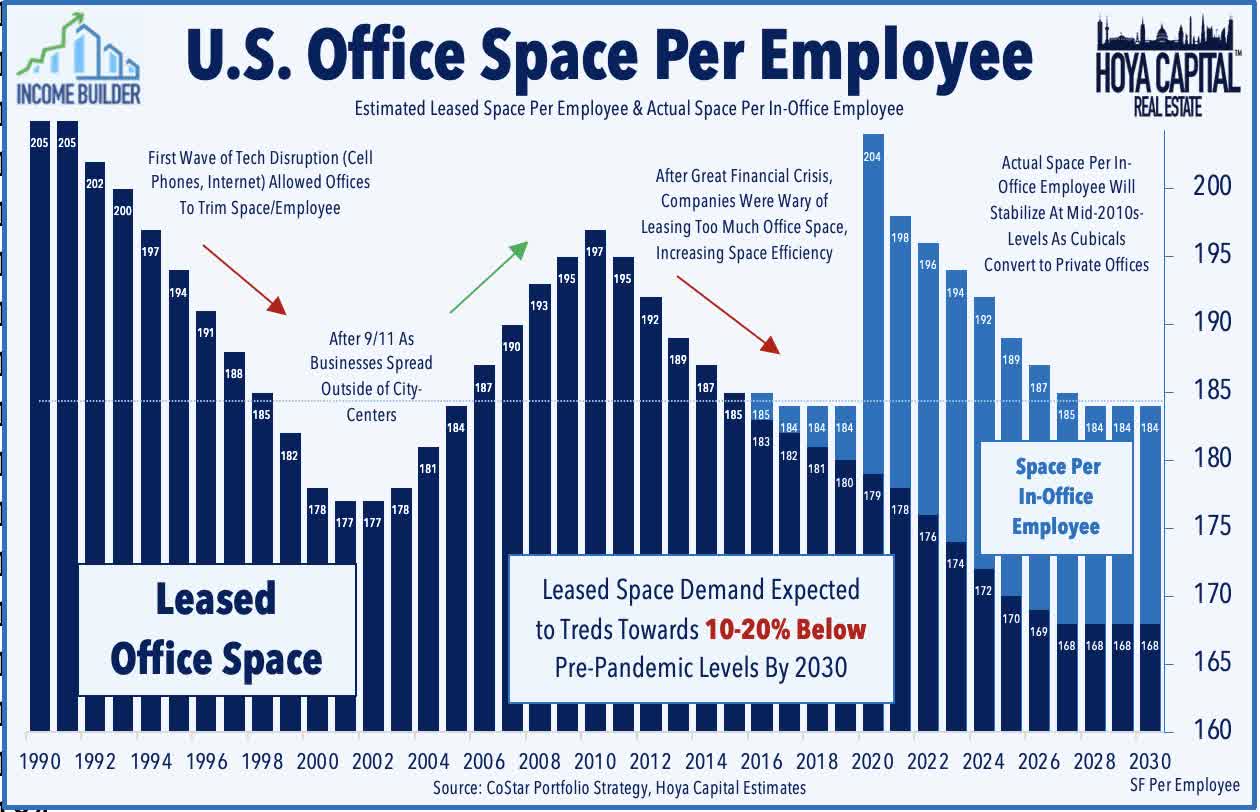
We believe that employers will seek to trim only about half of this incremental "unused" space in their next renewals, implying about a 15-25% reduction in "same company" demand in primary urban metros and 5-10% in secondary markets - which is likely quite a bit more optimistic for office demand than implied by office REIT valuations, which appear to imply cuts that match the lower utilization rates on a 1-for-1 basis. What's overlooked is that we're not too far removed from the GFC period which saw substantial cuts in excess office square footage from 2008-2011 and a decade-long trend towards a higher office "utilization factor"- in other words, jamming more employees into the same square footage with the often-loathed open floor plans. There simply wasn't a huge glut of under-utilized office space before the pandemic, and we believe that employers will be content with some modest space reductions while offering more space per in-office employee through build-outs that include more private office space and fewer open floors and cubicles.
A Review of Office Fundamentals
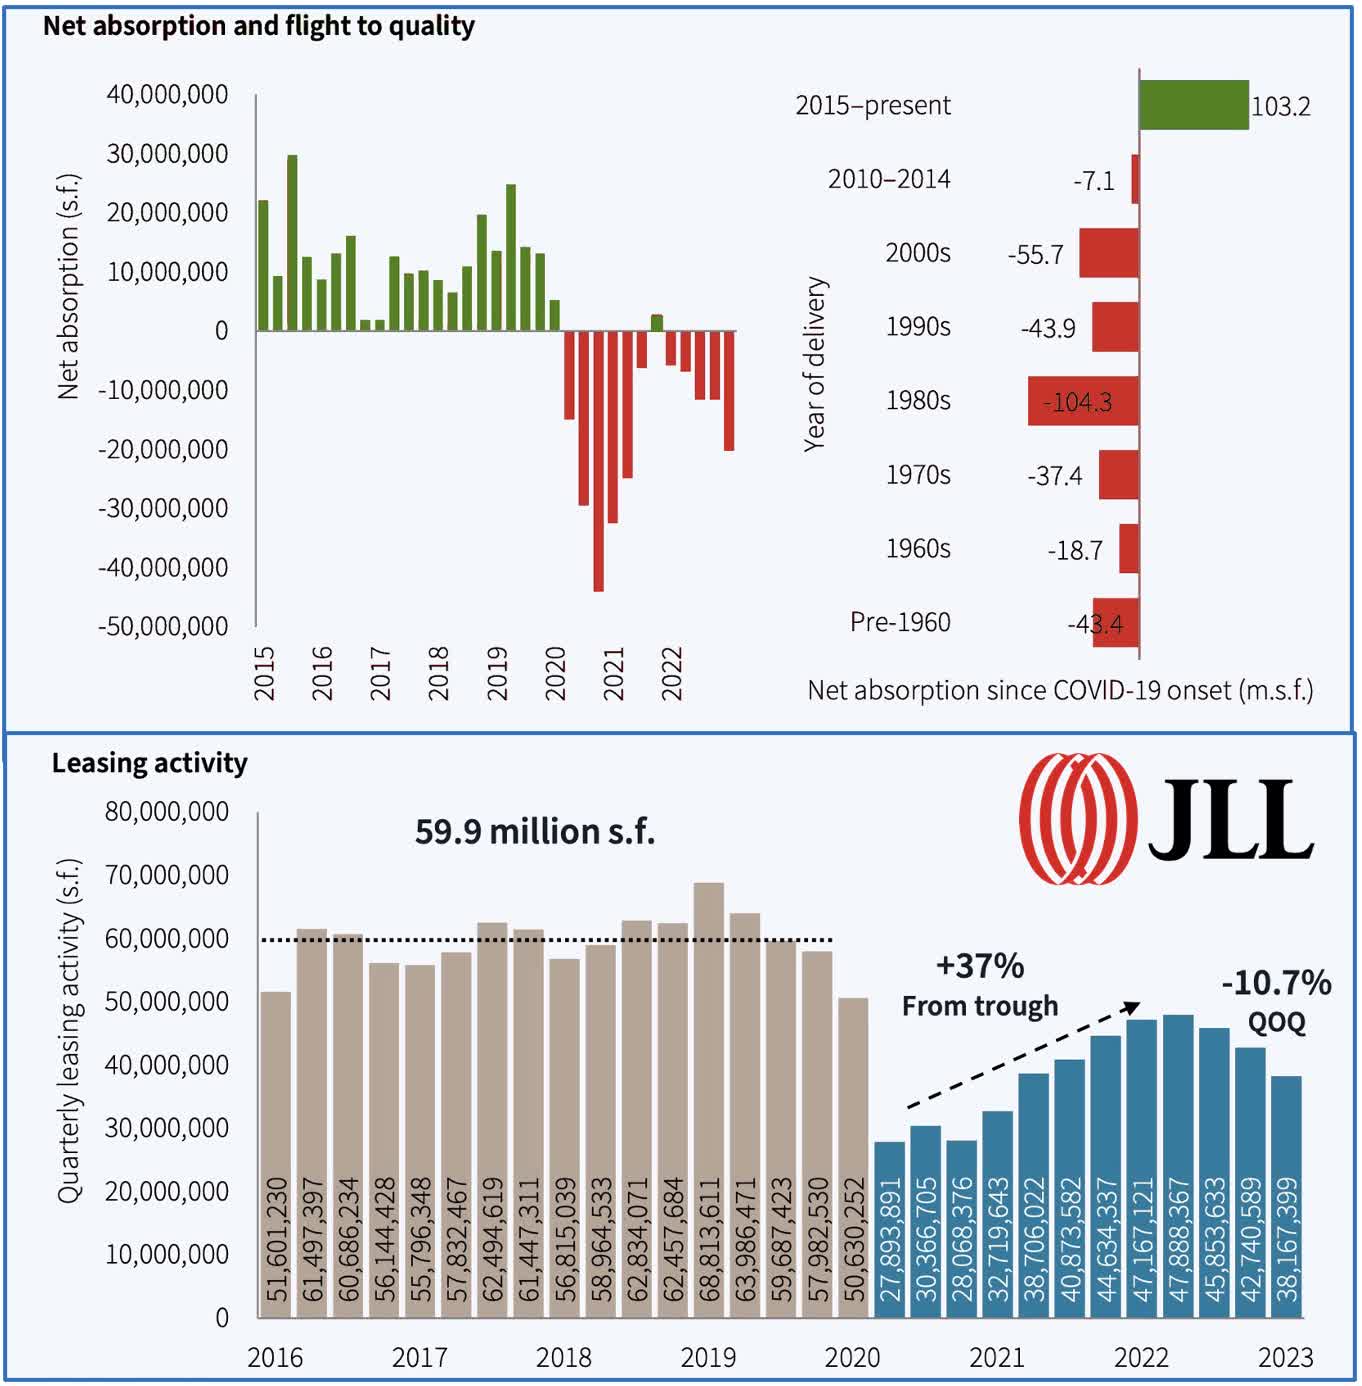
Corporate decision-makers have, so far, been hesitant to make major strategic decisions to dramatically reduce their office footprints but have been leveraging softening market conditions to extract generous concessions. JLL (JLL) Research noted in their recent Office Report that national office leasing activity is actually higher by 2% on a trailing twelve-month basis - bolstered by strong activity in early 2022 - but has slowed more materially in recent quarters, which JLL attributes to three factors: corrections among key growth industries, delaying of large-scale lease activity, and reduced workforce growth. The recently quarterly US Office Marketbeat noted several bright spots, seeing strong demand in life sciences markets, in large Sunbelt markets with strong job growth and appeal for growing tech firms, and in recovering secondary markets in the Northeast - notably Fairfield County.
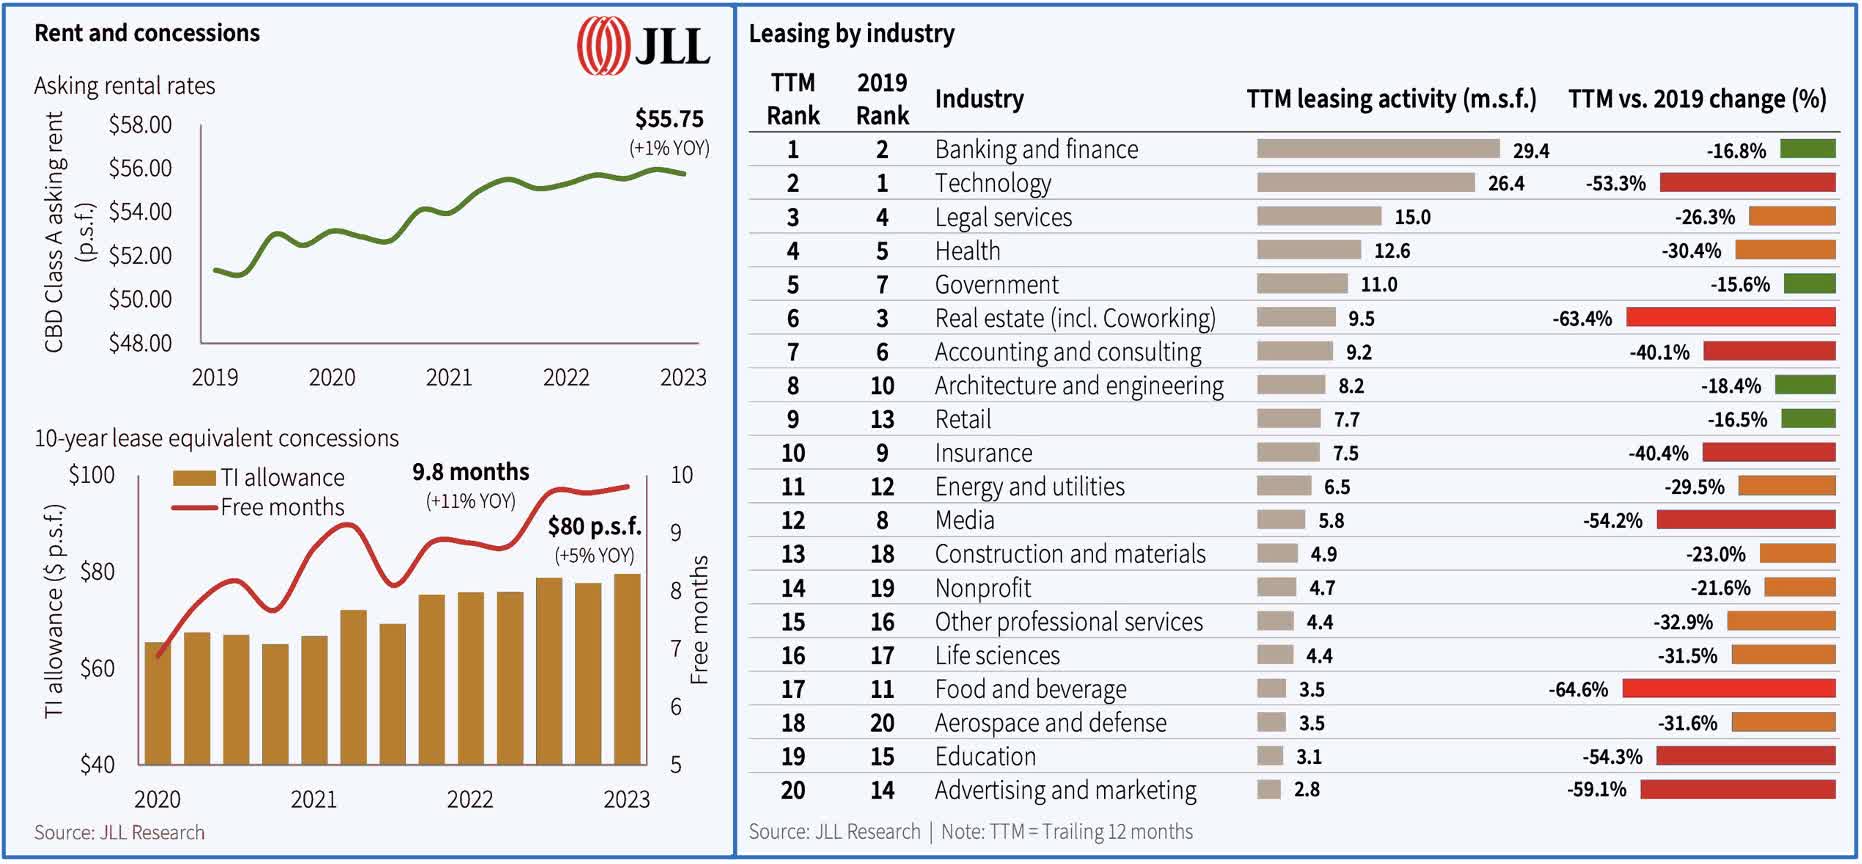
There were also mixed signs on the pricing front, with JLL noting that "the relative scarcity of high-quality space enabled landlords to preserve face rental rates" with asking rents rising 0.3% to $38.96/sf, but the increase was "offset by concession packages that eclipsed all-time highs." At the national level, JLL reports that while asking rents are roughly flat since the start of the pandemic, effective market rents have declined by 6.2% as concessions continue to be on the rise. Term-adjusted rent abatement periods have grown 2.5% since the end of 2021 and 26.8 percent since the outset of the pandemic, while tenant improvement allowances have grown by 10% in the last year and 18.8% over the past three years. Space availability in sublet markets also continued to swell - rising to a record 142.2 million s.f. at the end of Q1. JLL's data also reveals substantial dispersion in industry-level leasing activity. Notably, banking and finance leasing activity - a key industry segment in the NYC office market - was only 17% below pre-pandemic levels over the last twelve months while technology and media leasing activity - key industries for West Coast markets - have plunged by more than 50%.
These trends have been consistent with office REIT earnings results over the past several quarters, which have been defined by
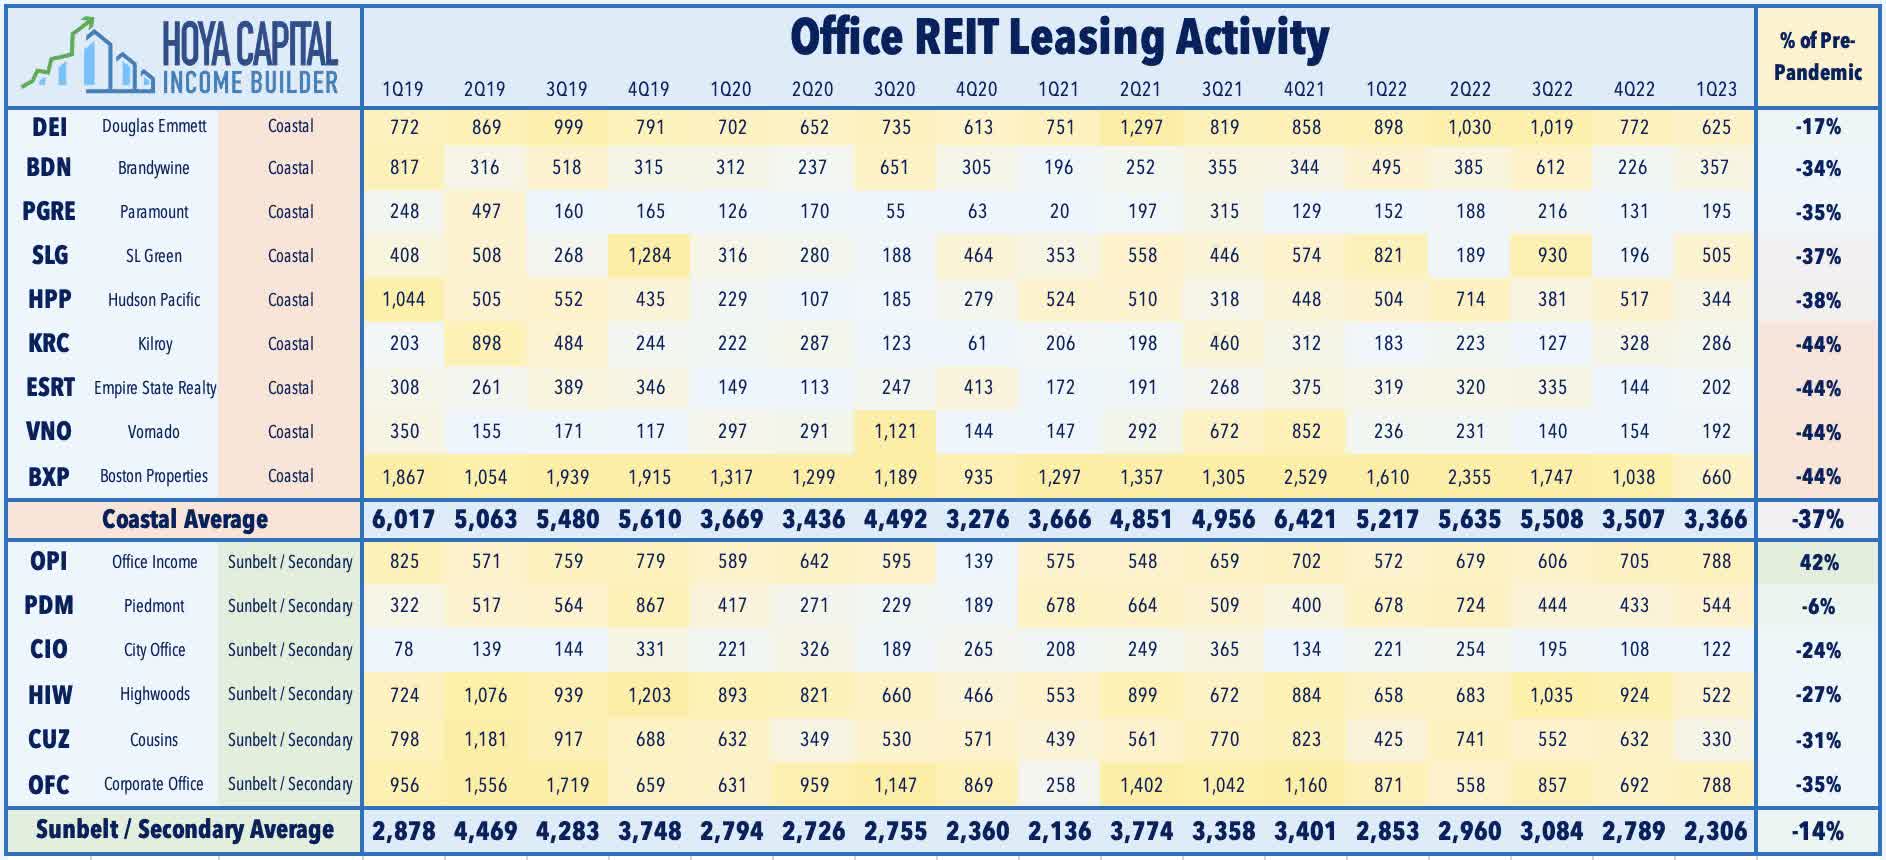
significant outperformance from Sunbelt and secondary-market-focused REITs and coastal REITs with significant specialty lab space assets. Sunbelt-focused REITs were once again the clear source of relative strength within the sector in Q1, underscored by the guidance increases from the pair of leading Sunbelt office REITs - Cousins (CUZ) and Highwoods (HIW) - which reported leasing volumes that were only about 20% below pre-pandemic levels. Two NYC-focused REITs raised their full-year FFO outlook: Paramount Group (PGRE) and Boston Properties (BXP). Among the thirteen office REITs that provide guidance, four topped their prior FFO outlook, while a pair of REITs missed their prior forecast - Empire State Realty (ESRT) and West Coast-focused Kilroy (KRC). The weakness was particularly acute in the San Francisco and Los Angeles markets - a focus of office REIT Hudson Pacific (HPP) - which withdrew its full-year outlook, and reported particularly weak leasing activity and rent spreads.
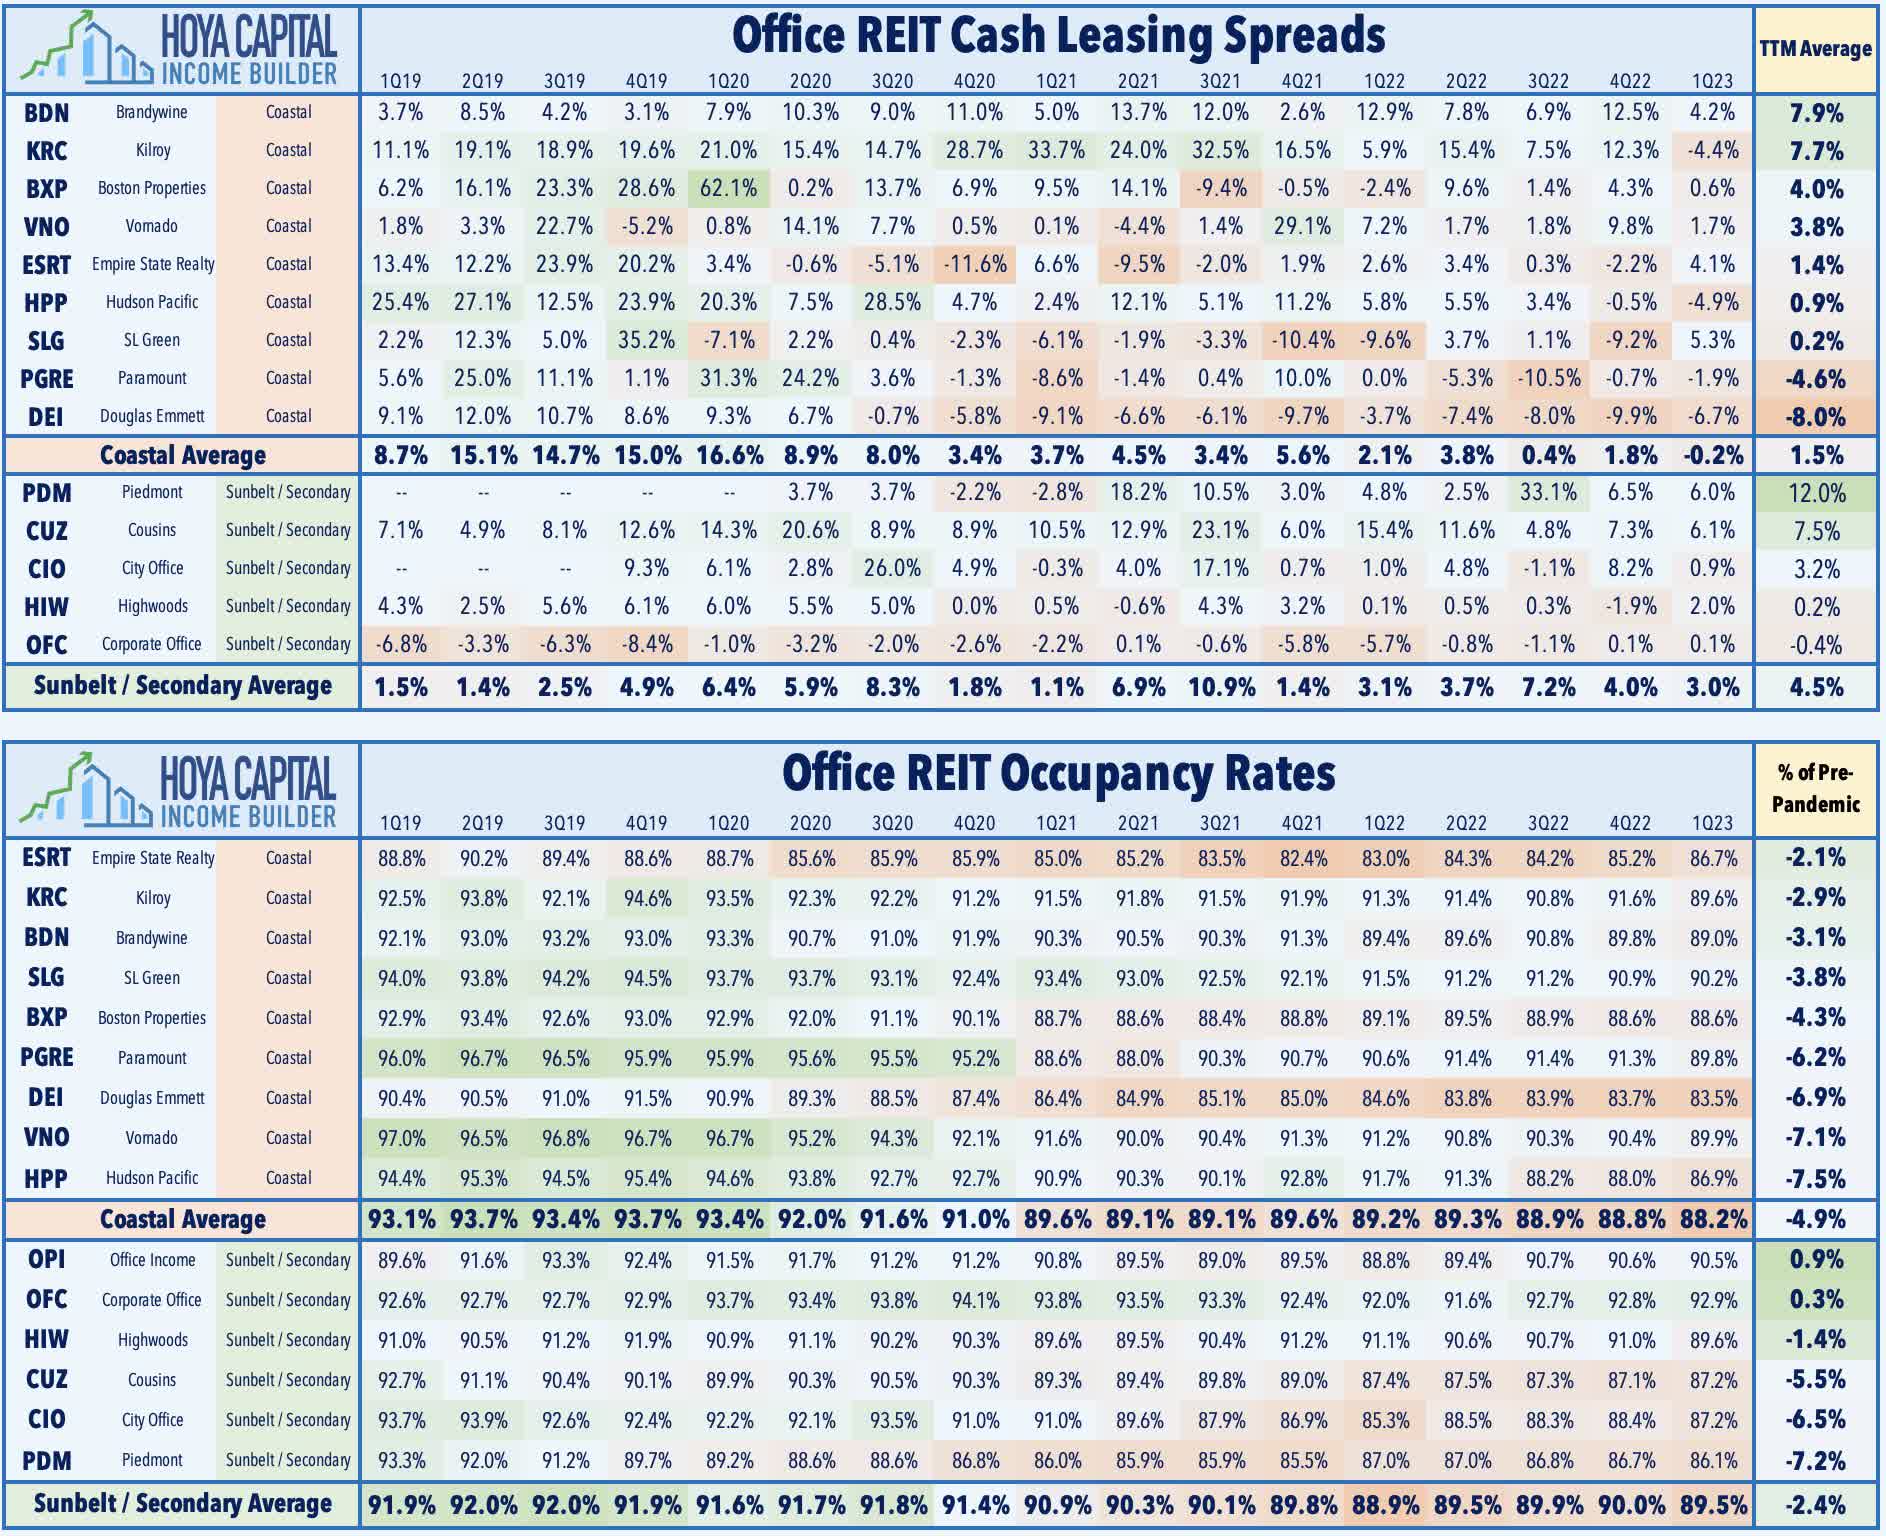
For REITs, the average occupancy rate has trended down to 87.4% in Q1 - down from the 92.7% occupancy rate in the final quarter before the pandemic. At the regional level, Coastal-focused REITs reported average occupancy rates of 88.2% - roughly 5% below pre-pandemic levels - while Sunbelt/Secondary REITs reported a more muted 2.5% relative decline in occupancy. Asking rent spreads exhibited similar region-specific trends. Coastal-focused REITs reported rent spreads of -0.2%, while Sunbelt/Secondary REITs reported a 3.0% increase in rent spreads, on average. Piedmont (PDM) and Cousins (CUZ) were notable upside standouts on the pricing front - each reporting spreads of 6% - while Douglas Emmett (DEI) was a notable laggard, reporting -6.7% rent spreads, its eleventh-straight negative print.
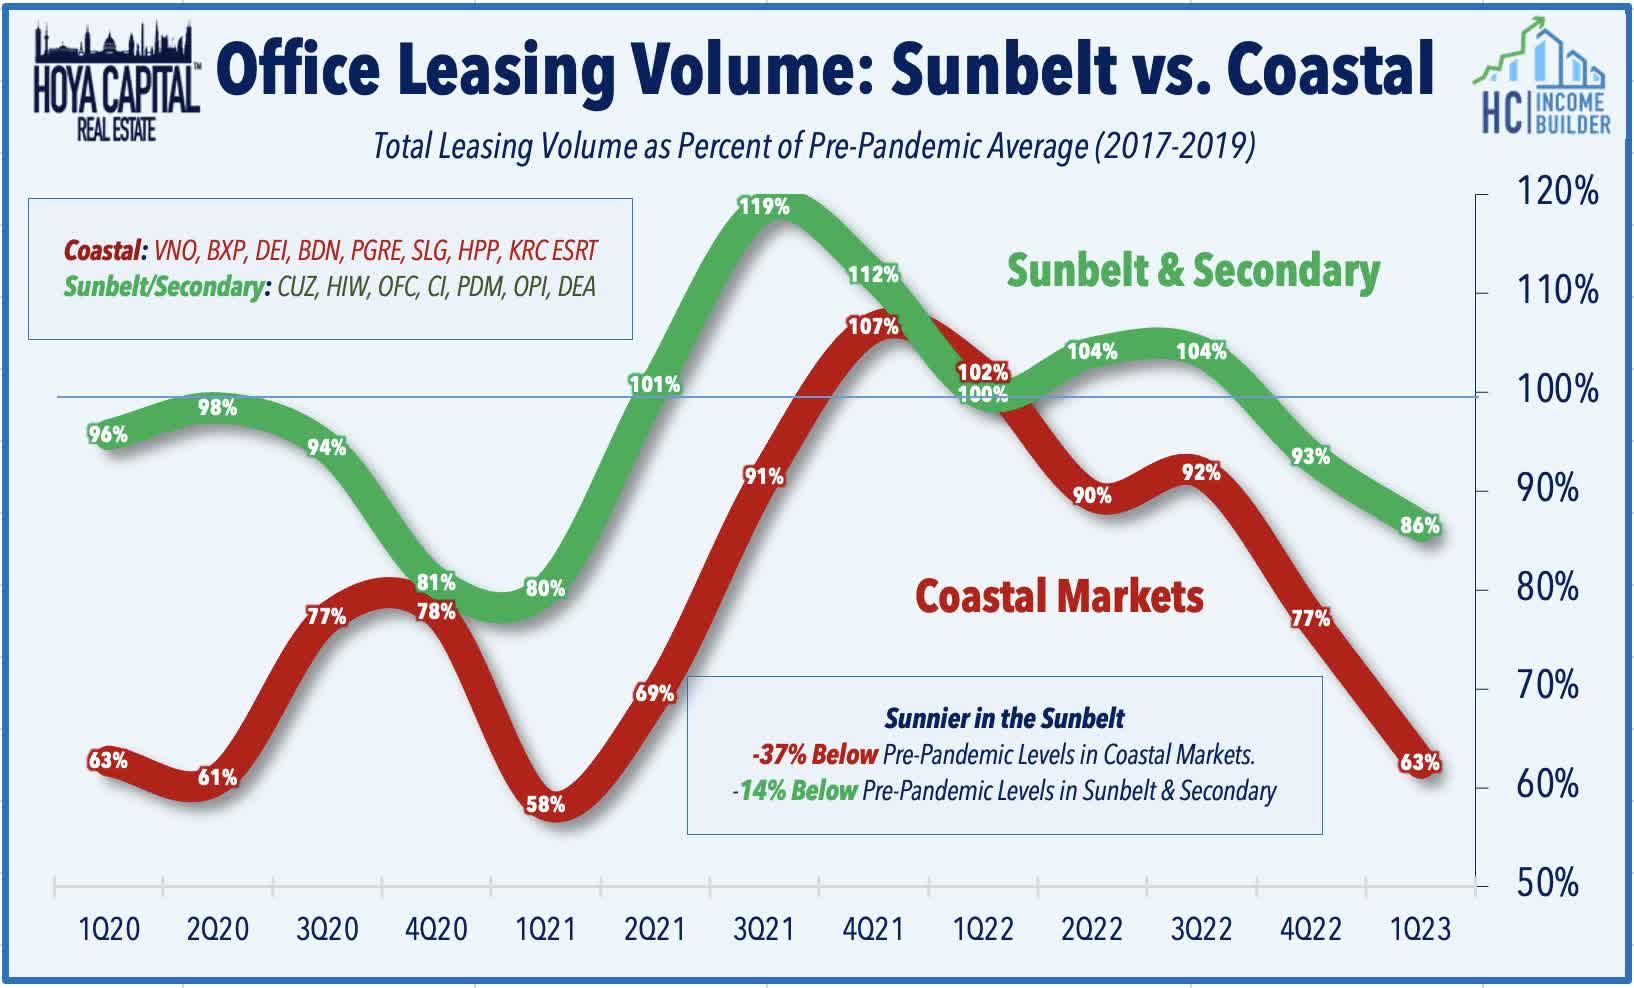
The Sunbelt versus Coastal divergence was even more notable in office leasing activity. Overall office leasing activity was lower by 29% from a year earlier and 38% below pre-pandemic 2019-levels. Sunbelt-focused REITs, however, reported leasing activity that was only 14% below 2019 levels over the past two quarters compared to the 37% average decline for coastal-focused REITs. Notably, laggards on the leasing front included Vornado (VNO) - which reported a 44% decline in activity compared to its pre-pandemic level. VNO has also been in the spotlight after announcing that it will suspend its common stock dividends until the end of 2023 - one of four office REITs to reduce its dividend this earnings season.
Where Will Utilization Rates Stabilize?
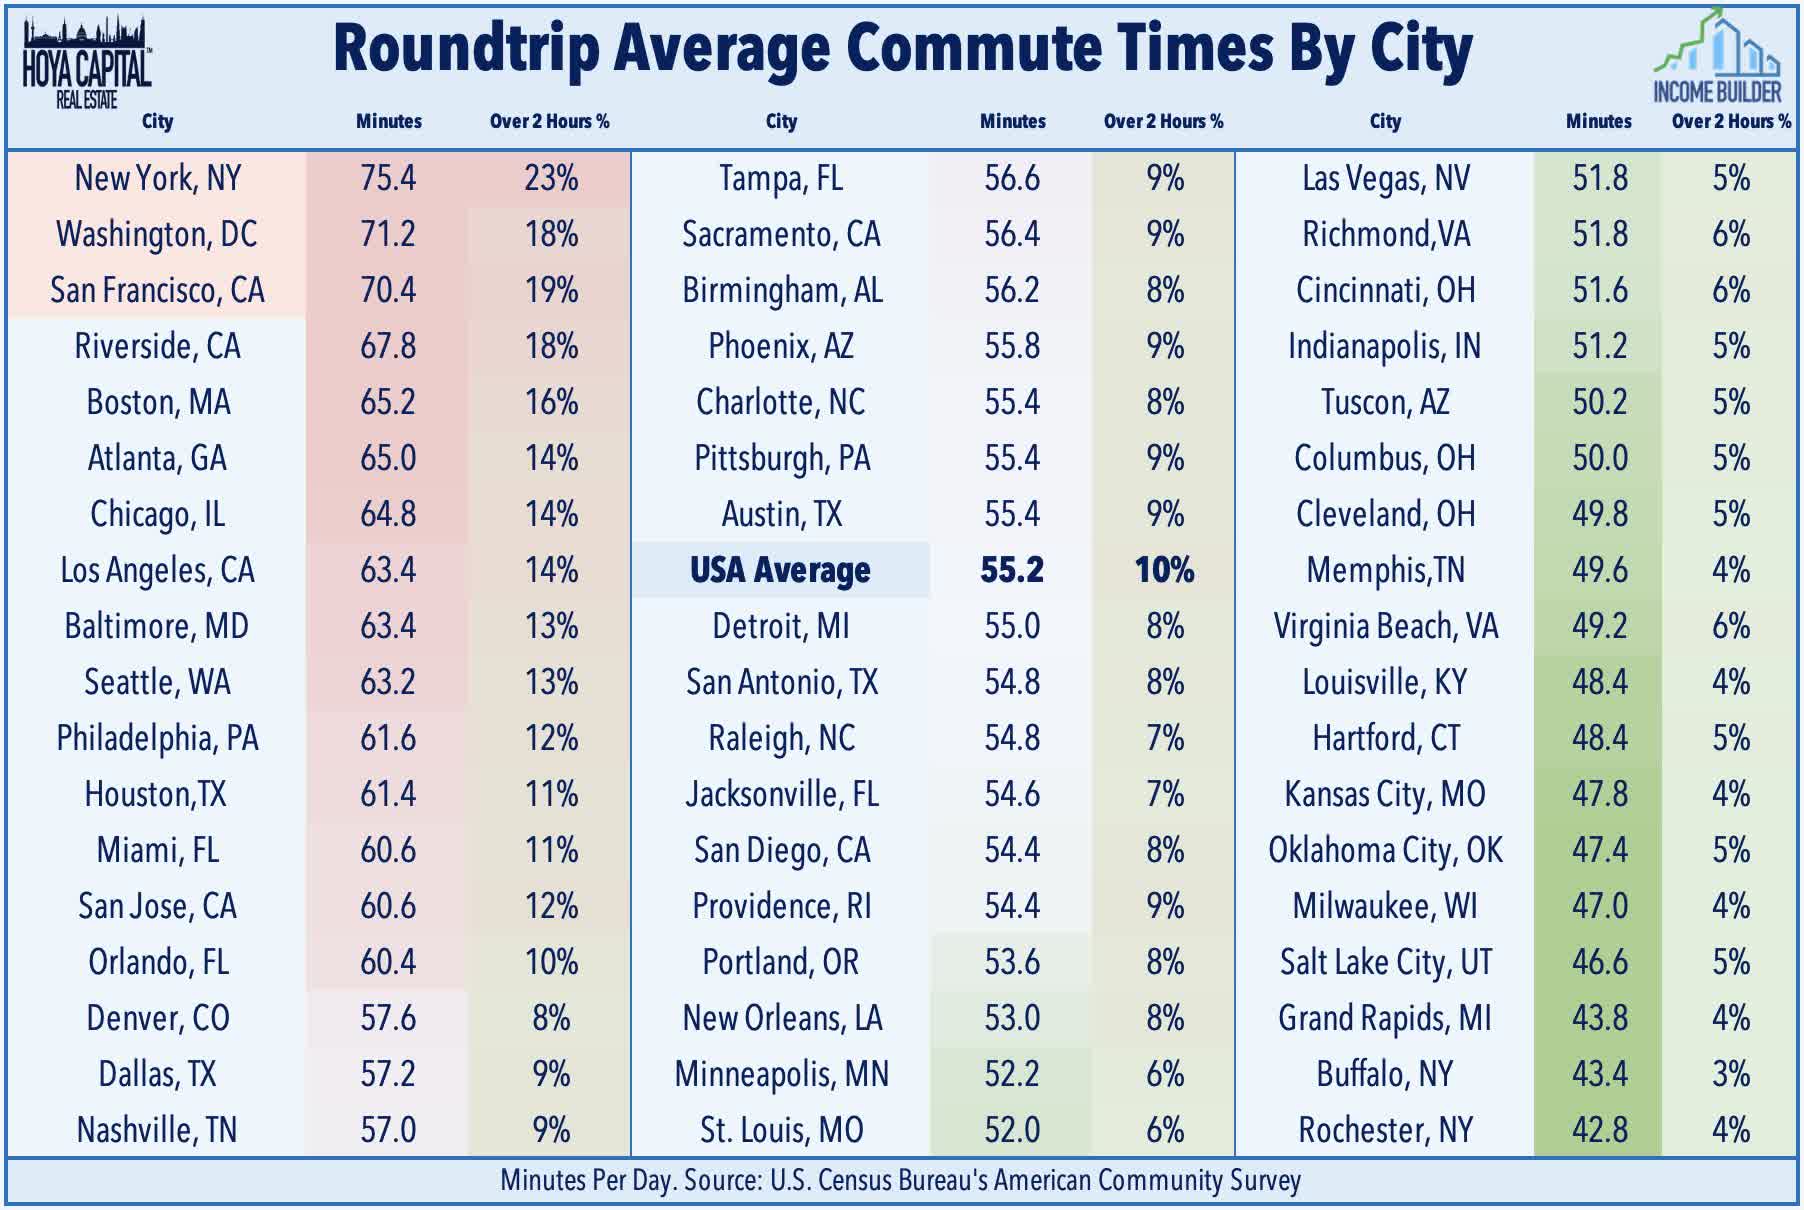
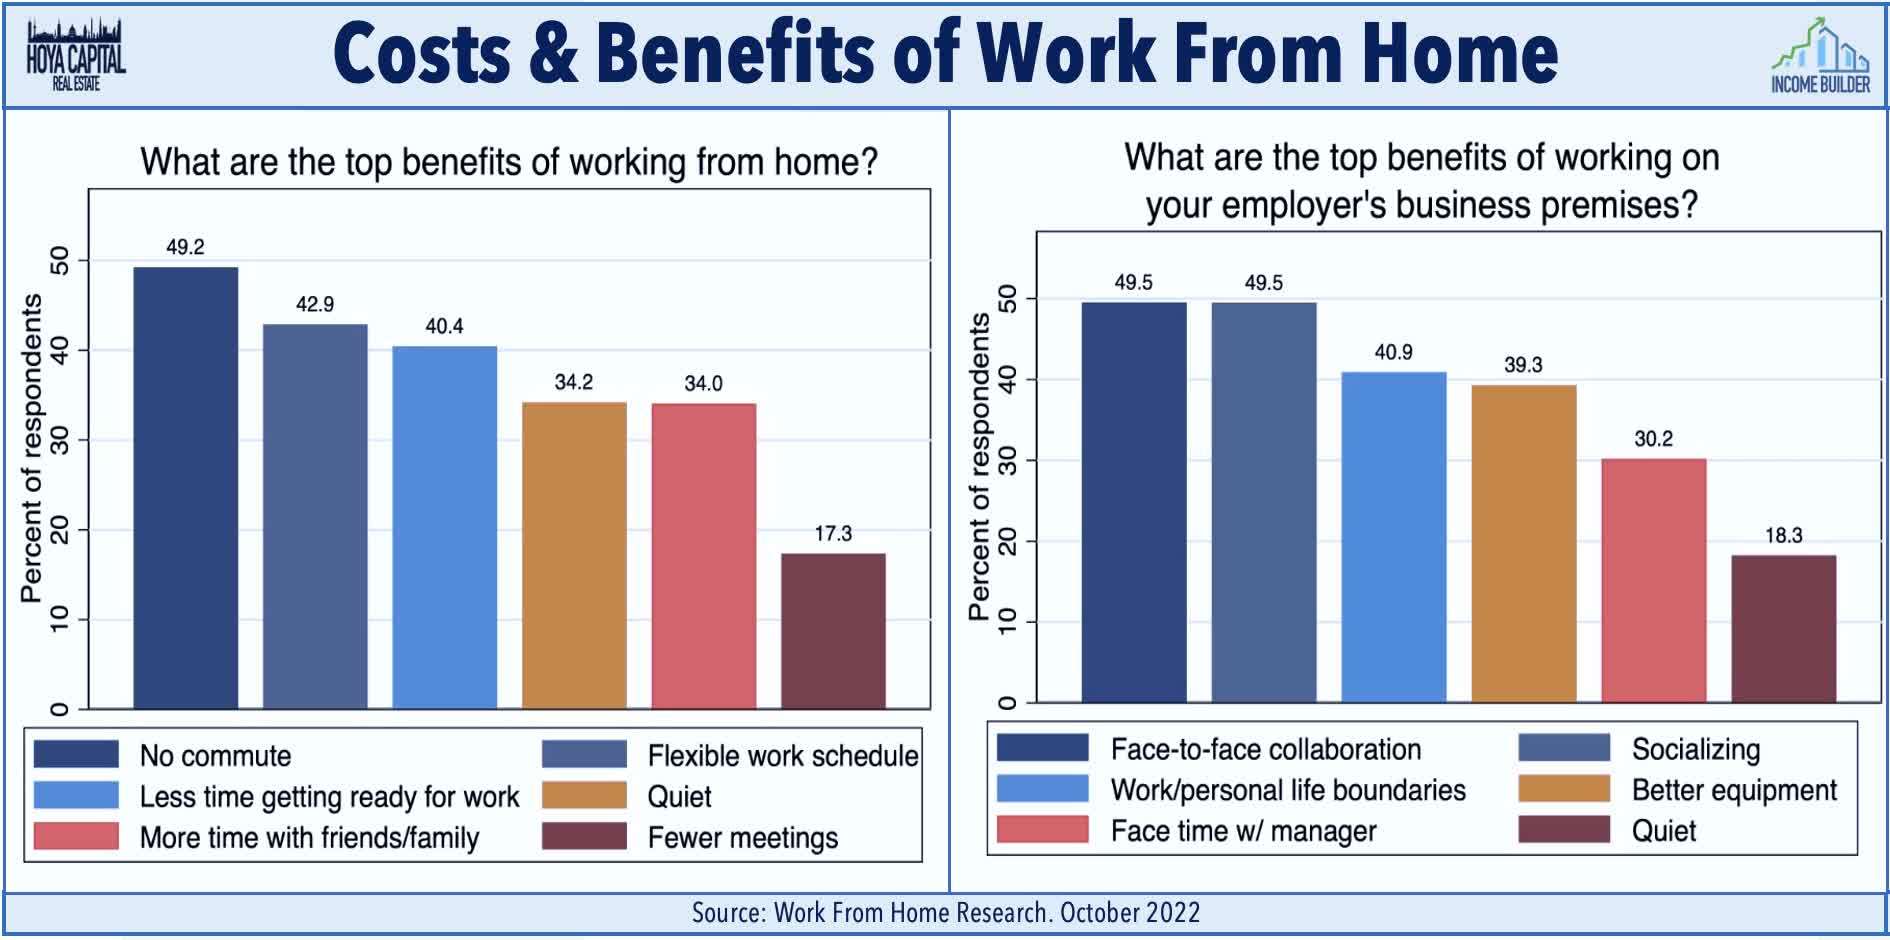
Recently-updated data from the American Community Survey show that over the course of a 5-day work week, remote work employees in cities with particularly brutal commutes "save" an average of 6.5 hours per week and a hundred dollars in transportation costs. Recent surveys from WFH Research confirmed that the lack of a commute is far and away the top benefit of working from home. The survey found that WFH saved office workers an average of 70 minutes per day, of which 40% was reallocated toward work. That "bonus" time allocated towards work seems to explain all of the reported productivity gains of WFH found across most surveys - offsetting the drag from a generally less productive home environment compared to the office.
Importantly, survey data continues to show that the office isn't necessarily the problem - it's the commute - and there's a growing consensus that there are quantifiable "costs" of remote work which can accumulate over time if not at least augmented by some non-virtual between employees and clients. A recent Hogan survey noted that employees cited challenges with collaboration (36%), distractions at home (25%), and difficulty with motivation (16%) as the top challenges of the fully-remote environment and a consistently small share of employees want to do away with the office entirely - averaging 10-20% across most surveys - with younger people itching to get back to the office at rates nearly twice that of older cohorts. A recent survey from KPMG found that less than one in five workers would prefer to be fully remote.
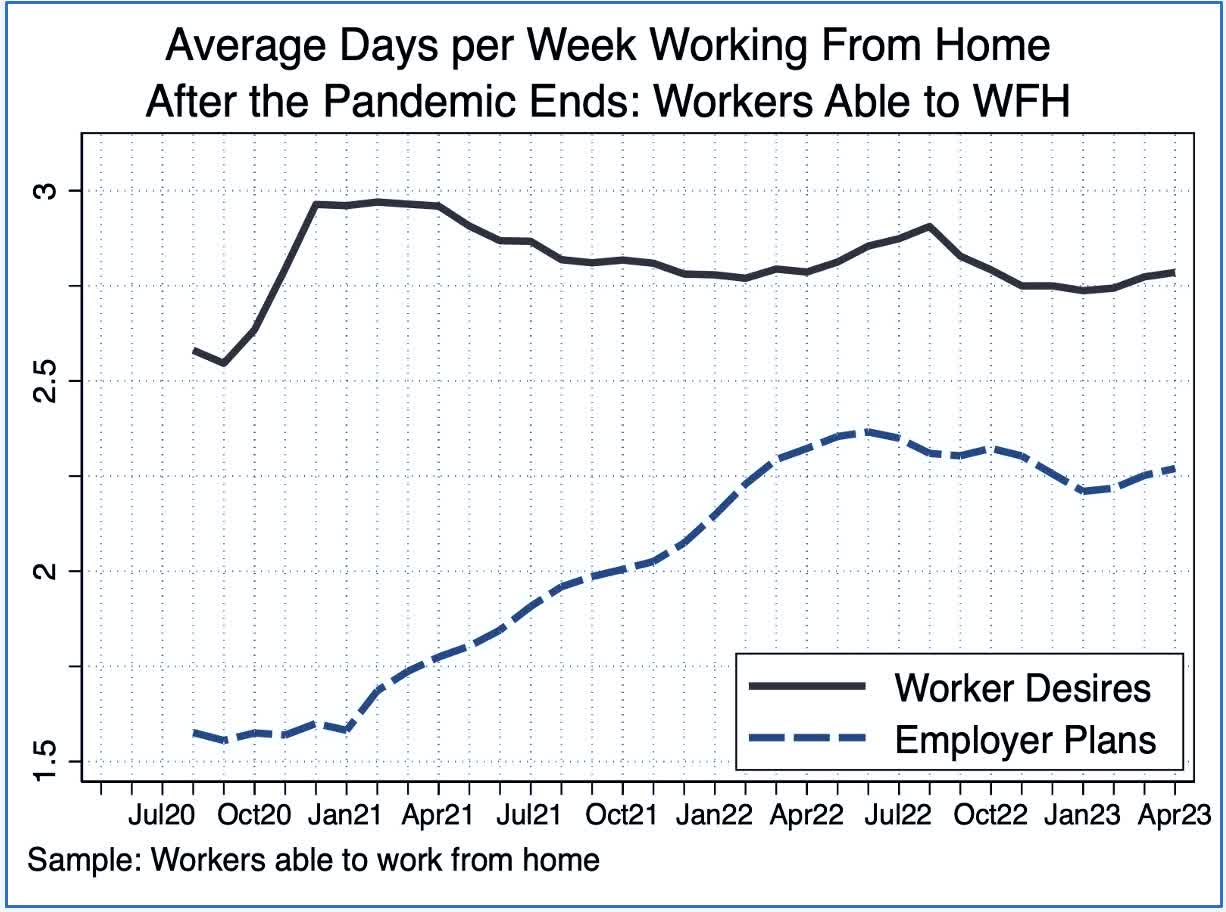
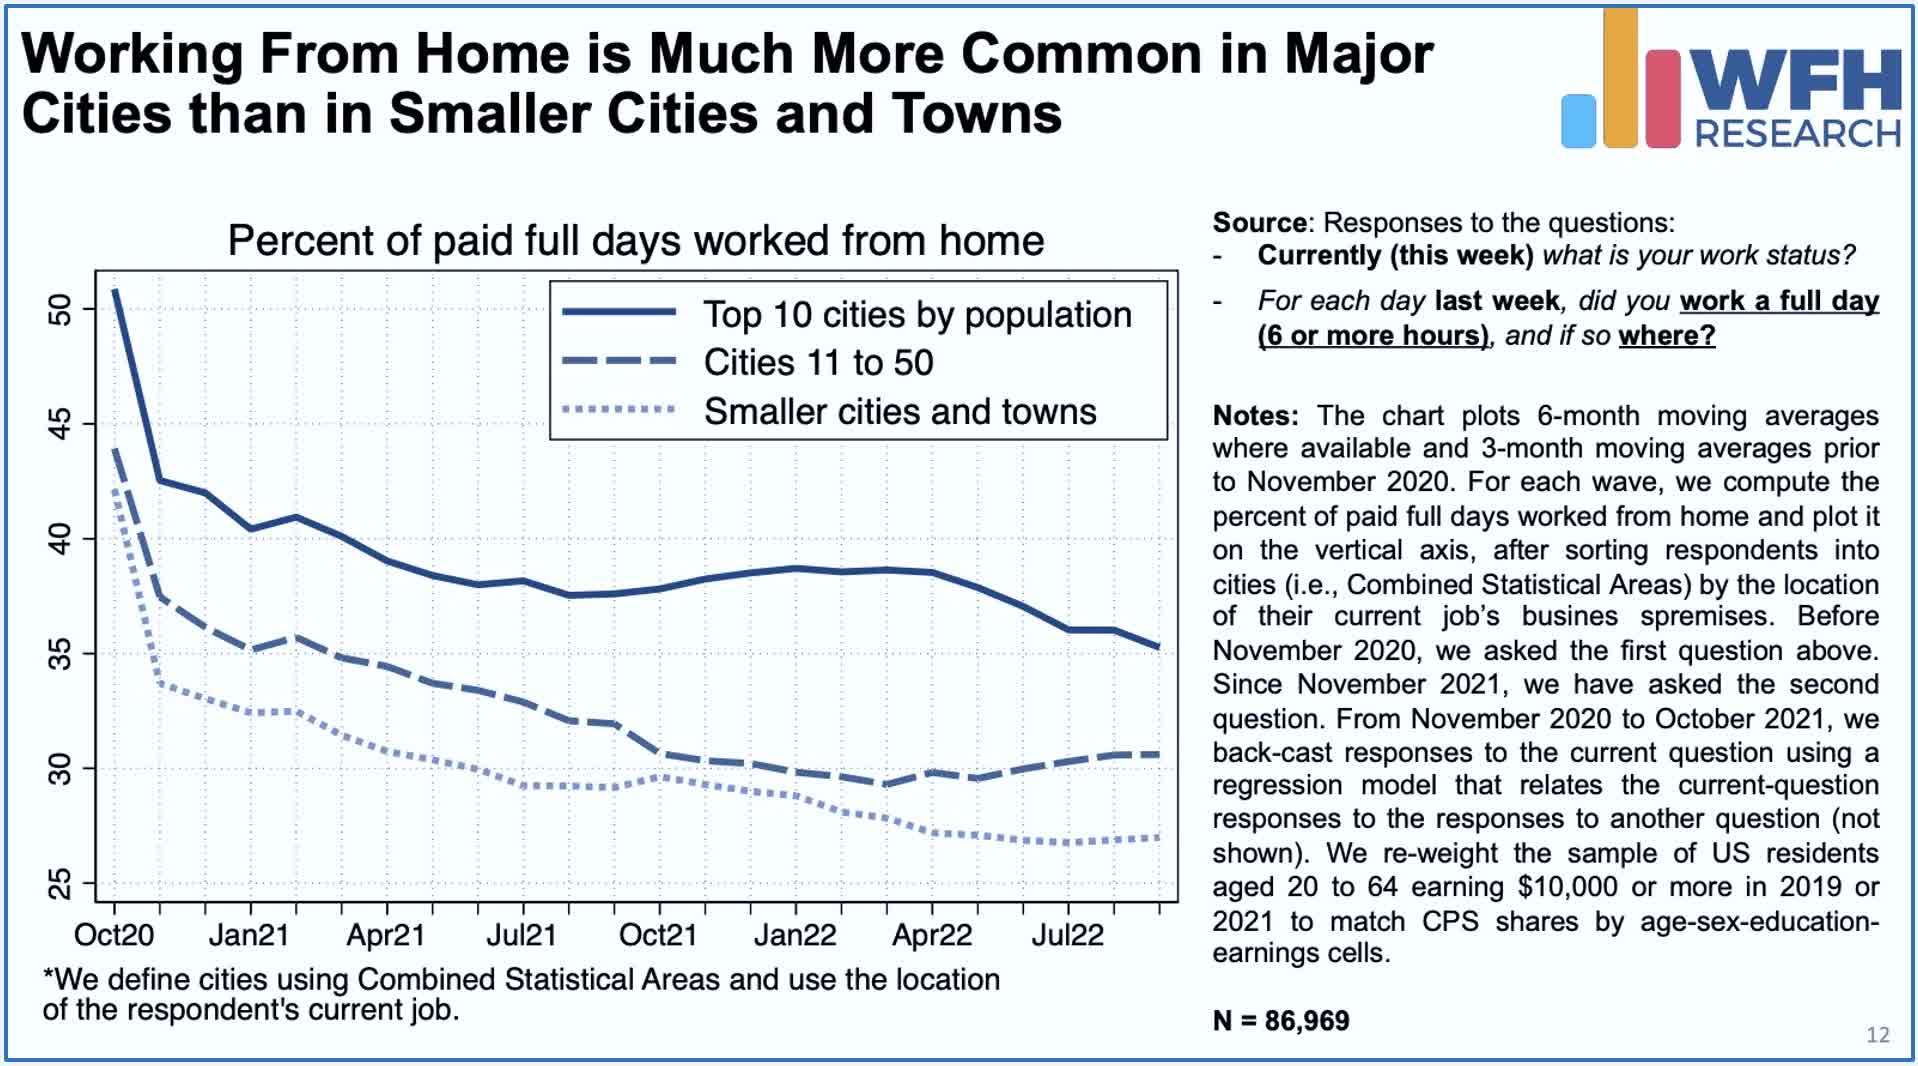
Consistent with this framework, in markets with shorter average commutes, the productivity and social benefit of the office environment are "worth" the commute time. In fact, Work From Home adoption remains primarily a 'Big City' trend with a near-linear correlation between the size of the market and the WFH rates. Industry and tenant mix has also become an increasingly important factor that explains the variance in office utilization rates and also captures some of the effects of commute times. Certain industries are far more WFH-friendly than others, particularly the technology and financial services industries, where WFH Research finds that employers expect just 2.2 to 2.5 office days per employee per week under their post-COVID plans. These office utilization rates are roughly half that of other office-using industries that expect their employees to report to the office 3-4 times per week.
Office REITs Stock Price Performance
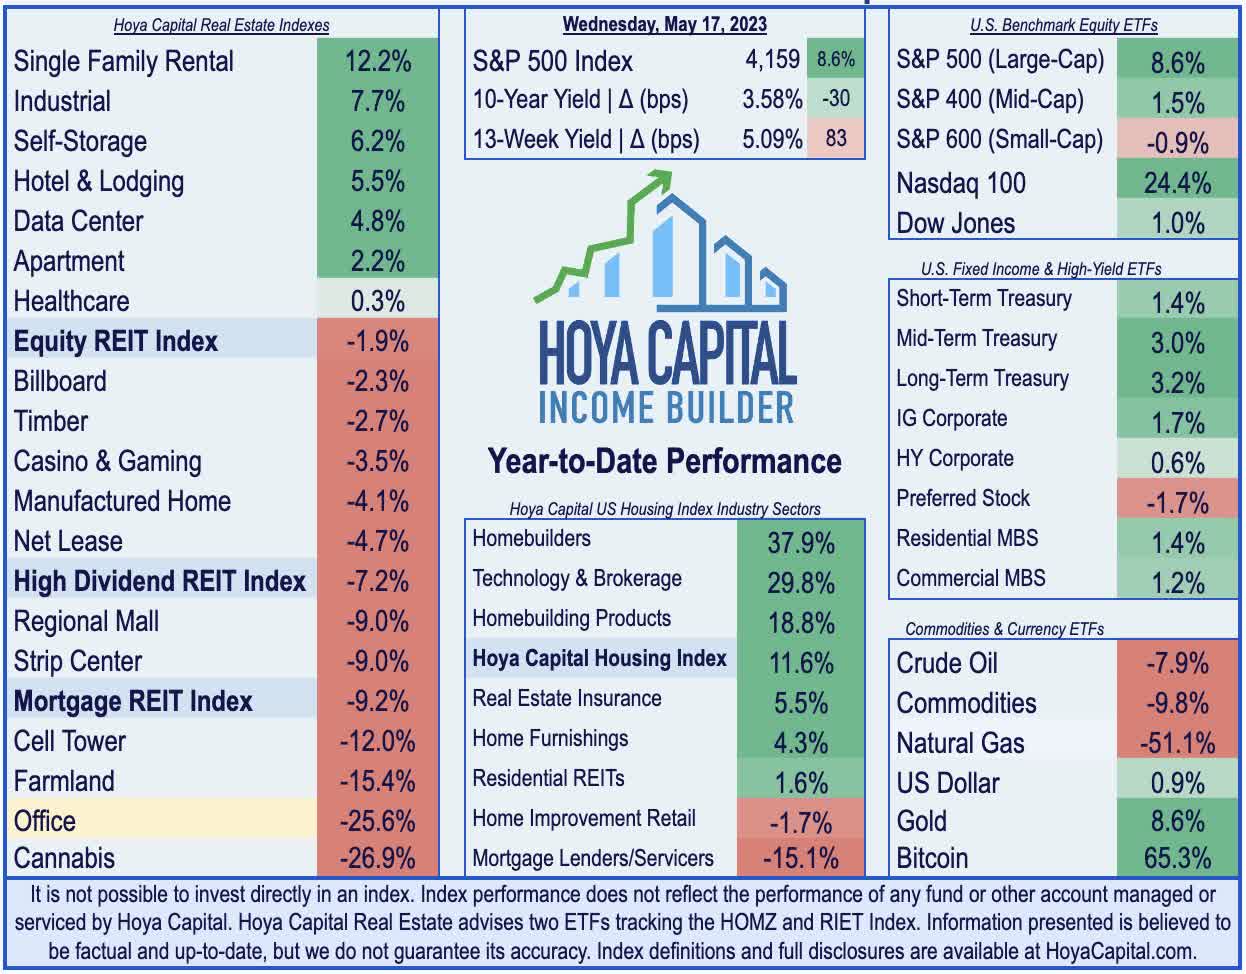
After riding the 'reopening rotation' and inflation trade to strong gains in early 2022, higher interest rates, recession concerns, and the sluggish "return to the office" have weighed heavily on the office REIT sector since mid-2022. Office REITs ultimately ended 2022 as the worst-performing property sector - extending their underperformance to a third-straight year - and are well on their way to extending this underperforming to a fourth-straight year in 2023. The Hoya Capital Office REIT Index - a market cap-weighted benchmark of the sector - has declined by more than 25% this year, significantly lagging the 1.9% decline from the Vanguard Real Estate ETF ( VNQ ).
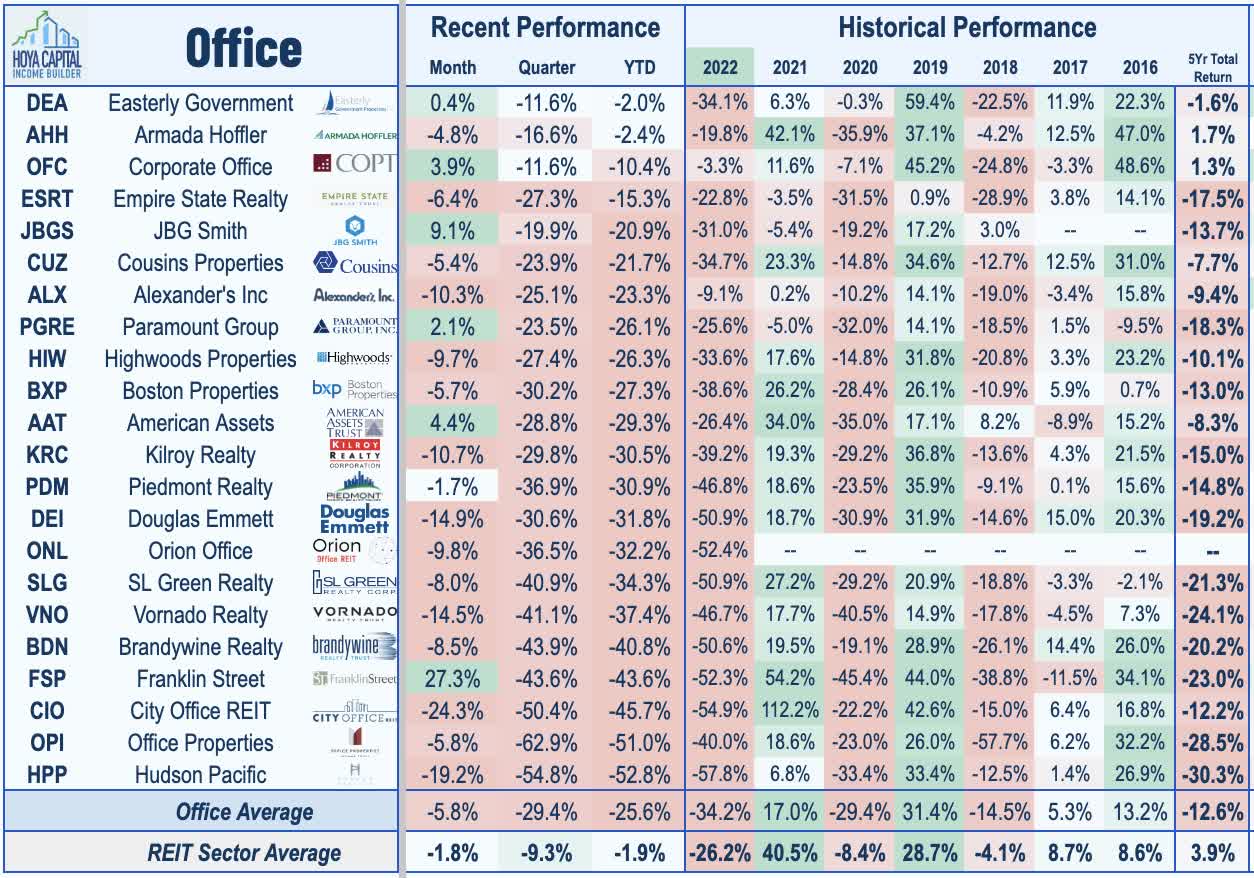
Diving deeper into the performance of these individual REITs - every office REIT was lower in 2022 while seven REITs declined by 50% or more, including Hudson Pacific ( HPP ), City Office ( CIO ), Orion Office ( ONL ), Franklin Street ( FSP ), and SL Green ( SLG ). The pain has continued into 2023 with nearly half the sector posting declines of over 40%, including five office REITs now lower by more than 50% for the year - Brandywine ( BDN ), City Office ( CIO ), Office Income ( OPI ), Hudson Pacific ( HPP ), and Franklin Street ( FSP ). Despite the bifurcating fundamentals between Sunbelt-focused office REITs and coastal-focused REITs, the stock performance trends haven't necessarily reflected these trends, and we see compelling value in several of the Sunbelt-heavy REITs that trade at historically deep discounts.
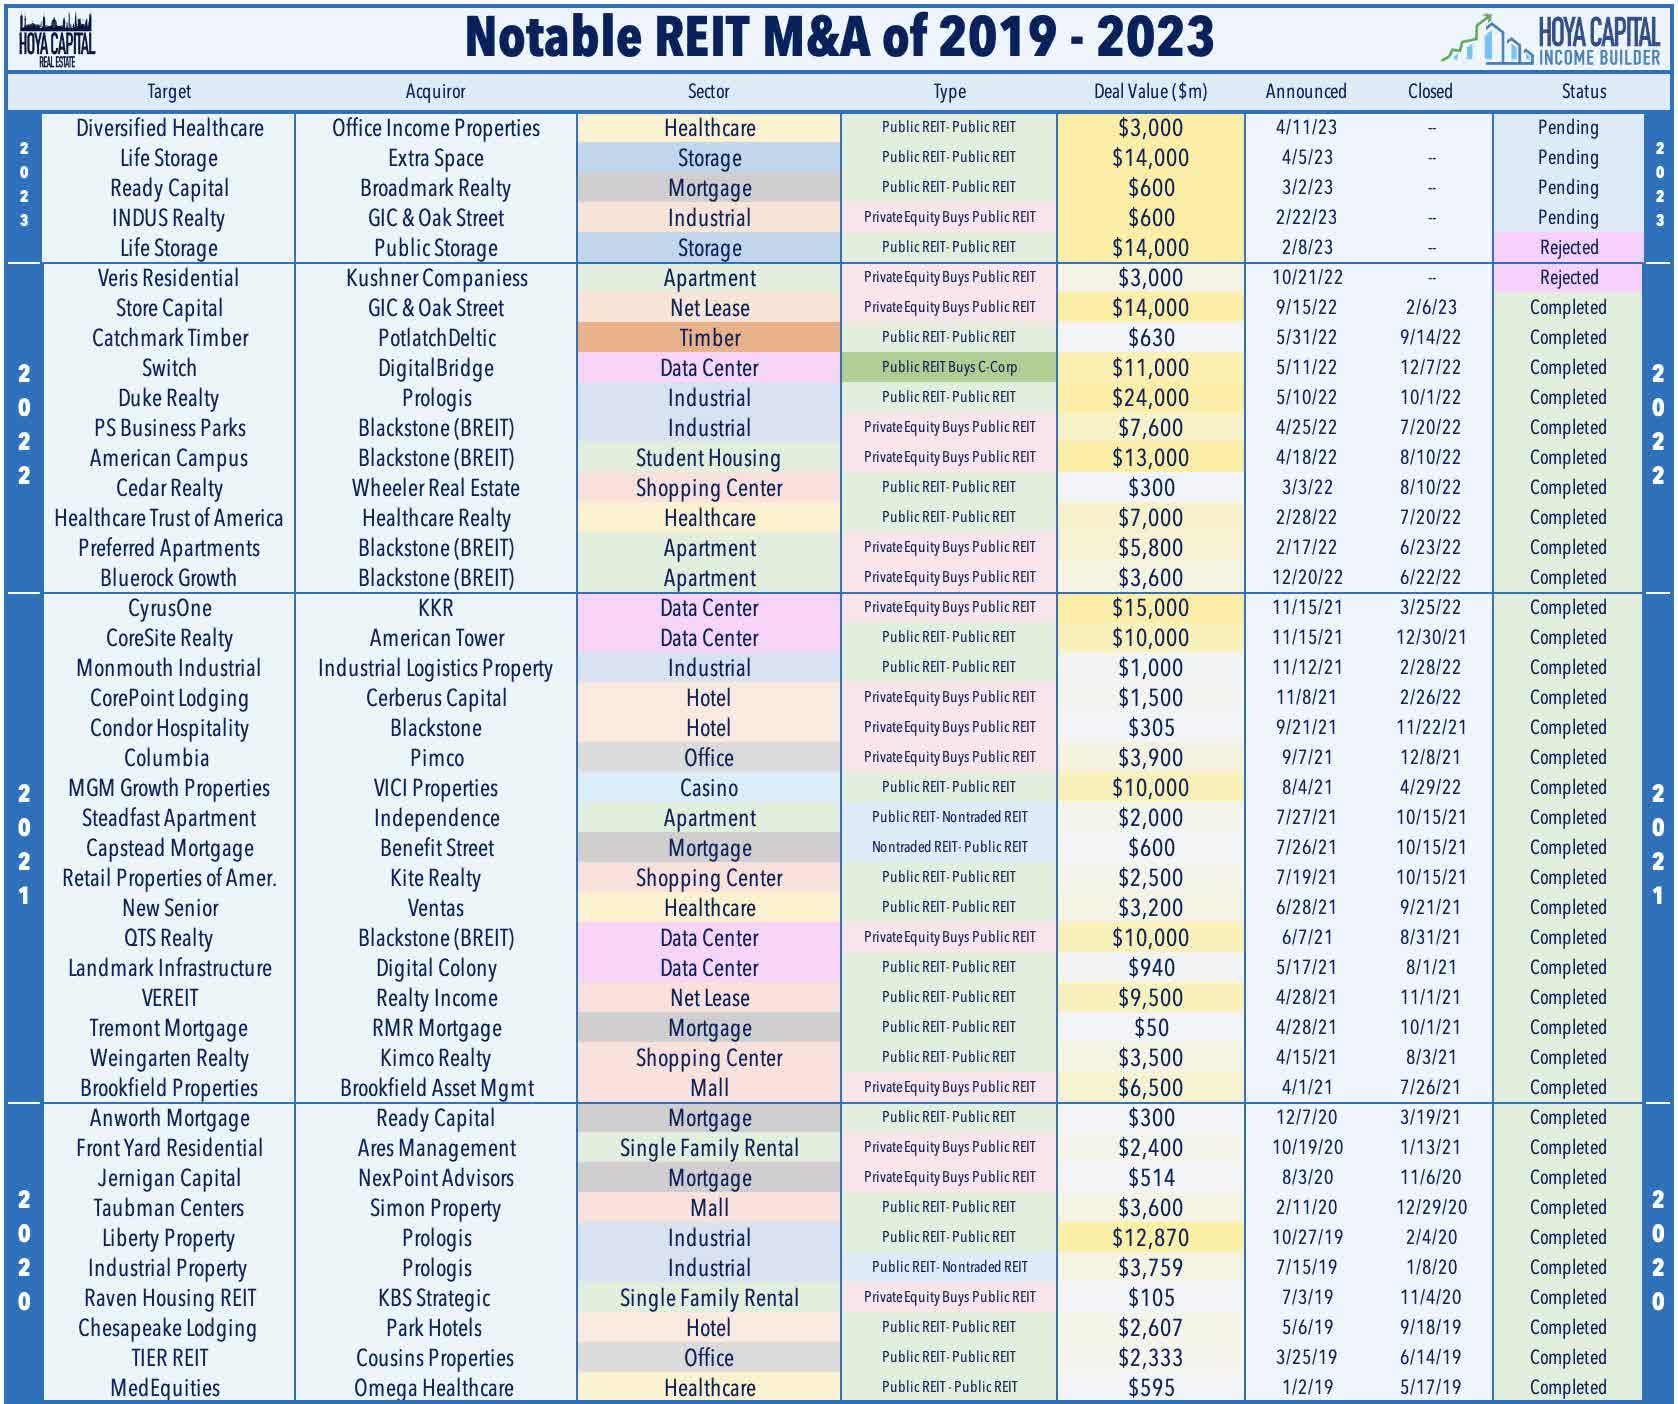
Several office REITs took advantage of the steep NAV discounts to create significant shareholder value when there was an opportunity amid the frenzy of M&A activity from mid-2020 through early-2022. In 2021, Columbia Property Trust was acquired by PIMCO at a healthy premium, underscoring our belief that the sector is long overdue for a wave of consolidation and asset sales. Elsewhere, Mack-Cali Realty rebranded itself as Veris Residential ( VRE ), reflecting the company's exit from the office sector through a series of asset sales as it transitions into a pure-play multifamily REIT. This move follows a similar strategic shift from Washington REIT , which sold its office portfolio to Brookfield ( BAM ) for $766M as WRE shifts its focus to multifamily and rebranded as Elme Communities ( ELME ).
Office REITs Dividend Yields
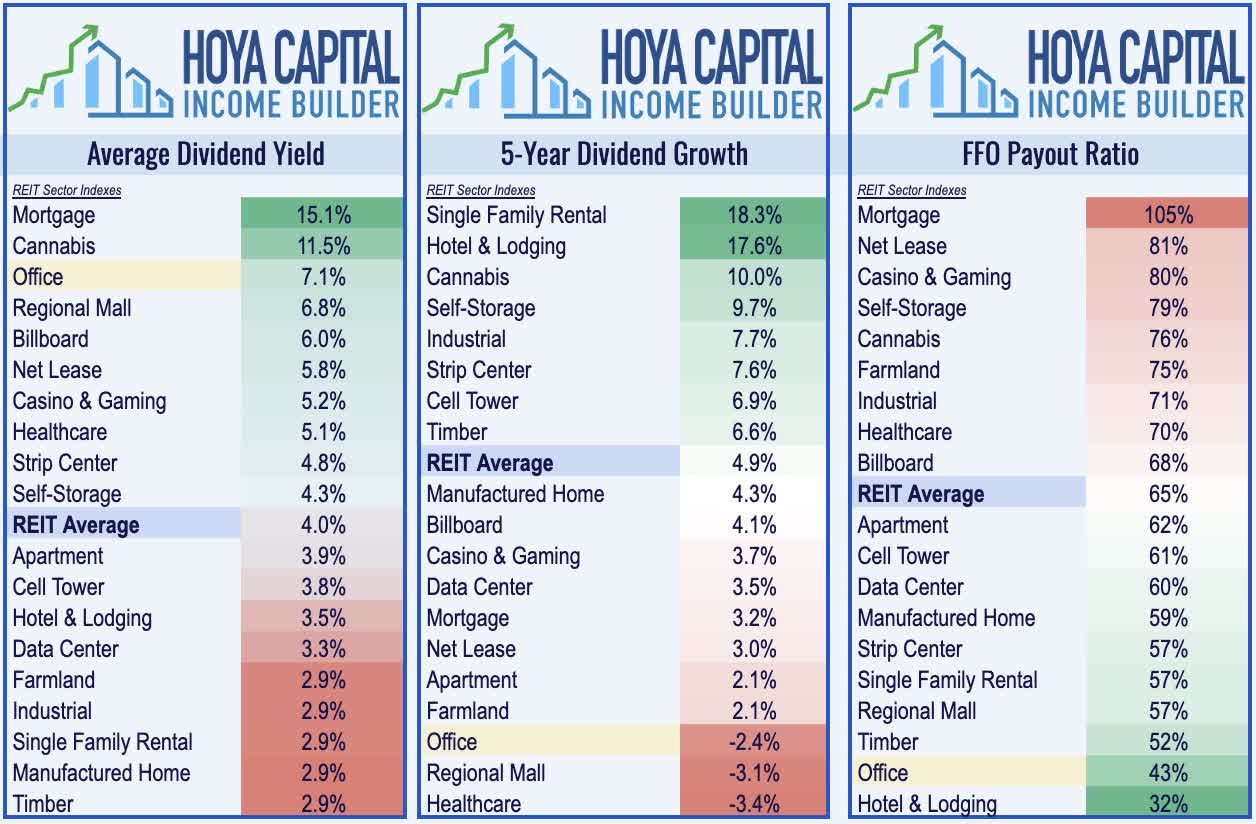
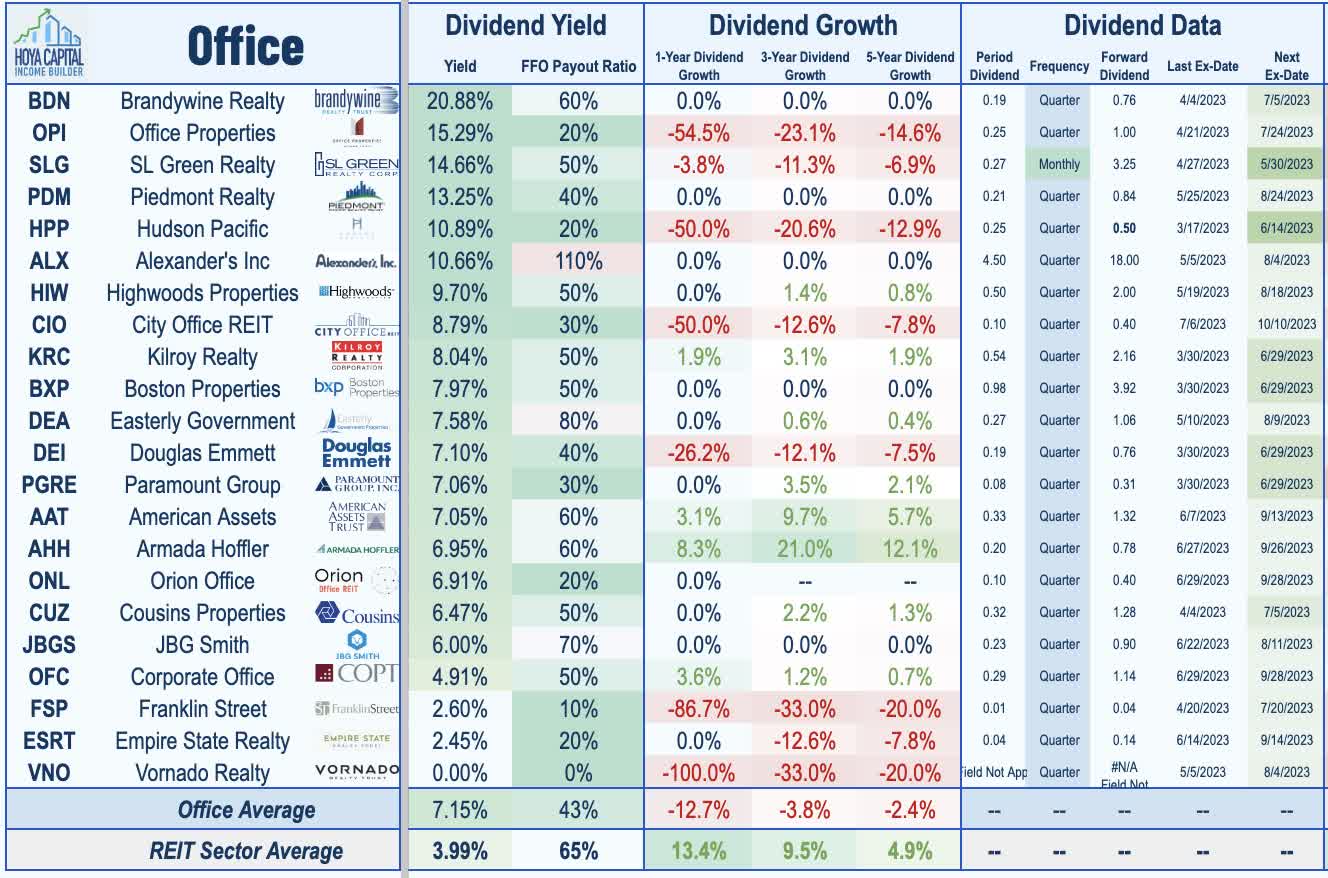
Despite a mini-wave of dividend reductions over the past several months, office REIT dividend yields have continued to swell and now rank as the highest-yielding major equity REIT sector with an average dividend yield of 7.1%. Eight office REITs have reduced their payouts in 2023 - accounting for half of the total REIT sector dividend reductions this year - including an outright dividend suspension from Vornado ( VNO ). Elevated debt levels - and an above-average usage of variable rate debt - was the common thread across the other seven REIT dividend reductions, all but two of which have come from coastal-focused office REITs. On the upside, one office REIT - Corporate Office ( OFC ) - has increased its dividend this year along with two office-heavy diversified REITs - Armada Hoffler ( AHH ) and American Assets ( AAT ).
Current payout ratios suggest that these distribution levels should be relatively sustainable as a whole, but several REITs with weaker balance sheets remain at higher risk for a potential dividend cut if fundamentals weaken further. Notably, office REITs have not historically been a high-yielding sector, and thus the attitude of treating dividends as "sacred" is not as evident in office REIT c-suites compared to historically yield-oriented sectors like net lease REITs and healthcare REITs. There is a wide range of dividend distribution strategies employed by the 23 REITs within the sector, with yields ranging from 20.7% from Brandywine ( BDN ) and 15.3% Office Properties ( OPI ) to a low of 0% from Equity Commonwealth ( EQC ) and Vornado Realty ( VNO ).
Takeaways: Stick To the Sunbelt & Secondary
Just how bad is it? The surge in interest rates has turned a weak-but-manageable situation into a bleak one, but there is more nuance than what the prevailing narrative would suggest. Coastal tech-heavy markets remain at sub-50% daily utilization rates, but Sunbelt and secondary markets have recovered to over 75%. Leasing trends and rental rates have exhibited similarly wide variance with Sunbelt and secondary-focused REITs, so far, exhibiting leasing trends that are more akin to a typical recession than a catastrophic collapse that the current valuations would suggest. We remain bearish on coastal REITs with transit-heavy commutes - the new "Class C/D malls" - but we're calling a bottom for a handful of Sunbelt and secondary-focused REITs focused on markets with net population growth, shorter commute times, and a more favorable industry mix, but are nevertheless priced at similarly low valuations.
For an in-depth analysis of all real estate sectors, check out all of our quarterly reports: Apartments , Homebuilders , Manufactured Housing , Student Housing , Single-Family Rentals , Cell Towers , Casinos , Industrial , Data Center , Malls, Healthcare , Net Lease , Shopping Centers , Hotels , Billboards , Office , Farmland , Storage , Timber , Mortgage , and Cannabis.
Disclosure : Hoya Capital Real Estate advises two Exchange-Traded Funds listed on the NYSE. In addition to any long positions listed below, Hoya Capital is long all components in the Hoya Capital Housing 100 Index and in the Hoya Capital High Dividend Yield Index . Index definitions and a complete list of holdings are available on our website.
For further details see:
Office REITs: The New Malls