COM - OIH: Outperforming Crude Oil But Take Caution Into Year-End (Rating Downgrade)
2023-11-20 09:33:50 ET
Summary
- WTI crude oil fell from its late-September high but rebounded slightly on Friday last week.
- The OIH ETF has been the worst-performing among well-known Energy equity funds since oil's September peak.
- I am downgrading OIH from a buy to a hold due to concerns on the chart, and I point out key levels to watch on this low-P/E ETF.
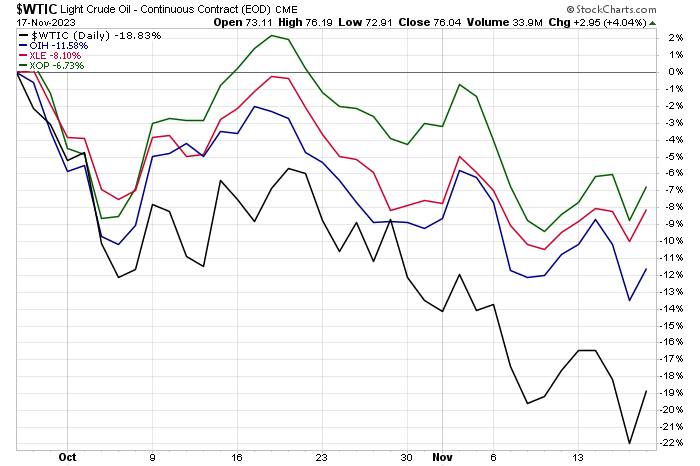
WTI crude oil fell into bear-market territory off its late-September peak last week. A Friday rebound brought "Texas Tea" back to just a 19% drawdown from late Q3, but there has been interesting action within the Energy sector.
I track performances among the Energy Select Sector SPDR ETF (XLE), the SPDR S&P Oil & Gas Exploration & Production ETF (XOP), and the VanEck Oil Services ETF (OIH). Among the trio of well-known Energy equity funds, OIH has been the worst-performing since WTI's peak.
I am downgrading OIH from a buy to a hold from a tactical perspective.
WTI Underperforms Energy Stocks Since Late September
For background, according to VanEck , OIH seeks to replicate as closely as possible, before fees and expenses, the price and yield performance of the MVIS US Listed Oil Services 25 Index, which follows the overall performance of US-listed companies involved in oil services to the upstream oil sector, which include oil equipment, oil services, or oil drilling. The index comprises the most liquid companies in the industry based on market capitalization and trading volume, and will generally own the largest oil drillers and oil services companies. The ETF may hold both US and foreign shares.
OIH is a mid-sized fund with more than $2.3 billion in assets under management and its dividend yield is far below many other Energy sector ETFs at just 0.9% on a trailing 12-month basis as of November 17, 2023. Share-price momentum has been strong in recent months, particularly since the second half of the year began. With a modest 0.35% annual expense ratio , OIH earns a strong B ETF Grade, though it is considered a risky portfolio. Liquidity is healthy, however, considering its 90-day average volume of more than 500k shares and a 30-day median bid/ask spread of seven basis points.
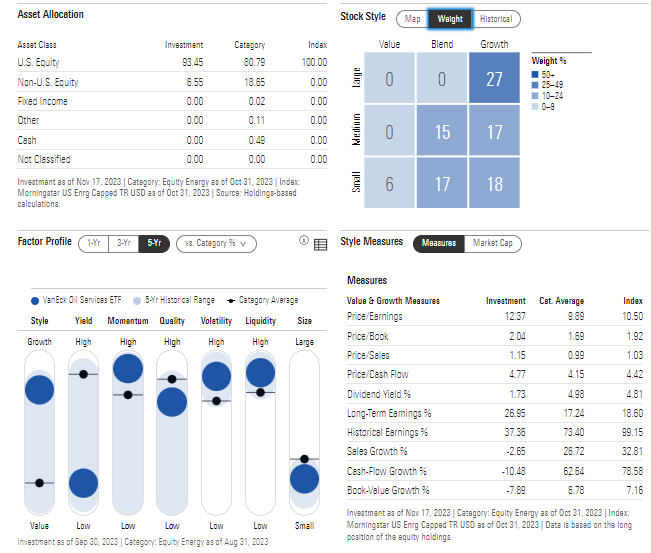
Digging into the portfolio, OIH's allocation places primarily in the large-cap growth area, though barely more than a quarter of its collective holdings are seen there. There's diversification with about one-third of OIH in each of the three market cap ranges: large, mid, and small. Just 6% of the fund is considered value, but its price action will often track closely with cyclical Energy equities, many of which feature modest price-to-earnings ratios.
OIH features a low 12.4 P/E multiple, and it trades just 1.15 sales. That is an attractive valuation in light of the portfolio's long-term earnings growth rate north of 20%.
OIH: Portfolio & Factor Profiles
OIH has a high 74% of its allocation in the top 10 positions, so closely monitoring fundamentals and earnings trends in its top components is prudent. SLB ( SLB ), formerly known as Schlumberger, accounts for almost one-fifth of the ETF while Halliburton ( HAL ) and Baker Hughes ( BKR ) together account for about 20% of the fund as well.
OIH: A Concentrated Holdings Situation, Small Yield
Seeking Alpha
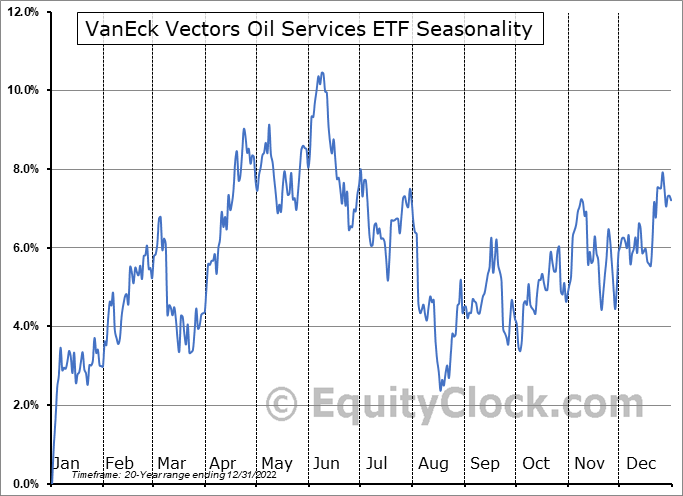
Seasonally, OIH tends to rally into year-end through early March of the new year, according to data from Equity Clock . So that's a tailwind to consider.
OIH: Bullish Near-Term Seasonal Trends
The Technical Take
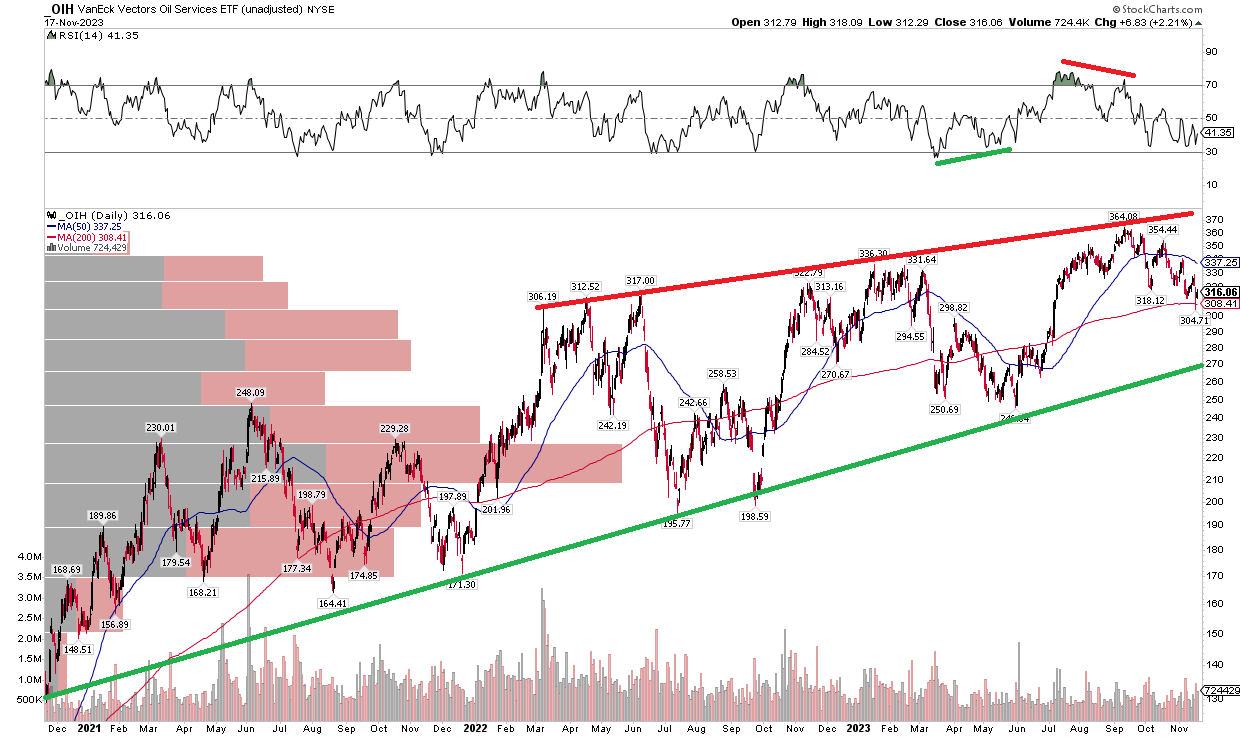
Back in June , I pointed out that OIH appeared due for a rebound off a successful test of its uptrend channel which is more than three years old now. Notice in the chart below that the fund's price rallied from under $250 around mid-year to above $360 just before crude oil prices notched their rebound high above $95 two months ago. As WTI has pulled back, so too has OIH. I would not be surprised to see the fund edge lower toward the green uptrend support line, currently near $270. Buying on a pullback about 10% lower from here with a stop under the June low would be a favorable risk/reward play.
Also, take a look at the long-term 200-day moving average. It has turned flat, and that comes after a bearish RSI divergence when scanning the momentum oscillator at the top of the graph. So, there are certainly some warning signs to heed right now, despite the positive seasonal tendency.
Overall, I see downside risk with the OIH's chart over the next few months, so taking profits on any long positions put on late in Q2 is prudent in my view.
OIH: Shares Pullback From Uptrend Resistance, Support at $270
The Bottom Line
I am downgrading OIH from a buy to a hold from an intermediate-term perspective. I continue to like the ETF's valuation and modest cost, but concerns on the chart warrant some caution.
For further details see:
OIH: Outperforming Crude Oil, But Take Caution Into Year-End (Rating Downgrade)