CA - Ovintiv: A Wait-And-See Opportunity With Long-Term Upside
2024-01-11 12:43:54 ET
Summary
- Despite Ovintiv being a profitable company with positive rentability in most years and increasing production, the company is highly vulnerable to low energy prices.
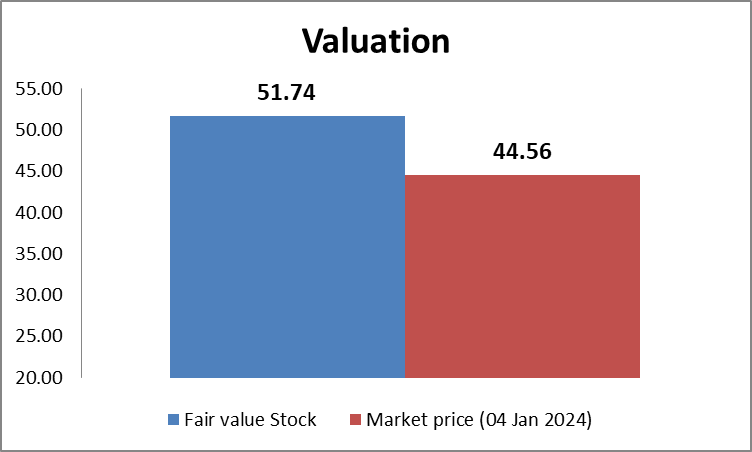
- The DCF valuation model indicates a fair value of $51.74 per share, while the current market value is $44.56, suggesting a 16.12% undervaluation.
- Investors should hold Ovintiv or add it to their watch list and wait for energy prices to decline.
Investment Thesis
I recommend staying neutral on Ovintiv ( OVV ) because the production growth perspective does not compensate for the negative outlook on energy prices, and the market considers Ovintiv a risky investment.
From my perspective, there are two realities: Ovintiv's internal and external situations. The internal situation depicts a company capable of growing, investing, and generating profit in most of the years. The other reality punishes Ovintiv with a negative perspective on energy prices and a high cost of capital of 11.40%.
Overview
Ovintiv is focused on exploring and developing oil, NGLs, and natural gas reserves in the United States and Canada. In 2020, the company was born after restructuring Encana, and it has three operation segments: USA Operations, Canada Operations, and Market Optimization.
In 2022, the USA Operations registered 48.8 million barrels of oil daily, 47.2 million barrels of NGLs, and 546 million cubic feet of gas. Meanwhile, for the same year, in Canada, the daily oil production was 0.1 million barrels of oil, 13.8 million barrels of NGLs, and 1002 million cubic feet of gas daily. The last segment, Market Optimization, is responsible for selling the company's production, buying third-party products, and entering into contract agreements to mitigate price risk.
Source: TradingView. Ovintiv stock price.
The first step for understanding a company is to see its market price evolution because a chart is worth a thousand words. The previous chart reveals a price decline between 2008 and 2020; subsequently, Ovintiv's share price has followed an upward trend. Additionally, the company lost more than 99% of its market value from 2008 to 2020, a signal for almost every investor that Ovintiv is a high-risk investment.
This article will analyze Ovintiv's financial statements and implement the discounted cash flow ((DCF)) model to find Ovintiv's fair value. The scope is to see if the share price per action can maintain its recent upward trend.
Production and Price Per Segment
I will start by analyzing Ovintiv's business sectors to shed light on whether the company can grow or not and how it is growing.
There is an important year, 2019, in which Encana acquired Newfield Exploration Company and subsequently changed its name to Ovintiv, allowing more presence in the United States and adding operations in Anadarko, Bakken, and Uinta. After this acquisition, the production levels increased across all of Ovintiv's business sectors.
Image was created by the author with data from Ovintiv's annual and quarterly reports.
The daily oil production in thousands of barrels of oil (mbbl) stayed stable from 2015 to 2018. However, during 2019-2022, oil production decreased due to the disinvestment policy, declining from 164.4 mbbl to 131.6 mbbl, representing a drop of 19.95%. In 2023, Ovintiv acquired assets in the Permian Basin for $4.275 billion, increasing its oil production to 170.9 mbbl.
The previous paragraph shows that the company has focused on increasing its oil production. The growth has not been constant and regular over time, but there is an upward trend.
The natural gas sector experienced a decline between 2015 and 2018. After Ovintiv purchased Newfield Exploration in 2019, its production remained almost at the same level in the upcoming years. There was an 8.77% increase between 2022 and September 2023. In my opinion, Ovintiv's policy is to maintain a stable gas production level. Rising or declining natural gas prices do not influence production.
Image was created by the author with data from Ovintiv's annual and quarterly reports.
From 2015 to 2019, the NGLs Plan Condensate production increased by 157.7%. However, this growth was followed by a decline, with production dropping from 52.9 mbbl in 2019 to 43.3 mbbl in September 2023, representing an 18.1% decrease. Since 2019, Ovintiv has disinvested part of its NGLs Plant operation, which explains the reduction in production levels despite rising prices.
NGLs-Other segment increased considerably in 2019 with an annual variation of 115.82%; subsequently, the production level remained stable with minor changes.
For 2024, the only aspect to consider is that Ovintiv plans to increase its oil production to 200 mbbl per day, but there is no signal indicating an increase in the gas and NGLs productions; the only clue is Ovintiv's production forecast for Q4-2023, in which the company expects a decline in the gas and NGLs productions.
Total Production
This section will chart Ovintiv's total production measured in barrels of oil equivalent ((BOE)); the data comes from Ovintiv's quarterly earnings reports and annual financial reports .
Image was created by the author with data from Ovintiv's annual and quarterly reports.
Visualizing the chart, implementing a regression model, or estimating the annual average growth rate, all these measures converge to the same conclusion: that Ovintiv is capable of growth. The problem is the irregular growth that penalizes Ovintiv, like the periods 2015-2017 and 2019-2022, adding uncertainty to the investor.
The annual average growth rate between 2015 and 2023 was 6.19%; although Ovintiv does not have a growth rate superior to 10% or 15%, it has a higher rate than the USA petroleum and other liquids annual average production growth rate of 4.45%.
An annual growth of 6.19% supports the hypothesis that the stock price of Ovintiv will continue an upward trend. Let's analyze critical financial metrics to evaluate the financial health.
Financial Analysis
This section will analyze three components: investment, rentability, and debt. They can shed light on Ovintiv's financial health. The data to generate the charts in this section come from Ovintiv's annual reports and quarterly earning financial reports ; meanwhile, oil price data come from the Federal Reserve Bank of St. Louis .
Image was created by the author with data from Ovintiv's financial statements and Bank of St.Louis.
In the last eleven years, Ovintiv had negative ROEs in three years, corresponding these losses with the years with the lowest WTI average prices. According to Ovintiv Annual Reports, these declines were due to lower gas, NGL, and oil prices.
There are two aspects to mention: Ovintiv is capable of obtaining positive ROE even with oil prices between $50 to $55 per barrel, but none of the positive ROEs arrive at 50%; on the other side, when the ROEs are negative, they can sink below minus 80%, causing an unbalanced risk oriented to negative values. An illustration of the risk was in 2020 when the ROE was minus 159%, causing a decline in Ovintiv's share price below $3; three years later, in December 2023, the price was over $40 per share.
Image was created by the author with data from Ovintiv's financial statements and Bank of St.Louis.
Besides 2013 and 2020, when the debt-to-asset ratio crossed 40%, Ovintiv maintained this indicator under 35%. As a consequence of the coronavirus that caused lower oil prices, in 2020, Ovintiv made an impairment of $5580, increasing the debt-to-asset ratio to 48%. There are two years to highlight, 2019 and 2023, because, in both years, the company acquired new assets, increasing its production level and debt, with debt-to-equity ratios of 32% in 2019 and 31% in 2023.
For the upcoming years, I am inclined to think that there is not going to be a new important acquisition for at least 2-3 years because 31%-32% is the debt-to-asset ratio after a relevant purchase, and 24%-27% is the debt-to-asset ratio before a significant purchase.
Image was created by the author with data from Ovintiv's financial statements.
Except for 2020, Ovintiv has maintained capital expenditures over depreciation, depletion, and amortization. In eight out of eleven years, the net capital expenditure exceeded $600 million, resulting in:
- The proved reserves were 1930.3 million barrels or equivalent ((MMBOE)) in 2013 and arrived at 2273.6 MMBOE by December 2022.
- The production measured in BOE in 2013 was 516.7 million BOE and arrived at 571.8 7 million BOE by September 2023.
All in all, the three charts show that Ovintiv can reinvest and maintain both acceptable levels of debts and positive ROEs in most years. However, when the return on equity is negative, the company's financial health suffers considerably. So, these results support the idea that Ovintiv's stock price will follow a horizontal movement with high volatility.
Valuation
This section will implement the DFC valuation model to obtain Ovintiv's fair value per share. Beside Revenue, the rest of the accounting variables will be projected based on the historical average ratio of these items relative to Revenue; the Forecast Rate column shows these averages. Outlier values, denoted in yellow, will be excluded from the analysis. Finally, the tax rate to use is 8%.
Image was created by the author with data from Ovintiv's financial statements.
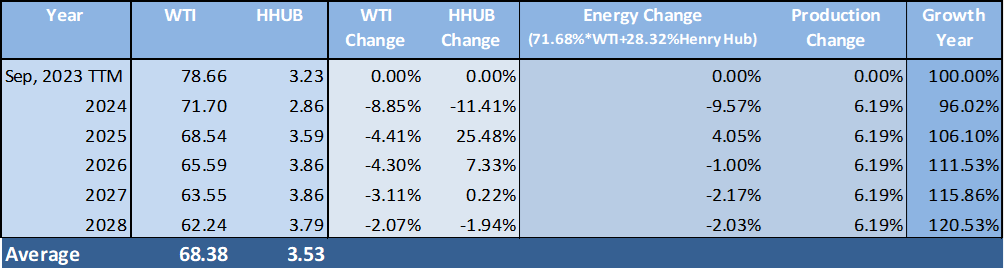
Energy prices are cyclical, and forecasting these prices based on previous ones will throw misleading results. I will use WTI and Henry Hub forward curves to project sales; additionally, I will include Ovintiv's average production rate of 6.19% in the Revenue projection.
The following table shows the columns WTI and HHUB ; their values are the average per year of the WTI and Henry Hub future contracts. For instance, the WTI value for 2025, which is $68.55, represents the average between the twelve future contracts of that year. January 2024 futures contract is not included as it has expired. Subsequently, the annual change for WTI and HHUB are the columns WTI Change and HHUB Change , respectively.
During 2020-2022, the gas natural business sector represented 28.32% of the revenues; therefore, to construct Energy Change , 28.32% of the weight will go to Henry Hub and 71.68% to WTI. For instance, the Energy Change in 2025 is -4.41% * 71.68% + 25.48% * 28.32% = 4.05%.
The variable Energy Change shows a negative outlook for Ovintiv's future sales. The years 2024, 2026, 2027, and 2028 indicate energy prices decline, a negative aspect for the company.
Ovintiv's production, measured in BOE, is the second rate to forecast the Revenue; the average production rate increased by 6.19% between 2015 and September 2023.
Image was created by the author with data from filings and the Chicago Mercantile Exchange.
Finally, we obtain the Growth Year using the Energy Change and Production Change columns. For 2024, Growth Year is 100%*(1-0.0957)*(1-0.0619) = 96.02%. I want to highlight that the Growth Year column considers the energy price expectations and Ovintiv's average growth rate.
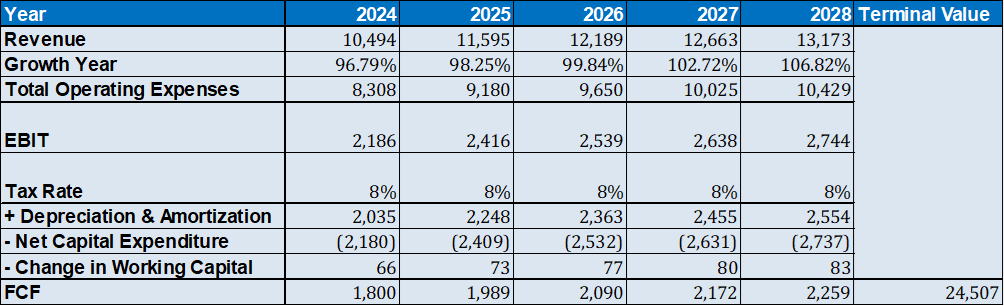
With the previous input in place, the FCF for 2024, 2025, 2026, 2027, 2028, and the terminal value are:
Image was created by the author with data from Ovintiv's filings and the Chicago Mercantile Exchange.
For calculating the terminal value, I will use the perpetuity growth method with a perpetuity growth rate equal to the five-year average 10-year US bond yield of 2.18%. The discount rate is equal to the WACC.
The values to calculate the weighted average cost of capital are:
Image was created by the author with data from Ovintiv's filings.
By integrating the preceding inputs and implementing the discounted cash flow ((DCF)) model:
Image was created by the author with data from Ovintiv's filings and seekingalpha.com
Based on the free cash flow model, Ovintiv's fair value is $51.74 per share, and the current market value is $44.56. So, there is a 16.12% of undervaluation. Answering the original question of whether or not the price per share of Ovintiv will continue an upward trend, my opinion is that the price will move horizontally.
Risk
This section will assume different oil and gas price scenarios; the purpose is to evaluate how the intrinsic value changes under different energy prices. The production rate will remain unchanged at 6.19% yearly.
Image was created by the author with data from Ovintiv's filings.
Under the assumption that, on average, the WTI and Henry Hub future prices are 30% higher than the baseline valuation Energy Prices +0 %, Ovintiv's share intrinsic value is $ 70.04 per share. Assuming energy prices are 10% higher than the baseline valuation Energy Prices +0, Ovintiv's fair value is $59.17 per share. If both prices decline 10% from the baseline valuation, $44.31 is Ovintiv's intrinsic value per share.
Conclusion
Ovintiv is a profitable company, having rentability in eight out of eleven years between 2013 and September 2023. The losses were due to lower energy prices in 2015, 2016, and 2020, in which prices collapsed.
The company has maintained an investment strategy with positive results, having a 6.19% average growth rate in its production.
However, the energy market shows a negative outlook with lower prices in the upcoming years. Additionally, the market considers Ovintiv a high-risk investment with a WACC of 11.40%, which affects Ovintiv's valuation. When oil prices crash, the company is vulnerable and registers massive losses.
I recommended holding Ovintiv, given that the company stock price is highly volatile, there is no substantial difference between the intrinsic value of $51.74 per share and the market value of $44.56. Although the fair value is 16.62% over the market value, I do not consider Ovintiv a great opportunity. Another recommendation is to add this stock to your watch list and wait until energy prices decline because Ovintiv will be an attractive investment.
For further details see:
Ovintiv: A Wait-And-See Opportunity With Long-Term Upside