TMO - Parker-Hannifin: Dominating A Fragmented $135 Billion Market
2023-06-09 10:00:00 ET
Summary
- Parker-Hannifin is a global leader in the Motion & Control industry, with a 16% CAGR over the past decade and aims to increase its market share from 13% to 20%.
- The company is diversified across various end markets and sees growth opportunities in Aerospace, Digitalization, Electrification, and clean technologies.
- PH plans to expand its Aerospace & Defense segment to 33% of its portfolio, recently acquiring Meggitt for 6.3 billion pounds and expects $300 million in cost synergies by FY26.
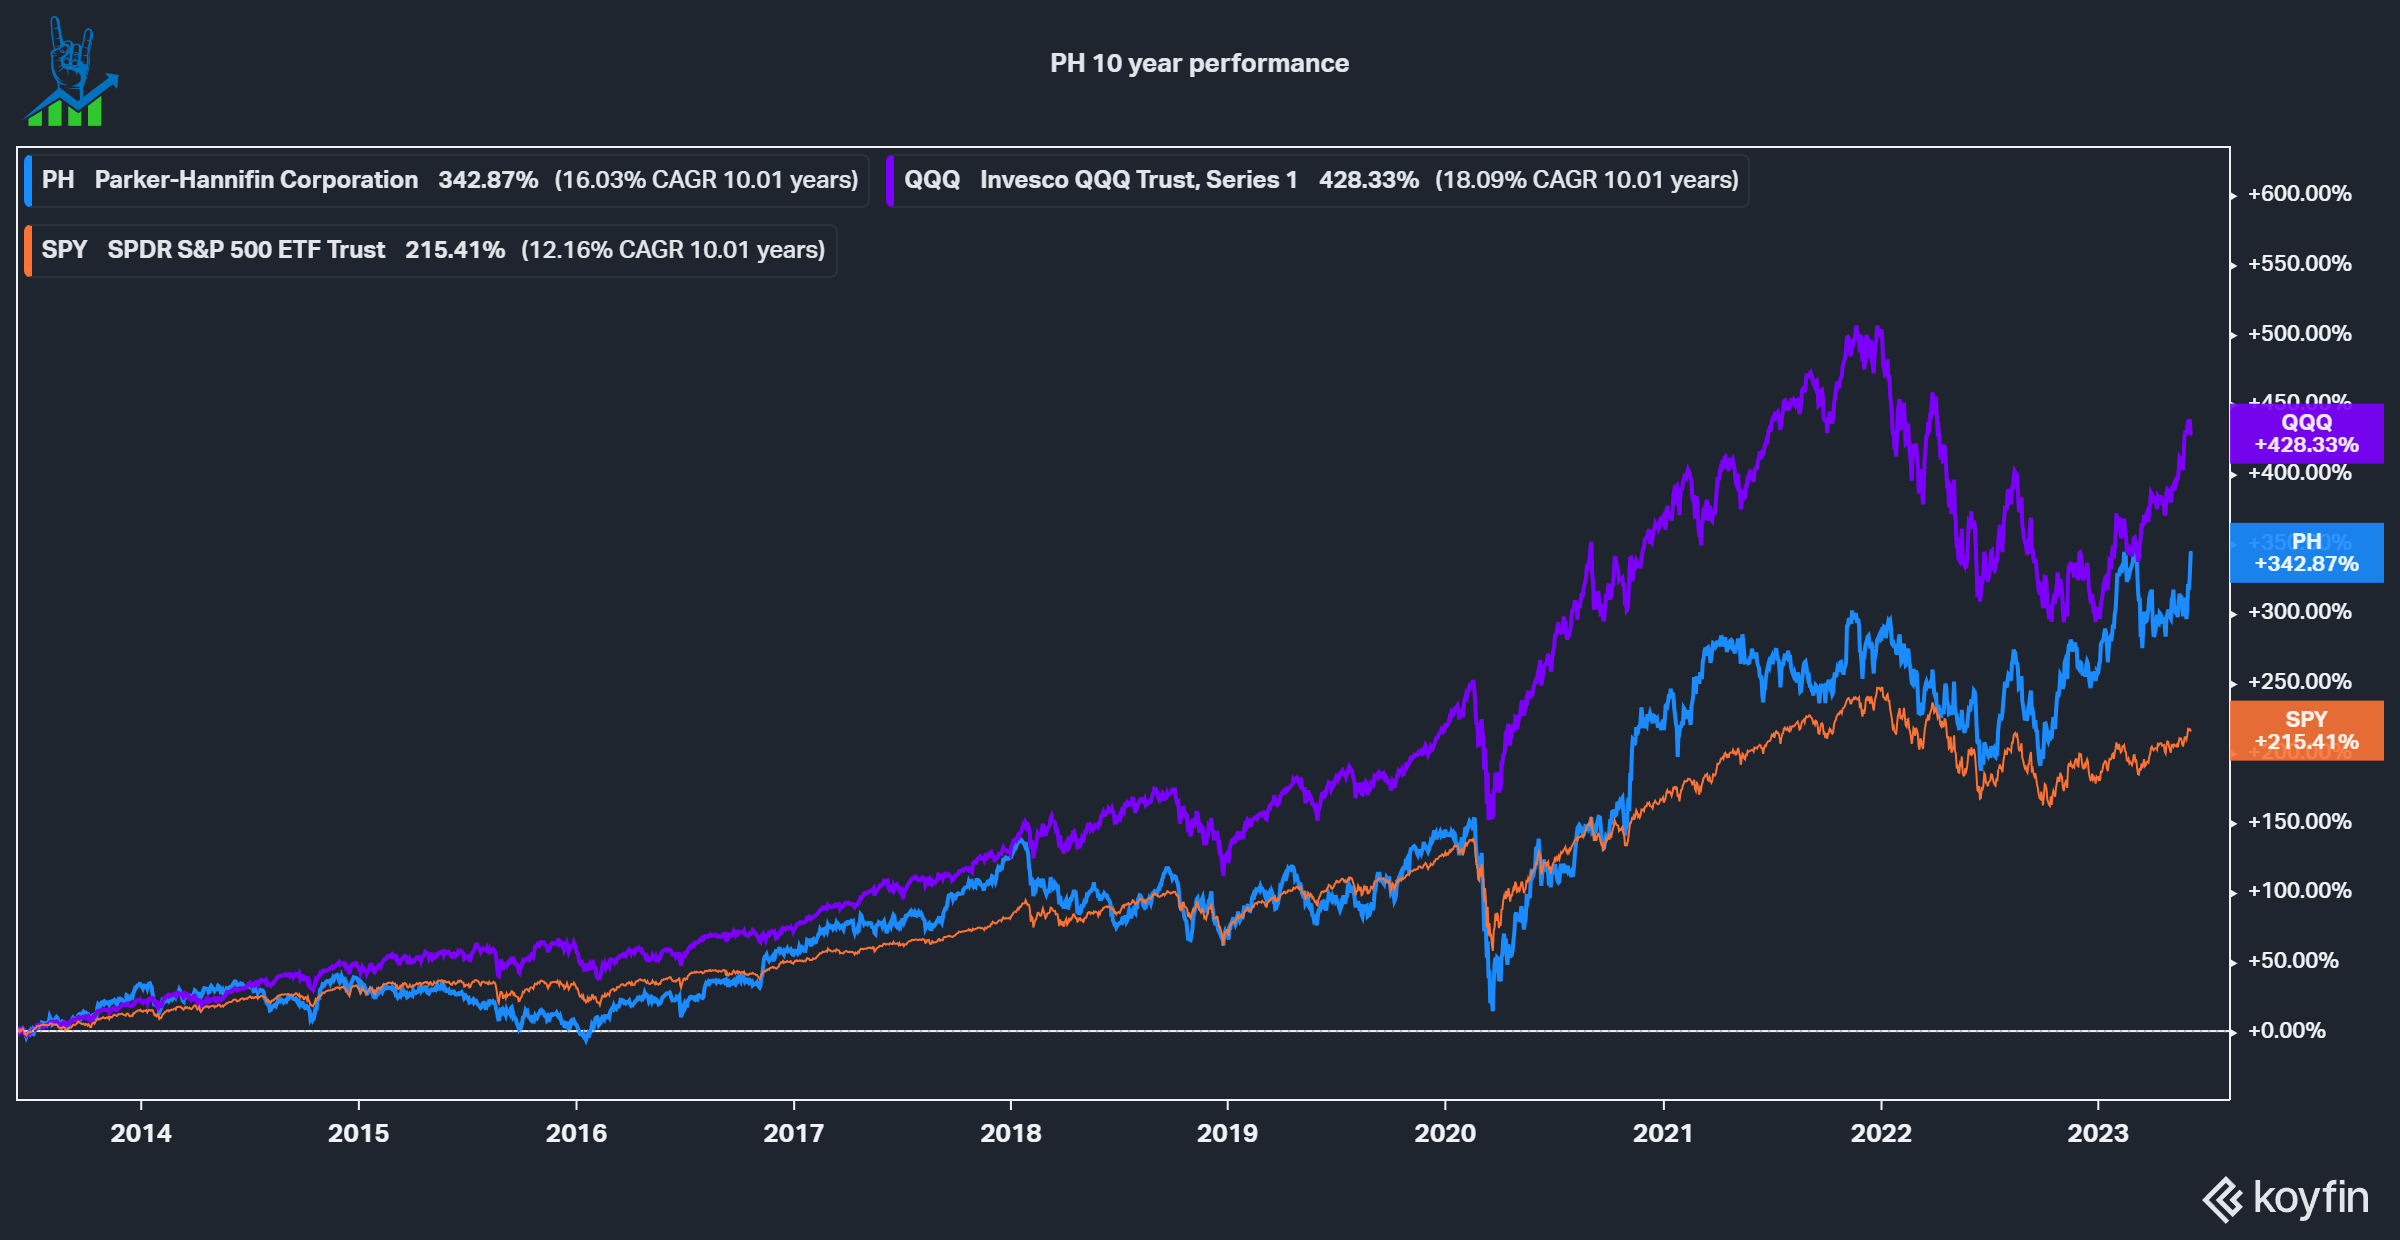
Parker-Hannifin (PH) is the global leader in the $135 billion Motion & Control industry. Over the last decade, the company has performed well, outperforming the SPY by a decent margin without too much volatility. The Nasdaq, on the other hand, has had a better return. Nonetheless, a 16% CAGR is impressive for Parker-Hannifin. Let's see if the future is as rosy as the past.
PH 10 year performance (Koyfin)
Diversified portfolio in attractive end markets
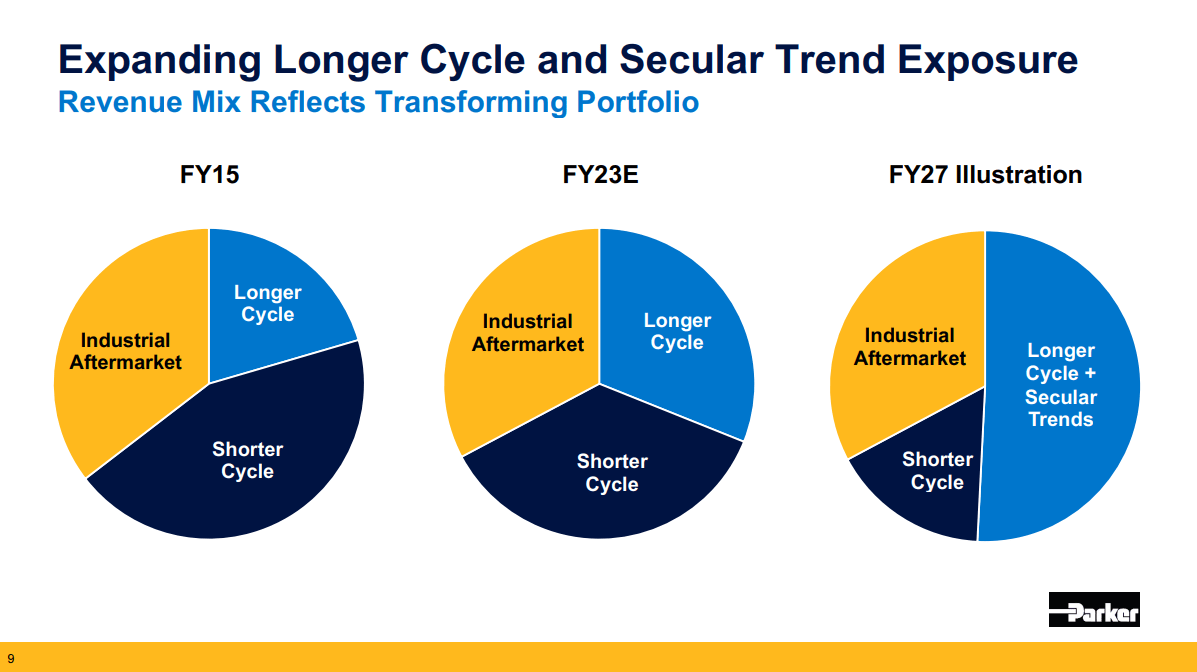
PH is diversified over various end markets like Hydraulics, Pneumatics, Electromechanical, Filtration, Fluid & Gas Handling, Process control, engineered materials and climate control. Two-thirds of revenue comes from customers who buy at least four different products from PH, and two-thirds of revenues enable clean technologies. While ESG is a very touchy topic, there is no denying that there is a transition to sustainability and a lot of money flows into enabling clean technologies. This is a tailwind for Parker because customers are likely receiving subsidies or feel other pressures to adjust their processes. Parker estimates that they have around 13% market share across the $135 billion Motion & Control market and they set the goal to reach 20% in the future. This would be an incremental $9.45 billion in sales (without assuming any growth in the market). The company sees growth opportunities, especially within Aerospace (recovering from Covid), Digitalization, Electrification and clean technologies. Over the last eight years, PH reduced its exposure to short-cycle products from 45% to 35%. Until 2027 the goal is to reduce short cycles to around 15% and achieve over 50% of sales through long-cycle and secular trend products. Industrial aftermarket remains around one-third of the business.
Expanding longer cycle and secular trend exposure (PH Investor Presentation)
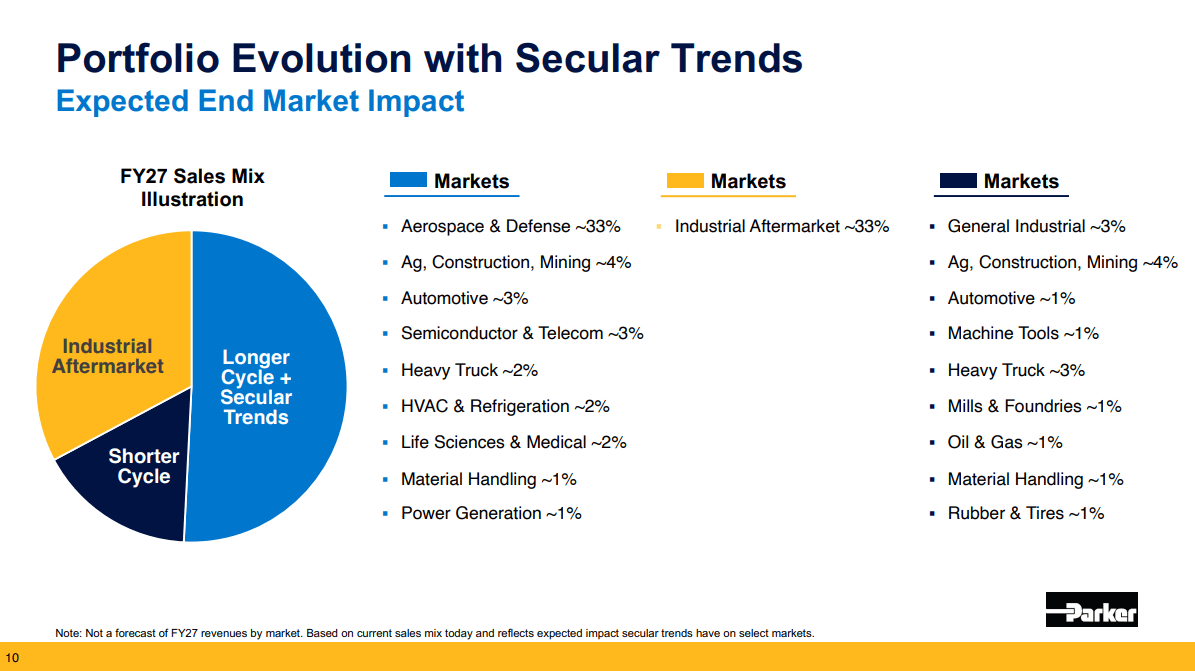
Aerospace & Defense is expected to grow to 33% of the portfolio. To achieve this goal, Parker acquired Meggit for 6.3 billion pounds. The acquisition nearly doubles Aerospace Systems Segment revenues with complementary technologies. Furthermore, Parker expects $300 million in cost synergies in FY26. Below you can see how Parker imagines its FY27 sales mix. Aerospace has some outstanding companies, such as Heico (HEI) and TransDigm (TDG), which indicate a very lucrative industry.
Portfolio Evolution with Secular Trends (PH Investor Presentation)
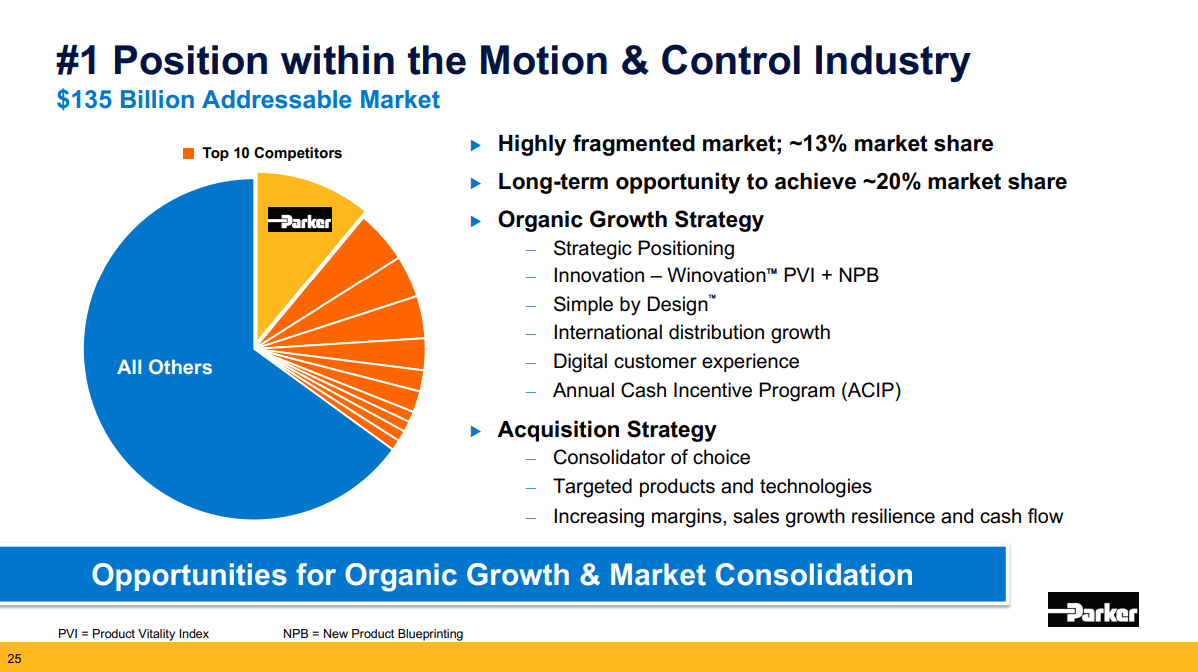
A fragmented industry
The Motion & Control Industry is very fragmented, with the largest ten players accounting for roughly 35% of the market and Parker being the number one. The company sees itself as the consolidator of choice with a good track record of M&A. Acquired companies should provide new products and technologies to enhance the portfolio to increase margins, sales growth and cash flows through synergies and the Parker Business System.
The fragmented Motion & Control industry (PH Investor Presentation)
Organic growth
Parker expects to reach around 4-6% organic growth throughout a cycle through its portfolio positioning, a culture focused on high performance, Kaizen and lean manufacturing, large distribution network and relationships. As earlier mentioned, 2/3 of revenue comes from customers using at least 4 Parker technologies, showcasing this scale advantage. Some other competitive differentiators are the decentralized business model, long product life cycles with aftermarket, low capital investment requirements and a large intellectual property portfolio. I see a small yellow flag in the IP portfolio of Parker: According to insights by Greyb , the number of patents filed and granted by PH has significantly declined over the years. The company still has over 12,000 patents, with almost 5,000 active ones, which should be monitored.
PH Patent filing and grants (Insights by Greyb)
Capital allocation
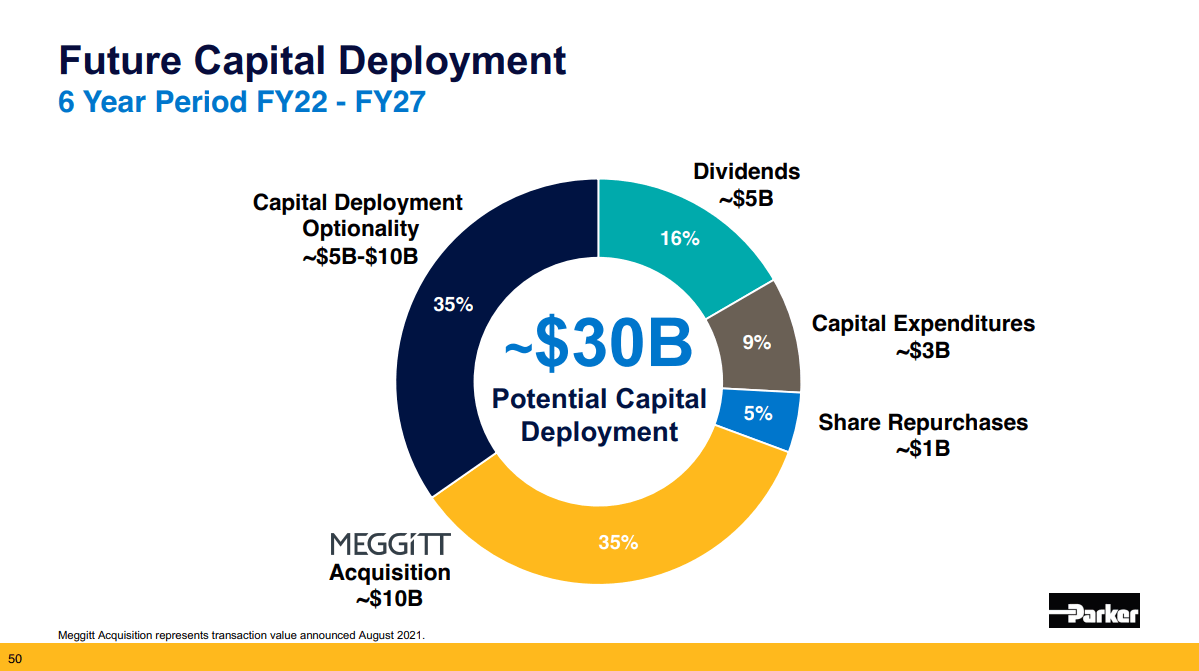
Parker is a company with high cash flows. It generated $9 billion in Free cash flows from FY16 to FY21 and expects to generate over $17 billion between FY22 and FY27. This leaves a lot of importance on Capital Allocation. Below you can see the Capital allocation plan for the following years. This does not include debt reduction, which is a focus right now. Parker has been a levered company over the last six years, with an average Net Debt/EBITDA at 2.3 times due to a few sizable acquisitions. The company aims to bring leverage to 2.0 times during FY25 and is actively paying down its debt. This got leverage from 3.6x in Q1 FY23 to 3.1x in Q3 FY23. The company is a dividend king with 67 years of increases, so the dividend is a focus and represents 16% of the expected allocation. Given Parker's track record, I like the large allocation to M&A (Meggit) and the large cushion for opportunistic deployment. Investors should monitor the ROIC of Parker. It has been hovering around the company's cost of capital (9%). A rule of thumb is that the spread between ROIC and the cost of capital should be at least 2%; this is not the case right now for Parker. A reason for this is a large amount of Goodwill: Being an acquisitive business, Parker has $10.8 billion in goodwill, almost half of the $23.2 billion total capital. This phenomenon can also be seen with other successful consolidators doing large deals, i.e., Danaher (DHR) or Thermo Fisher (TMO).
Future Capital Allocation (PH Investor Presentation)
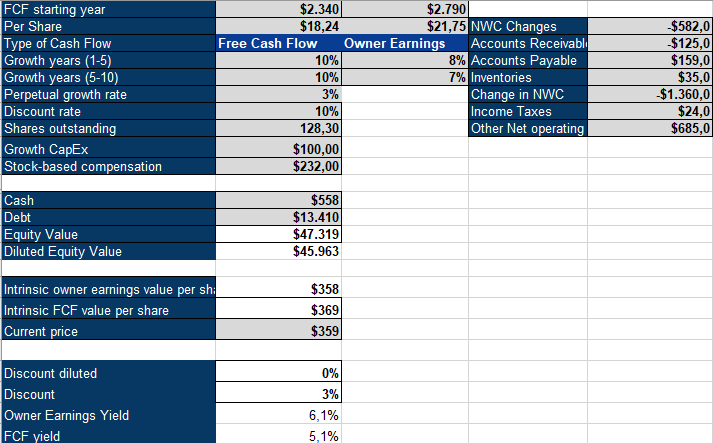
To value PH, I use an inverse DCF model using both Free Cash Flow and Owner Earnings (FCF + Growth Capex - SBC +/- NWC Changes). PH would require 8% Owner Earnings growth for five years, followed by five years of 7% growth. Over the last five years, PH increased sales by a 5% CAGR and operating cash flows by 11%. The long-term guidance of 4-6% organic sales growth also leaves an easy path to achieve 7-8% cash flow growth if we assume margin expansion and M&A.
PH Inverse DCF Model (Authors Model)
Conclusion
Parker-Hannifin is a high-quality business trading at an attractive price. The required growth of High-single-digits should be achievable guided by the continued shift towards secular growth sectors in the portfolio. I rate Parker-Hannifin a buy at these levels.
For further details see:
Parker-Hannifin: Dominating A Fragmented $135 Billion Market