RRX - PAVE: Portfolio Composition May Drive Underperformance
2023-09-10 07:39:51 ET
Summary
- Lower growth with weighted EPS CAGR of 4% on consensus YE24-YE25 estimates.
- Expensive relative to growth, with an estimated YE24 PE of 14.7x driving a PEG of 3.4x.
- Steel stocks and DE (presumably referring to John Deere) are the main drag on the portfolio.
Overview
The [[PAVE]] ETF run by Global X is focused on stocks that may see increased growth from US infrastructure investment. This includes industrial automation, electric energy and grid expansion, agricultural productivity, climate change mitigation along with industrial transportation and the raw materials to build infrastructure such as data centers, industrial buildings, roads, and bridges.
The portfolio encompasses a wide array of sectors, some clear participants in various megatrends and others that may be mature or cyclical, such as steel and railroads. PAVE is a passive fund that tracks the Indxx U.S. Infrastructure Development Index . However, it appears that Indxx provides custom indexes for fund groups such as Global X making the portfolio composition more flexible.
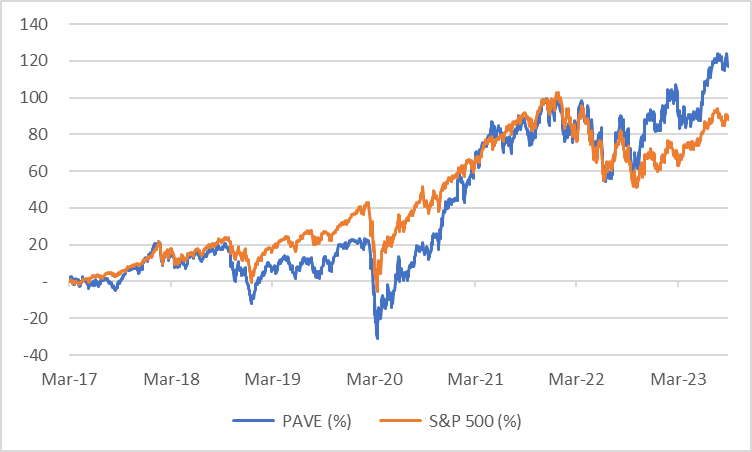
PAVE commenced trading in March 2017, it began to outperform the S&P 500 ( SP500 ) at the start of 2021 as its portfolio benefited from pandemic capacity dislocation, price increases and a rush to meet demand for almost everything. This positive performance continues into the present as its once more value-oriented focus and key trends collided to drive up valuations.
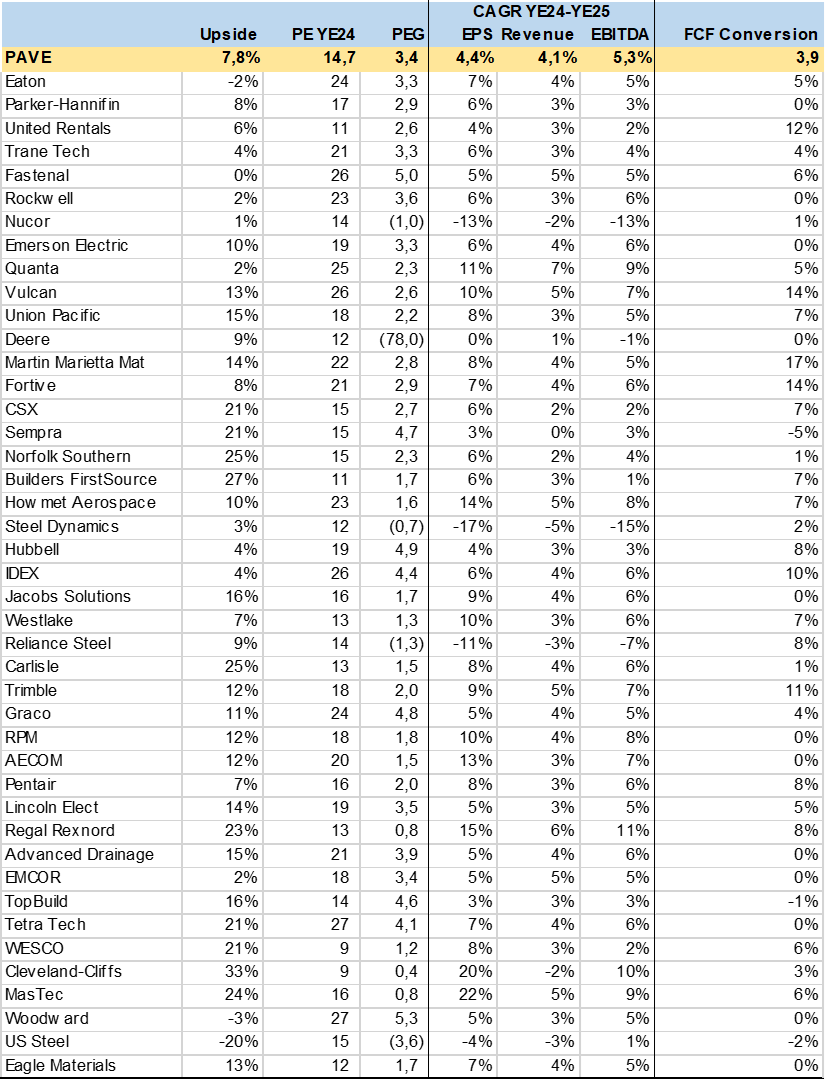
Utilizing consensus estimates, I found a weighted upside potential of 8%, EPS CAGR of 4%, YE24 PE of 14.7x with a FCF conversion of 4%. Not exactly enticing numbers.
PAVE vs SP500 Performance (Created by author with data from Capital IQ)
Looking Under the Hood
To properly gauge the ETFs potential, I conducted an analysis, based on consensus estimates, for 80% (43 stocks) of the portfolio. I used Price Target, Revenue, EBITDA, Net Debt and EPS estimates to produce growth, cashflow, and valuation metrics. The consensus, made up of many analysts, can be biased on valuation i.e., price targets, but they are generally better at forecasting. Much of this is based on company guidance and input, plus channel checks and experience. I did not factor in YE23 estimates given that many stocks are facing tough comps and the market generally looks out 6 to 12 months.
My basic screening resulted in a less than appealing portfolio with a consensus upside of 7.8% on mediocre EPS growth of 4.4% and a relatively high valuation of 14.7x YE24.
PAVE Holding Consensus Growth and Valuation (Created by author with data from Capital IQ)
PAVE Portfolio Weakness
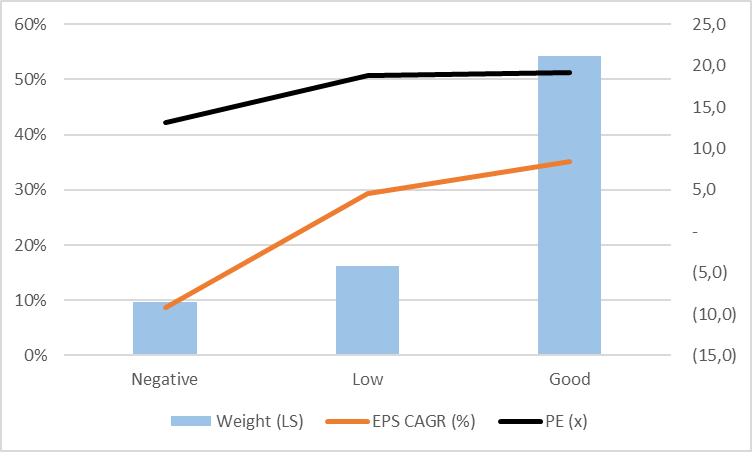
I also found that 54% of the portfolio is in faster growth stocks, with EPS CAGR over 8%. However, it appears that 16% of the portfolio has a 5% EPS CAGR while 10% of the portfolio -9% EPS CAGR. To exasperate the problem, the negative growth stocks are at a 13x PE while the low growth stocks are at 19x PE. This portfolio may have a problem in continuing to outperform the SP500.
PAVE Portfolio Valuation and Growth Composition (Created by author with data from Capital IQ)
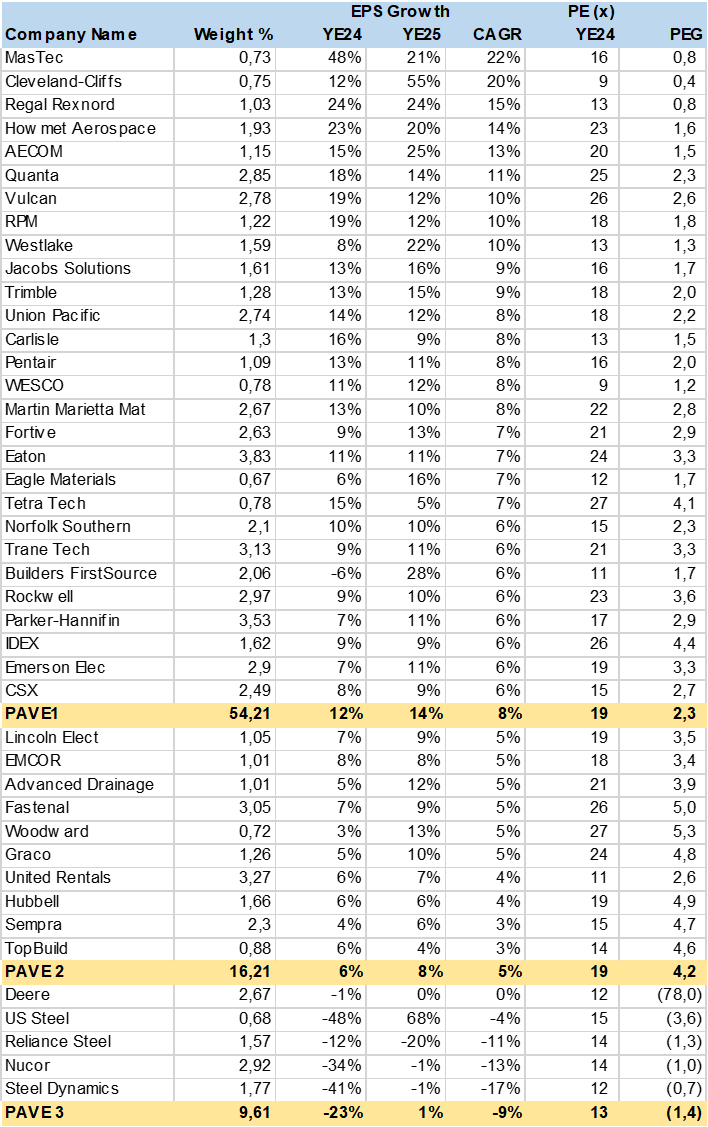
The table below highlights portfolio weak spots. I separated and aggregated stocks into three sub portfolios using EPS consensus estimates for YE24 and YE25.
- PAVE 1: EPS CAGR above 5%
- PAVE 2: EPS CAGR from 1% to 5%.
- PAVE 3: EPS CAGR 0% or negative.
The PAVE 3 section has mostly steel producers and Deere (DE) that with a -9% weighted EPS growth while the PAVE 2 section has 5% growth and 4.2x PEG, i.e., it looks expensive. Finally, the PAVE1 section of higher growth stocks is not particularly cheaper than the SP500 nor growing faster, according to the consensus estimates.
Positive outliers are MasTec ( MTZ ), Cleveland-Cliffs ( CLF ) and Regal Rexnord ( RRX ) with high growth and low valuation estimates.
PAVE Portfolio Segregation by Growth Rates (Created by author with data from Capital IQ)
Valuation
The ETF looks expensive from a bottom-up consensus view. As seen, over 20% of the portfolio has a poor consensus EPS growth outlook that is not reflected in valuation so far. PAVE vs. the SP500 and S&P 500 Industrials ( SP500-20 ) is cheaper on an absolute PE basis, but not relative to EPS growth.
Consensus estimates for SP500 are 12% EPS growth in YE24 and 10% for YE25. This brings the PEG down to 1.5x vs. over 3x for PAVE. While the SP500-20 has a next twelve-month EPS growth estimate at 18.8%. Yes, we are dealing with a wide set of variables, but this level of dispersion suggests the portfolio has structural weakness in my view.
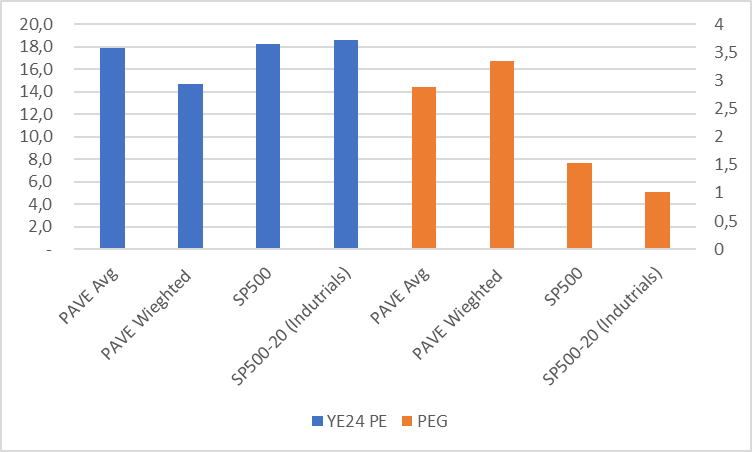
PAVE Valuation vs SP500 (Created by author with data from Capital IQ)
PAVE Portfolio Valuation by Holding (Created by author with data from Capital IQ)
Conclusion
PAVE’s US Infrastructure theme is on the right track. However, the portfolio composition falls short as it includes more mature and cyclical raw material and transport stocks that have weak or even negative EPS growth. In addition, the valuation seems stretched vs. the broader market and the industrials sector, promoting my view that it may be difficult to see further outperformance.
For further details see:
PAVE: Portfolio Composition May Drive Underperformance