CA - Picking A Winner In Single Family Rental REITs
2023-06-13 07:30:00 ET
Summary
- Single Family Rental REITs have outperformed all other REIT sectors thus far this year, and have also outperformed the S&P 500.
- Renting a house is currently much cheaper than buying a house, and the 38-42 year old renter cohort will grow faster than any other 5-year segment over the next decade.
- This article examines five Single Family Rental REITs to identify the best performer over the next 2-5 years, using liquidity ratio, growth in funds from operations (FFO), growth in total.
Thus far this year, SFR (Single Family Rental) REITs have been the highest-performing of all the REIT sectors. With a total return of 15.31% YTD, they are also outperforming the S&P 500, at 12.41%.
Hoya Capital Income Builder
Tightening credit conditions over the past year and a half have greatly slowed house buying, leaving more people looking for homes to rent. Meanwhile, household formation has picked up, which adds up to greater rental demand and higher rents.
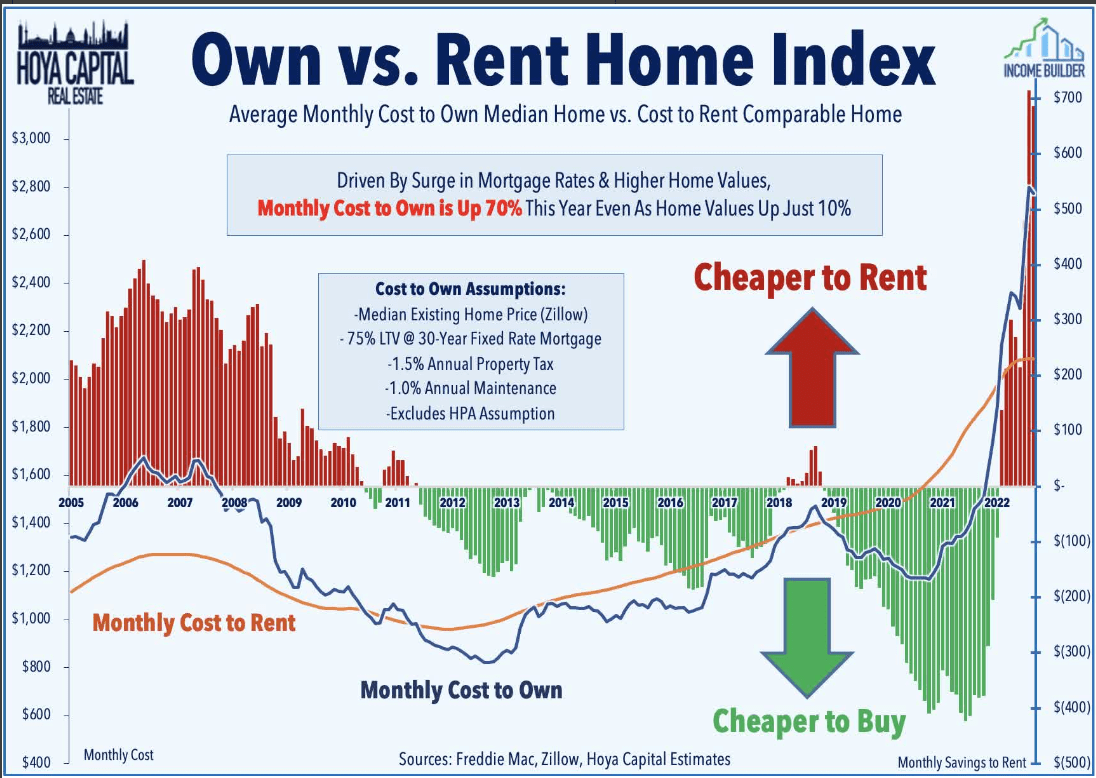
Hoya Capital has developed a new metric called the Own versus Rent Home Index, which shows the following startling conclusion:
the monthly cost of owning and renting was nearly identical at the start of the year, [but] owning a home now costs $700 more per month than renting the same home. This differential is almost $300 higher than at any time since the turn of the century, and households now hold a historically high preference for renting over buying.
With debt ratios in the low-20's, [[AMH]] and [[INVH]] are well-positioned to aggressively acquire smaller portfolios, as more highly-levered small-time landlords seek an exit. Still, SFR REITs own fewer than 5% of the rental houses in the U.S.
Back in December, Hoya Capital had this to say in its SFR sector report :
SFR REITs enter this . . . period on solid footing, benefiting from historically favorable Buy vs. Rent economics and double-digit rates of "embedded" mark-to-market rent growth that will be realized over the coming quarters even amid a broader economic slowdown.
Nationwide, the average single-family monthly rent is $1,100 per month , but according to Hoya Capital, REIT portfolios, with their higher-quality properties, average around $1,800 per month, with homes averaging about 2,000 square feet. SFR REITs also concentrate in relatively high-value suburban markets and their tenant credit profile is far better than the national averages. SFR REIT tenant households average $85k-130k in annual income - vastly better than the average renter household (about $36k) - and average an income-to-rent ratio of around 5x. The SFR head-of-household average 38-42 years old, an age cohort that will grow faster than any 5-year segment over the next decade.
This article examines liquidity, revenue growth, size, volatility, dividend yield, dividend growth, and pricing considerations for five Single Family Rental REITs, to single out the one company best poised to deliver outperformance over the next 2 to 5 years.
What the numbers say
My FROG-hunting approach to REIT investing relies on just 7 numbers:
- Liquidity ratio (Assets/Liabilities)
- Growth in Funds From Operations (FFO)
- Growth in Total Cash From Operations (TCFO)
- Growth in Dividends
- Market Cap
- Growth in share price
- Volatility
Hey, what is a FROG anyway?
FROG stands for Fast Rate of Growth. FROG REITs are significant , because they usually outperform the market in total return (Gain + Yield). The criteria for identifying a FROG are as follows:
- Positive price gain over the past 3 years
- Liquidity Ratio >= 1.66 (preferably >=2.00)
- FFO and TCFO Growth rate >= 10% (preferably >=20%)
- Market cap of at least $1.4 billion.
- Modeled Return greater than the return posted by the Vanguard Real Estate ETF ( VNQ ) over the past 3 years.
Modeled Return is my own Rube Goldberg invention that combines price gain, dividend yield, dividend growth rate, and volatility to arrive at one number, for comparison to VNQ.
The opposite of a FROG is a COW (Cash Only Wanted), which is a company notable for its prodigious stream of cash dividends and plodding or mediocre revenue growth.
How do the candidates stack up?
Here are the five U.S. Single Family Rental REITs:
- Invitation Homes ( INVH )
- American Homes 4 Rent ( AMH )
- Tricon Residential ( TCN )
- Bluerock Homes ( BHM )
- NexPoint Diversified ( NXDT )
First we screen on Liquidity, FFO growth rate per share, TCFO growth rate, and Market Cap, using the criteria above.
| Ticker |
| Liquidity |
| FFO Growth % |
| TCFO Growth % |
| Market Cap |
| AMH |
| 8.07% |
| 2.49% |
| 53.3% |
| 8.97 |
| 27.6 |
| 16.70 |
| INVH |
| 6.27% |
| 2.99% |
| 19.2% |
| 5.06 |
| 29.2 |
| 10.94 |
| VNQ |
| (-0.26)% |
| 4.09% |
| 16.7% |
| 6.50 |
| 25.6 |
| 6.24 |
Source: Hoya Capital Income Builder, MarketWatch.com, and author calculations
Note: Modeled Return is not an attempt to predict total return for the coming year, but rather a measuring stick to identify companies that will outperform. The wider the margin by which a company's Modeled Return exceeds that of the VNQ, the better its chances of outperforming in the coming year.
Dividend Score projects the company's dividend 3 years from now on shares bought today, assuming no change in the rate of dividend growth.
The Single-Family Rental business is capital-intensive, so initial yields tend to be low, but these companies quickly make up the difference with robust to spectacular dividend hikes. AMH has been on an especially torrid pace over the past 3 years, raising its dividend an average of 53.3% per year. Coupled with its superior share price appreciation, AMH now owns a more comfortable lead over INVH.
On to the finals: Future Growth
So far, our growth metrics have been backward-looking. Now we sort our candidates by projected FFO growth for 2023 and 2024. These analyst consensus figures (a.k.a. educated guesses) are based mostly on company guidance. Since next year's FFO is much easier to predict than two years down the road, I give double the weight to expected growth rate for 2023 versus the projected rate for 2024.
| Ticker |
| FFO '22 |
| FFO '23* |
| % incr |
| FFO '24* |
| % incr |
| Incr score |
| AMH |
| 8.97 |
| 60% |
| A |
| 21.7 |
| (-16.3)% |
| INVH |
| 5.18 |
| 60% |
| B+ |
| 19.3 |
| (-20.3)% |
Source: Author's calculations, Seeking Alpha Premium, and Hoya Capital Income Builder
From a value investor standpoint, you get a slightly higher initial yield at a slightly better price from INVH.
From a FROG hunter's standpoint, AMH has the much higher modeled return, grows its dividend faster, and runs INVH a close race on future growth and value.
One final point to bear in mind: INVH seems to cut corners in it build-to-rent portfolio, and has been overly aggressive in charging late fees , resulting in nagging lawsuits that cut into the company's profits and cloud its future.
When FROG hunting for total return, rather than milking COWs (Cash Only Wanted) for dividend cash flow, Price/FFO ratio doesn't work the way conventional wisdom says it does. Meaningful research by Hoya Capital has shown that:
splitting the REIT universe into thirds, our analysis indicates that the "cheapest" REITs, as measured by FFO per share multiples, have persistently underperformed while the more expensive third of REITs have delivered outperformance by roughly 2.8% per year over the past decade.
Thus, the slightly richer valuation of AMH is actually a point in its favor, from a FROG hunter's perspective.
May I have the envelope, please?
It is a photo finish. However, because I am a FROG hunter, I am giving the nod to . . .
American Homes 4 Rent
Value investors (a.k.a. COWhands) might prefer . . .
Invitation Homes
As always, however, the opinion that matters most is yours.
For further details see:
Picking A Winner In Single Family Rental REITs