XOM - Pioneer Natural Resources: A Peer-Leading Margins Permian Producer
2023-08-22 06:19:27 ET
Summary
- Pioneer Natural Resources reported adjusted quarterly earnings of $4.49 per share, beating expectations, but total revenues were lower than expected.
- The company announced a lower dividend payment of $1.84 per share for the third quarter, down significantly from the prior quarter.
- Natural gas and oil prices have declined, leading to a decrease in free cash flow.
- I recommend buying PXD between $235.2 and $232.5, with possible lower support at $227.5. However, waiting below $229 to buy larger lots is prudent.
Introduction
Pioneer Natural Resources Company (PXD) is one of the largest independent E&P companies in the United States.
The company produces exclusively in the Permian Basin and owns extensive acreage there. Specifically, the company holds a deep inventory of high-quality locations in the Midland Basin, tier 1 & 2. After Chevron Corporation ( CVX ) and ConocoPhillips ( COP ), Pioneer is the third-largest oil producer in the Permian basin. The company said low LOE, G&A, and interest expenses drive the peer-leading margins.
On August 1, 2023, Pioneer Natural Resources reported its 2Q23 results.
Note: I have followed PXD quarterly since 2022. This new article is a quarterly update of my article published on July 17, 2023.
1 - 2Q23 Highlights and Commentary
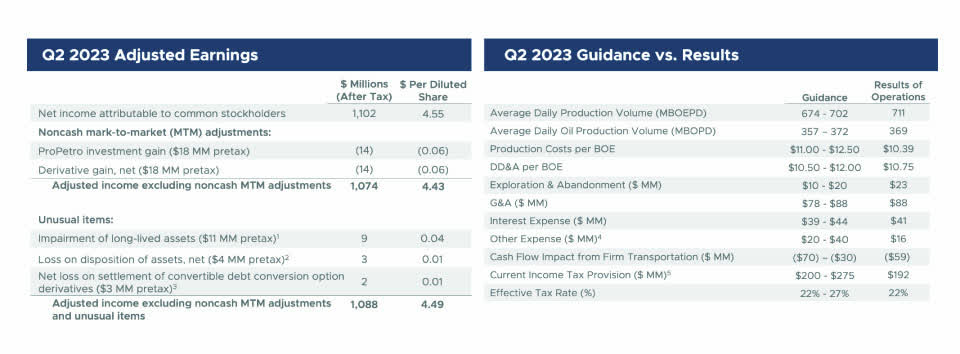
Pioneer Natural Resources came out with adjusted quarterly earnings of $4.49 per share in 2Q23 , beating analysts' expectations, compared to earnings of $9.36 a year ago.
Total quarterly revenues were $4,599 million, missing expectations, compared to $6,920 million in 2Q22.
PXD 2Q23 Highlights (PXD Presentation)
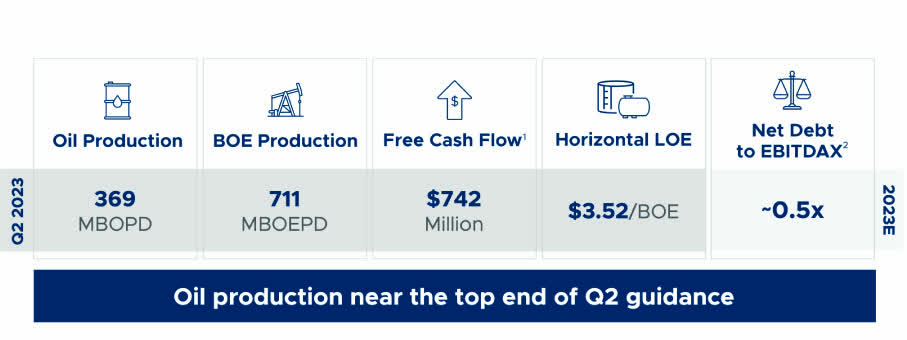
The better-than-expected quarterly adjusted earnings were primarily due to higher oil-equivalent production volumes reaching 710.678K Boepd . However, the increase was partly offset by lower realizations of commodity prices with a price per Boe of $46.03 compared to $79.31 in 2Q22.
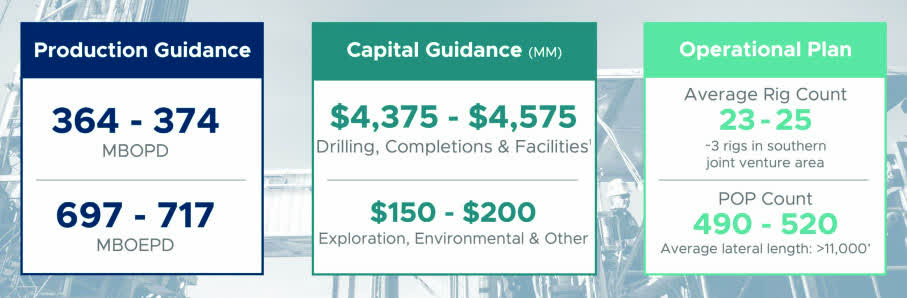
The company improved production guidance in 2023 to between 697K Boepd and 717K Boepd with oil production of 364K and 374K Boepd. The Capex is expected to be $4,375 and $4,575 million.
PXD 2023 Guidance (PXD Presentation)
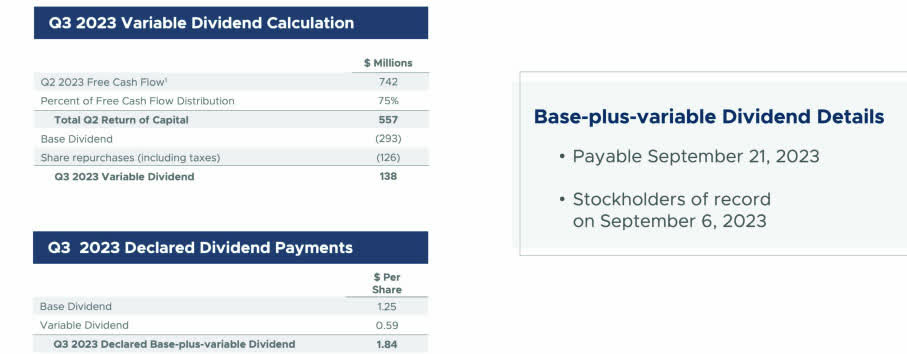
For the second quarter of 2023, Pioneer announced a total dividend payment of $1.84 per share of common stock, which includes a variable dividend of $0.59 per share and a base dividend of $1.25. It is a significant decrease in dividends from $3.34 per share in 1Q23.
PXD 3Q23 Dividend (PXD Presentation)
One positive is the recent July rally in oil prices, which pushed the company's stock to near-record prices. However, August may see some retracement due to concerns about China's economy. On August 18, 2023, Reuters said:
Oil prices rose about 1% on Friday on signs of slowing U.S. output, but both crude benchmarks also ended their longest weekly rally of 2023 on mounting concerns about global demand growth.
This week, however, oil prices dropped about 2% from last week, as a worsening property crisis in China added to concerns about the country's sluggish economic recovery and reduced investors appetite for risk across markets.
Note: My previous rating on PXD was neutral after the stock price increased significantly due to a potential takeover from Exxon Mobil ( XOM ), which has not materialized.
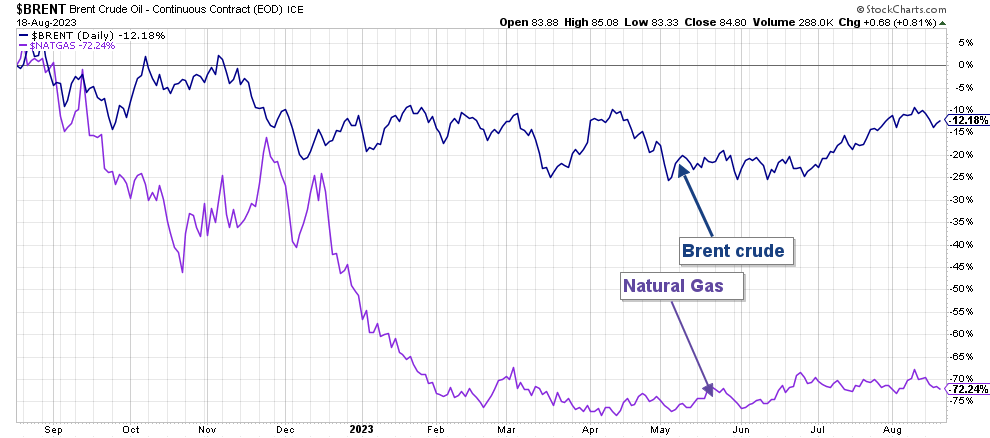
Following oil prices, PXD retraced from its high in mid-April 2023 but turned bullish again in July. However, oil prices have decreased a little lately, showing some exhaustion lately (see chart below).
Natural gas prices are down 62% on a one-year basis, while oil prices are down 20% . See the chart below:
PXD 1-Year Chart Brent and NG Price (Fun Trading StockCharts)
One important negative issue for oil stocks is the "sluggish Chinese economic data coupled with fears that Beijing's unexpected cut in key policy rates was not sufficiently substantial to rejuvenate the country's sputtering post-pandemic recovery".
Thus, PXD looks a bit overvalued based on the commodity prices reaching a strong resistance and third-quarter uninspiring guidance.
The company indicated that it is tightening its CapEx and warned of lower drilling and completions activity in coming months, impairing its forward free cash flow.
Pioneer reduced its 2023 budget, including drilling and completions, by $125 million to $4,375 million to $4,575 million. Finally, PXD anticipates placing only 490 to 520 wells on production, down from 500 to 530 indicated in April.
Thus, I expect a neutral to negative third quarter of 2023 results despite the anticipated solid oil equivalent production, which may signal some possible stock price retracement in the coming weeks.
I recommend using any upticks to take short-term profit LIFO.
2 - Stock Performance And Commentary
PXD is nearly flat on a one-year basis (-2%). However, it underperformed EOG (+10%), a comparable company.
I strongly recommend reading my article on EOG Resources, published on August 7, 2023, by clicking here.
Pioneer Resources - Financial Table 2Q23 - The Raw Numbers
| Pioneer Natural Resources |
| 2Q22 |
| 3Q22 |
| 4Q22 |
| 1Q23 |
| 2Q23 |
| Revenues in $ Million |
| 7,005 |
| 6,057 |
| 5,174 |
| 4,597 |
| 4,560 |
| Total Revenues + other in $ Million |
| 6,920 |
| 6,093 |
| 5,108 |
| 4,541 |
| 4,599 |
| Net Income in $ Million |
| 2,371 |
| 1,984 |
| 1,481 |
| 1,222 |
| 1,102 |
| EBITDA $ Million |
| 3,681 |
| 3,164 |
| 2,562 |
| 2,286 |
| 2,143 |
| EPS diluted in $/share |
| 9.30 |
| 7.93 |
| 5.98 |
| 5.00 |
| 4.55 |
| Operating cash flow in $ Million |
| 3,221 |
| 2,945 |
| 2,598 |
| 2,314 |
| 1,713 |
| CapEx in $ Million |
| 917 |
| 972 |
| 1,114 |
| 1,180 |
| 1,240 |
| Free Cash Flow in $ Million |
| 2,304 |
| 1,973 |
| 1,484 |
| 1,134 |
| 473 |
| Cash and cash equivalent $ Million |
| 3,252 |
| 1,822 |
| 1,204 |
| 1,311 |
| 228 |
| Total Debt in $ Million |
| 5,693 |
| 5,214 |
| 4,904 |
| 5,908 |
| 5,321 |
| Dividend per share in $ |
| 7.38 |
| 8.57 |
| 5.58 |
| 3.34 |
| 1.84 |
| Shares outstanding (diluted) in Millions |
| 254 |
| 250 |
| 249 |
| 244 |
| 242 |
| Oil Production |
| 2Q22 |
| 3Q22 |
| 4Q22 |
| 1Q23 |
| 2Q23 |
| Oil Equivalent Production in K Boep/d continuing operations) |
| 642.844 |
| 656.582 |
| 661.573 |
| 680.440 |
| 710.678 |
| Global Natural gas price ($/MMBtu) |
| 6.72 |
| 7.58 |
| 4.98 |
| 3.79 |
| 1.81 |
| Price per $/Boe |
| 79.31 |
| 69.93 |
| 57.76 |
| 51.69 |
| 46.03 |
Source: PXD press release.
Analysis: Revenues, Earnings Details, Free Cash Flow, Debt, An Oil & Gas Production
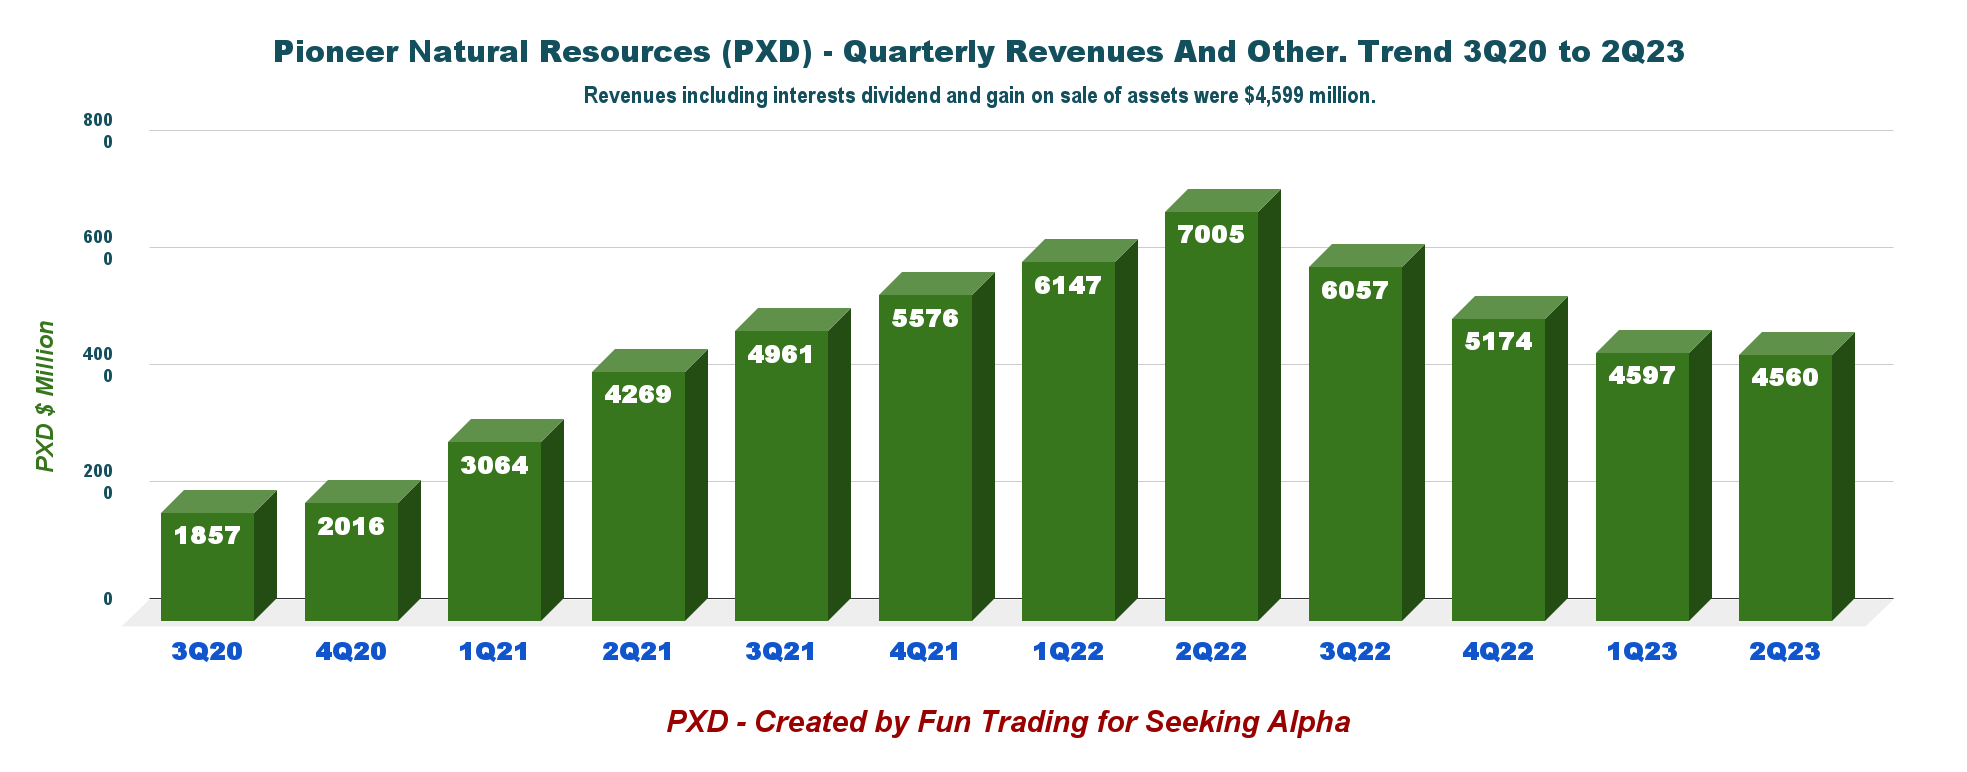
1 - Total Revenue and Others was $4,560 million in 2Q23
PXD Quarterly Revenues History (Fun Trading)
Note: Revenues from oil and gas and others were $4,599 million in 2Q23.
Total Revenues were $4,560 million in 2Q23. Pioneer Natural Resources reported a net income of $1,102 million , or $4.55 per diluted share, for the second quarter of 2023, compared to $2,371 million or $9.30 in 2Q22.
The net cash provided by continuing operations activities in 2Q23 was $1,713 million, compared with $3,218 million in 2Q22.
Below are the 2Q23 Production and Free Cash Flow highlights from the Presentation:
PXD 2Q23 Production and FCF (PXD Presentation)
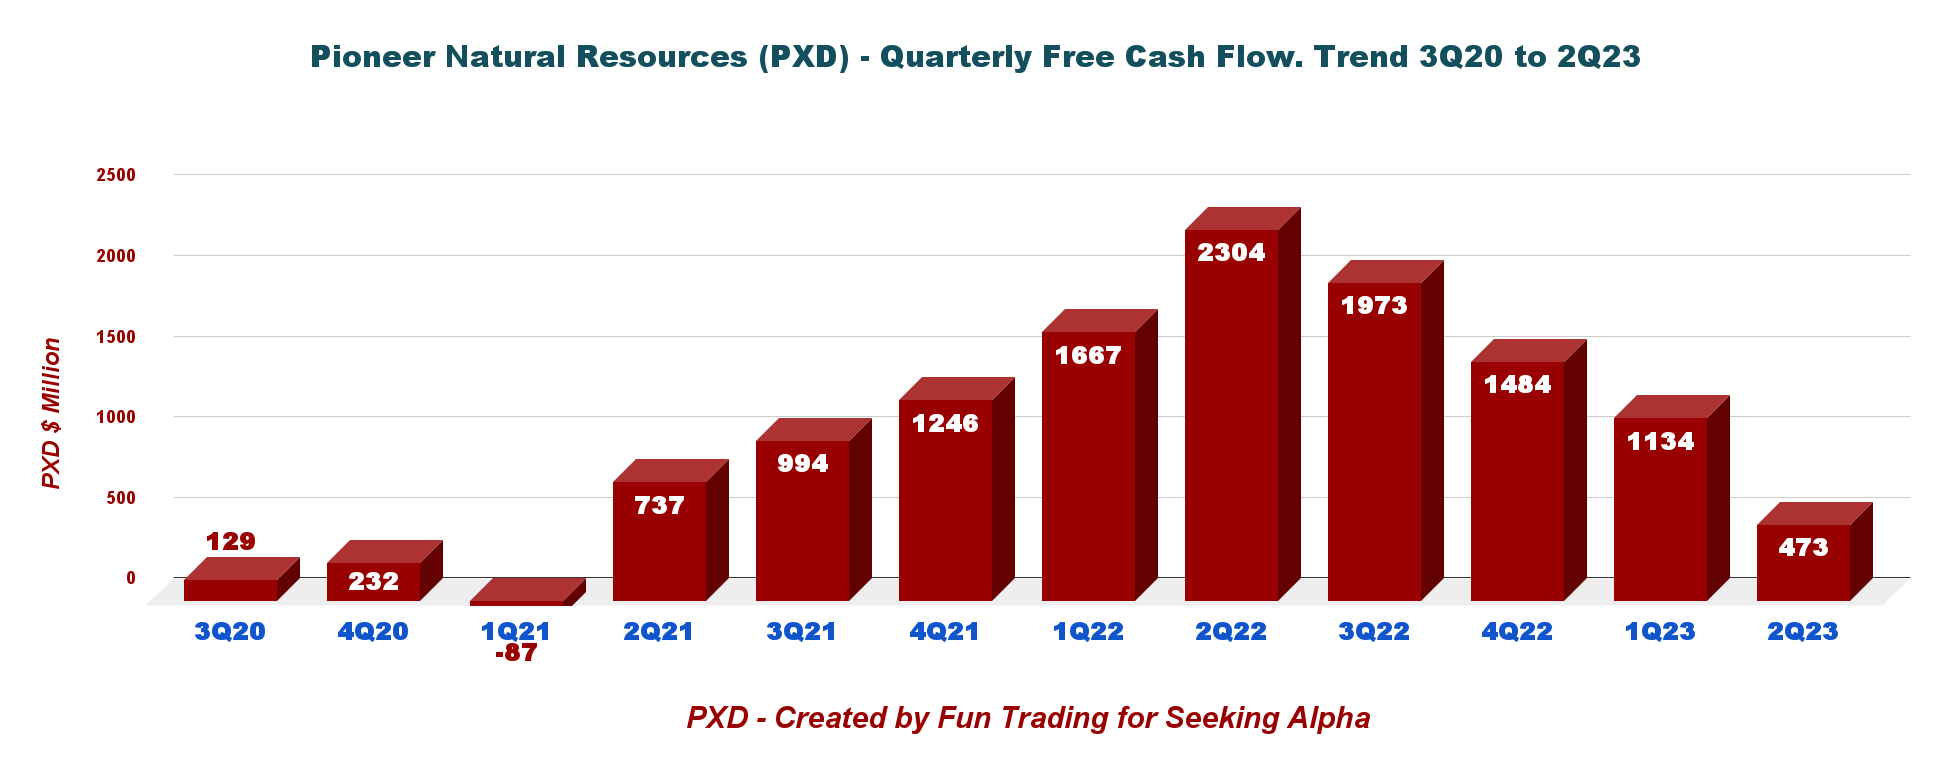
2 - Free Cash Flow was $473 million in 2Q23
PXD Quarterly Free Cash Flow History (Fun Trading) The generic free cash flow was $473 million in 2Q23. The trailing 12-month free cash flow is $4,565 million.
For the second quarter of 2023, the Company's Board of Directors (Board) has declared a quarterly base-plus-variable dividend of $1.84 per share, comprised of a $1.25 base dividend and a $0.59 variable dividend payable during 3Q23. The second quarter dividend represents a forward dividend yield of 3.10%.
Also, Pioneer Resources has an ongoing $4 billion share buyback program. PXD bought back $124 million worth of shares in 2Q23, representing 0.6 million shares.
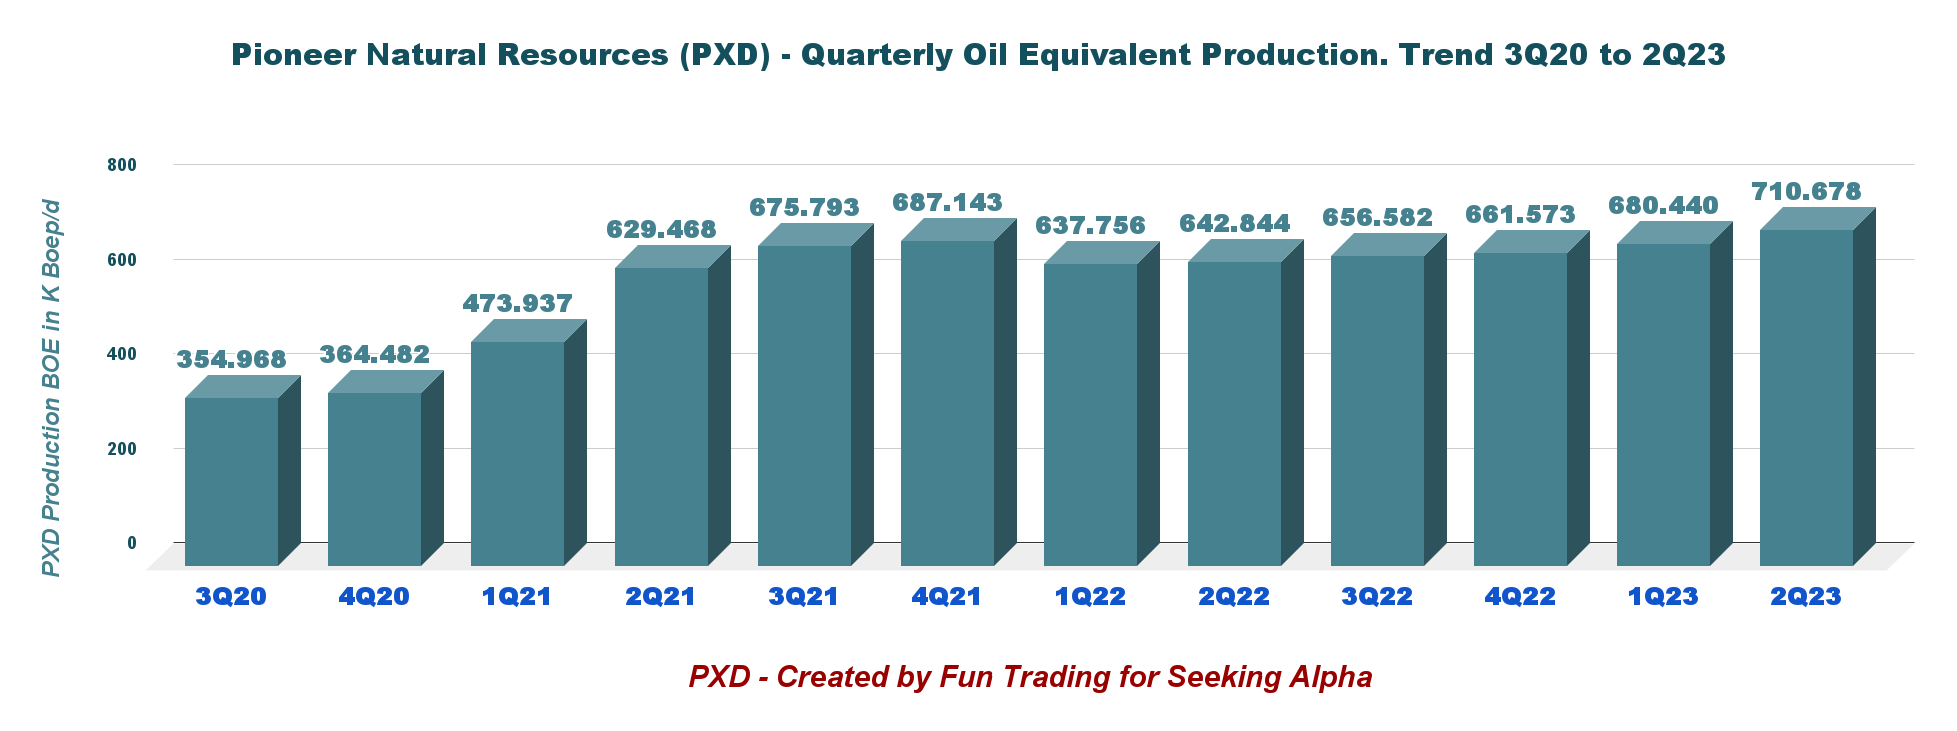
3 - Production was a record of 710.378k Boep/d in 2Q23
3.1 - Quarterly Oil Equivalent Production
PXD Quarterly Oil Equivalent Production History (Fun Trading)
The company produced a record 710.678K Boepd in the second quarter, comprising 77.4% of liquids (Oil+NGL). Production comes from the Permian Basin.
Production costs, including taxes, averaged $10.39 per barrel of oil equivalent , progressing from $12.81 per BOE in 2Q22.
3.2 - Equivalent production is spread between oil, NGL, and natural gas.
PXD Quarterly Production per Segment 2Q22 versus 2Q23 (Fun Trading)
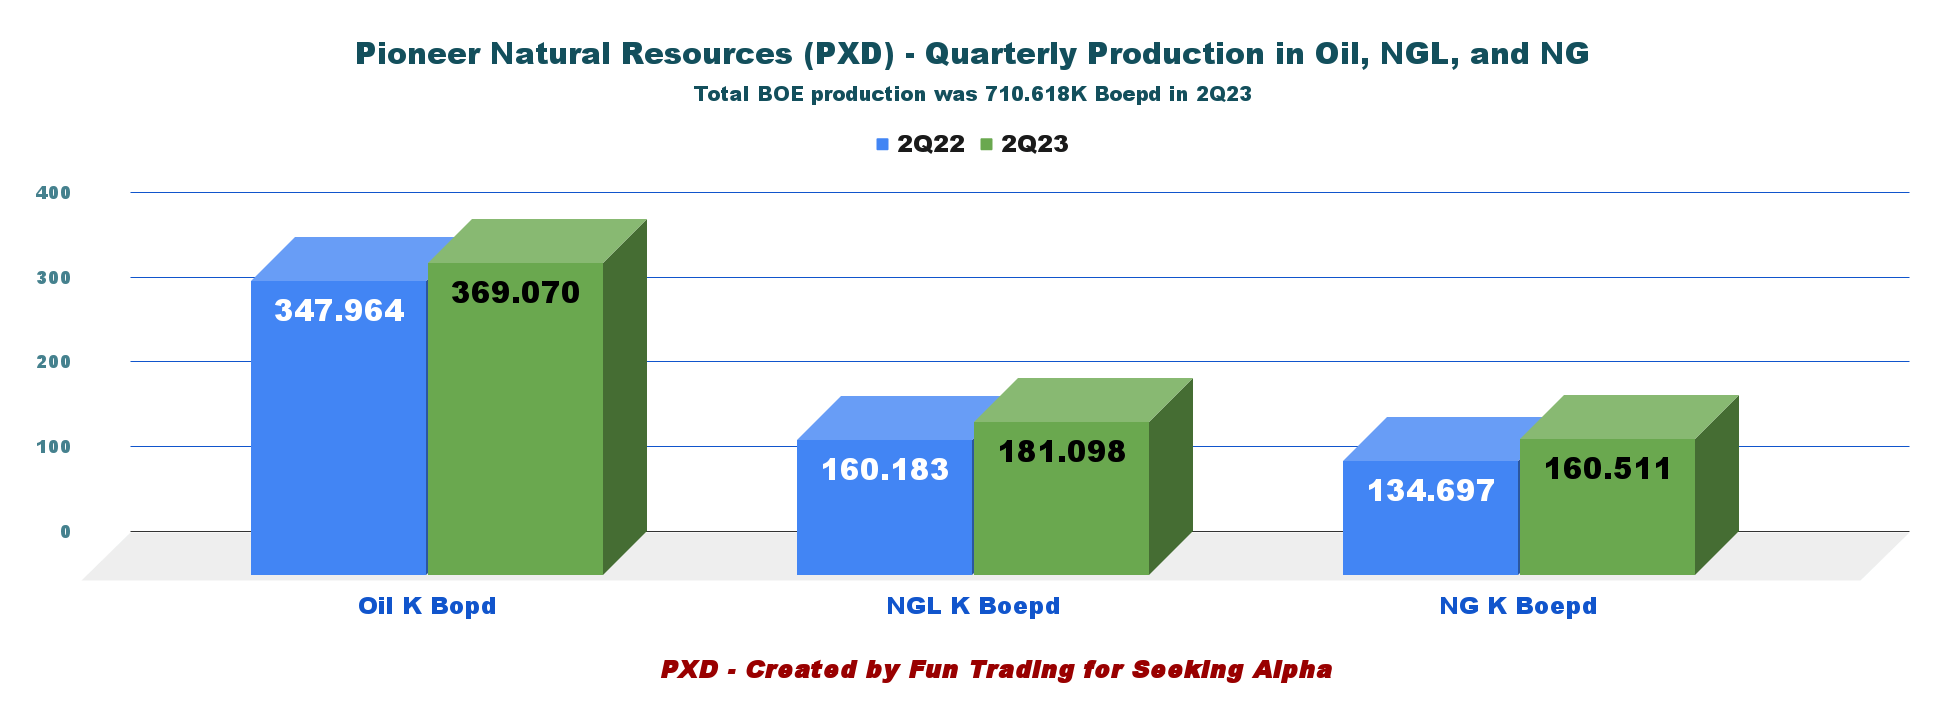
As we can see, production progressed significantly YoY.
3.3 - Realized prices per Boe
- The oil price is $72.90 per barrel.
- The NGL price is $22.43 per barrel
- The NG price is $1.81 per barrel
- The price per BOE was $46.03 in 2Q23.
PXD Quarterly Oil NGL, NG Prices History (Fun Trading)
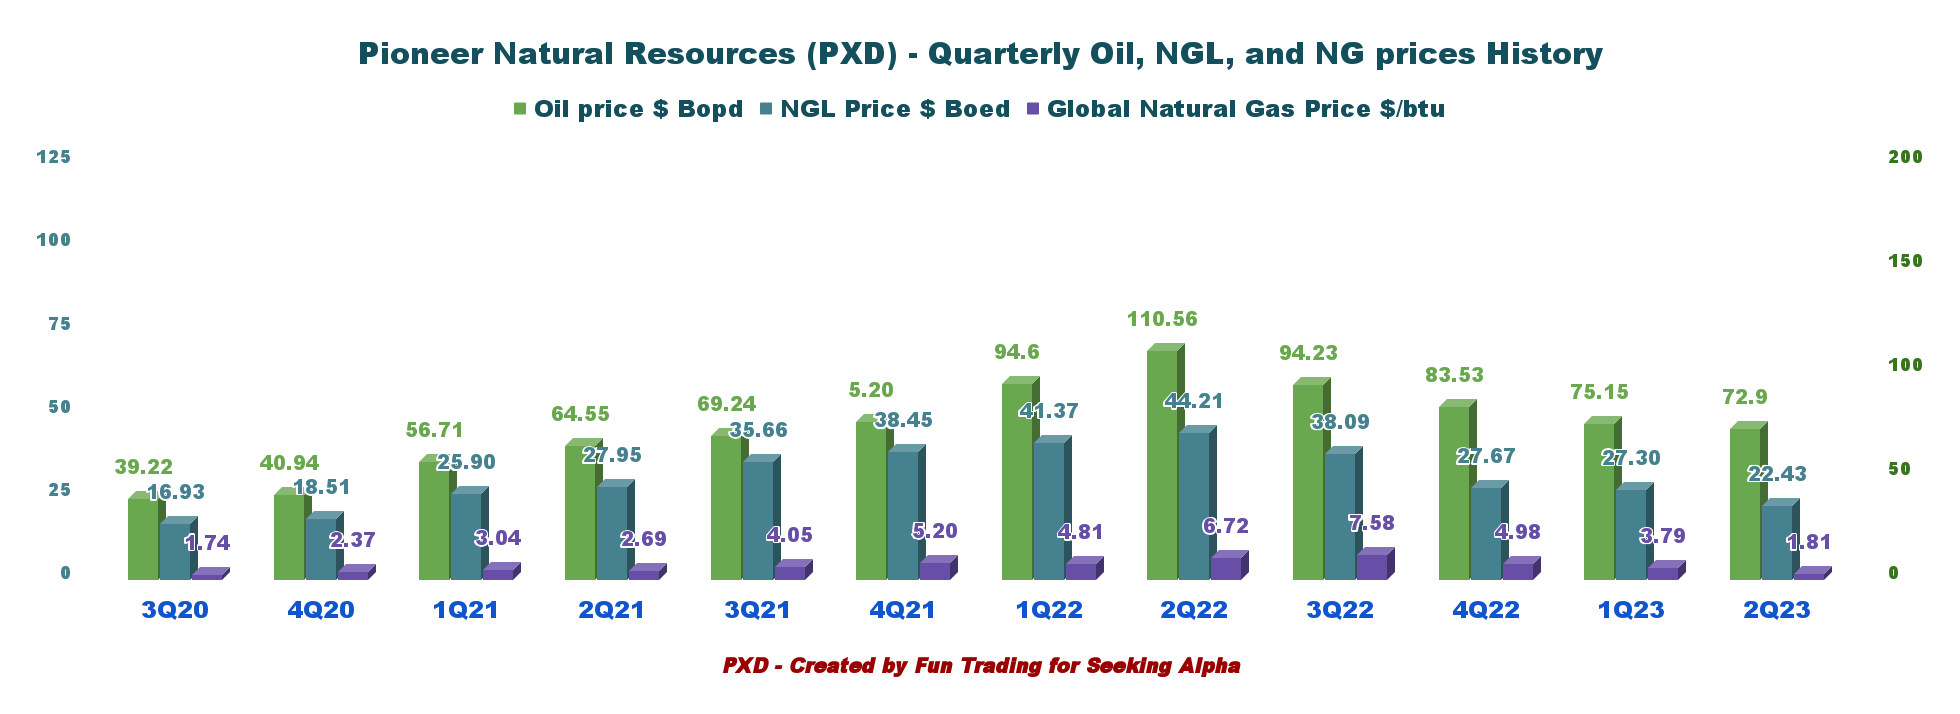
Prices of oil, NGL, and NG have been sliding since 2Q22, and free cash flow decreased accordingly.
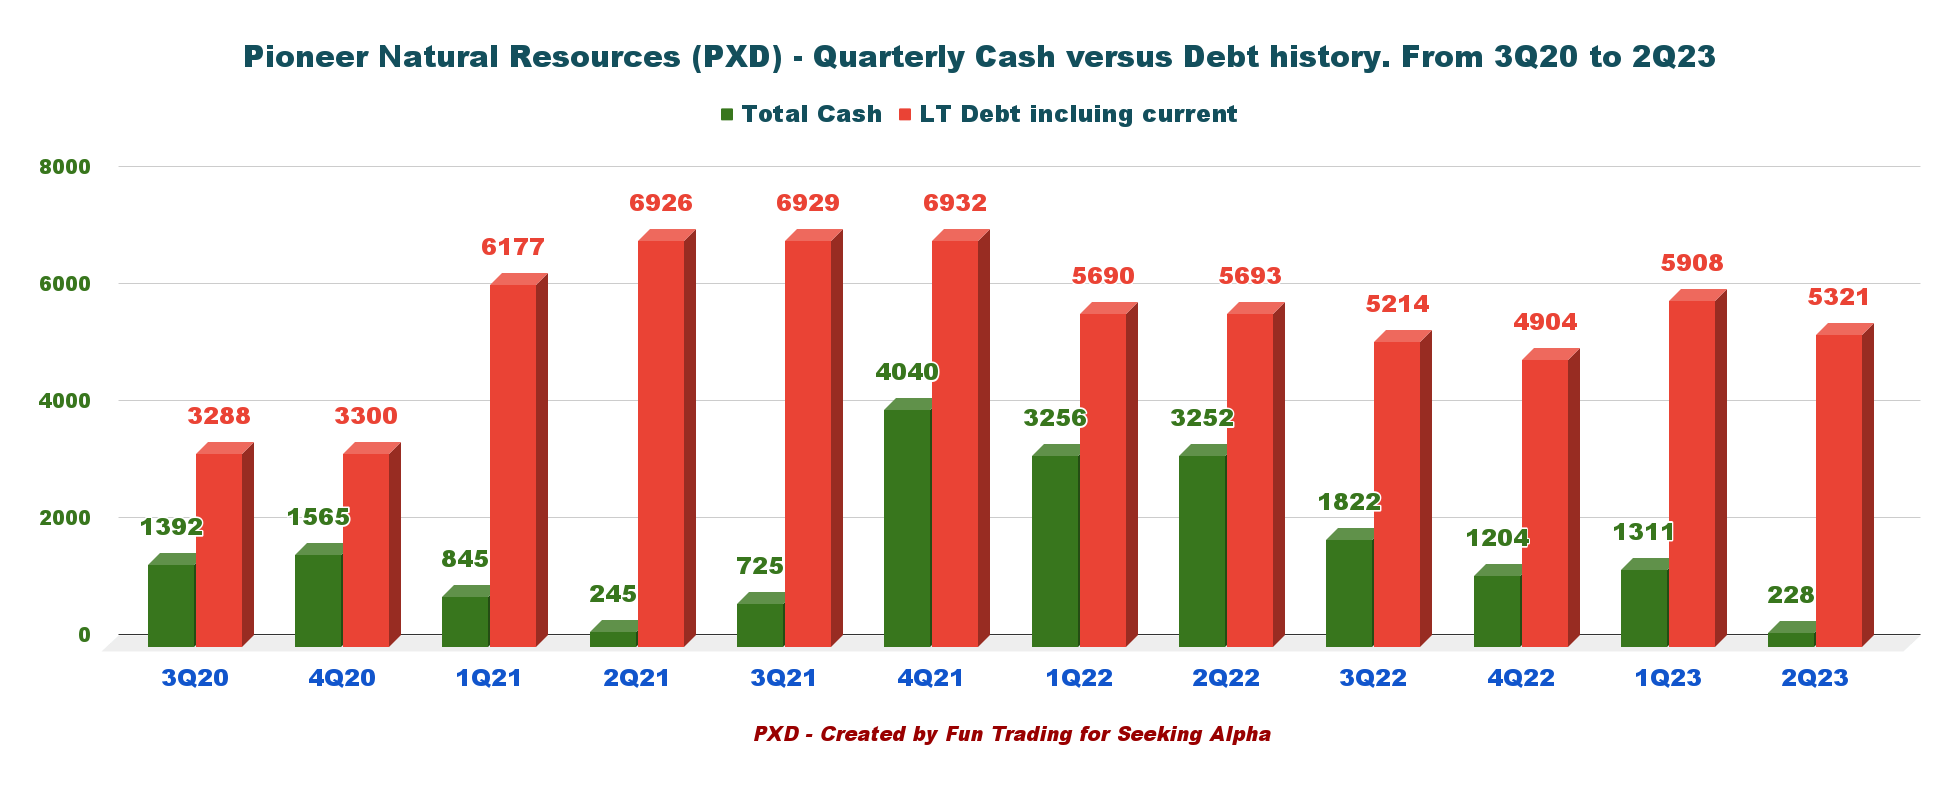
4 - Net Debt was $5,093 million in 2Q23
Pioneer Natural Resources had cash and cash equivalents of $228 million as of June 30, 2023, compared with $3,252 million as of June 30, 2022.
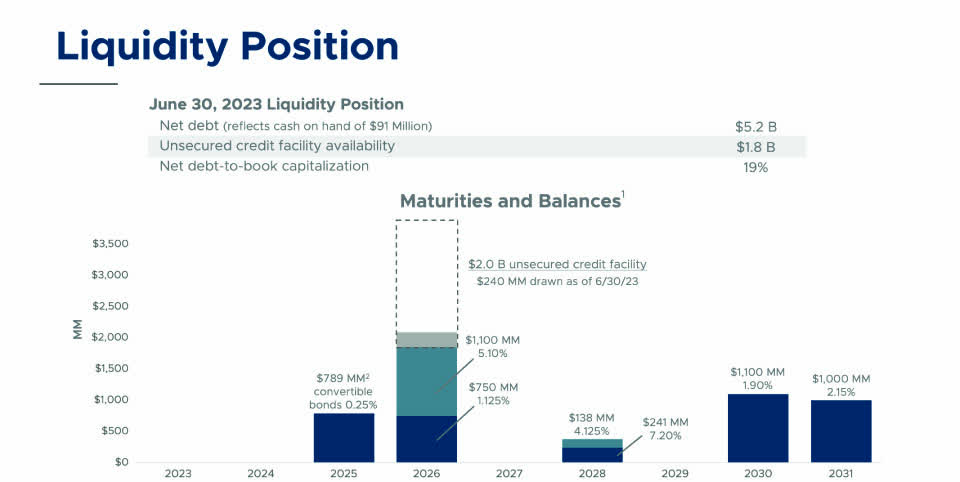
PXD Quarterly Cash versus Debt History (Fun Trading) The total Debt was $5,321 million at the end of June 2023, including current. The Company had $1.9 billion of liquidity, comprised of $228 million of cash on hand/security and $1.8 billion available under a $2.0 billion unsecured credit facility, as of June 30, 2023. Net debt to book Capitalization is 19%. Below are shown debt maturities and balances. The difference in Net Debt comes from the cash on hand used by the company, which is only a part of the total cash. PXD Quarterly Debt and Liquidity (PXD Presentation)
Technical Analysis (Short Term) And Commentary
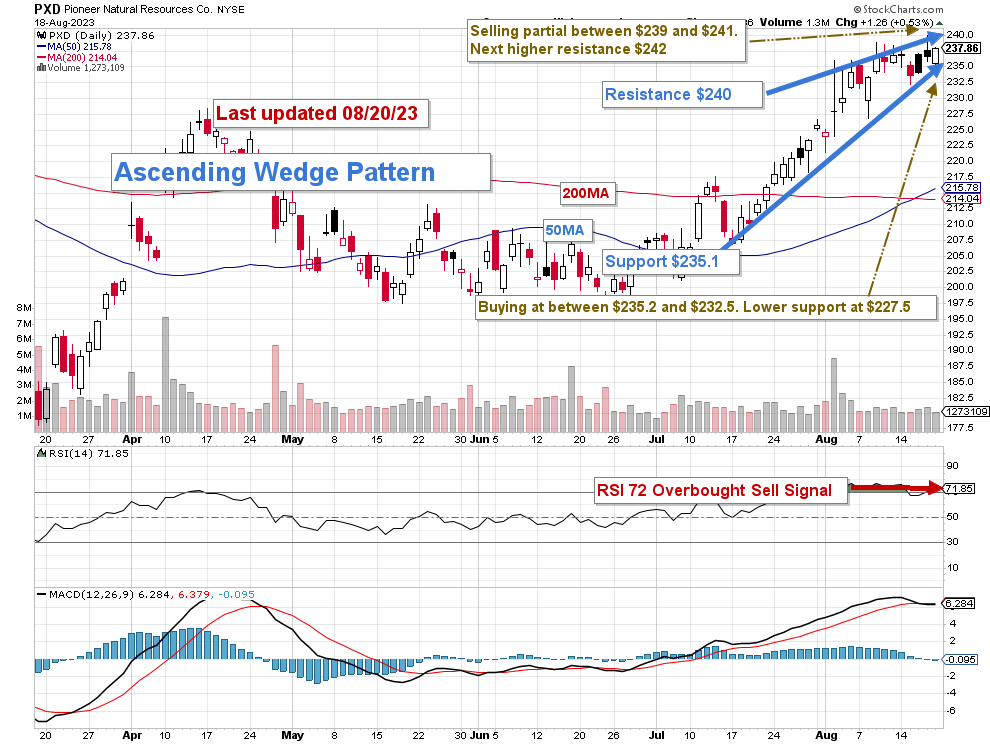
PXD TA Chart Short-Term (Fun Trading StockCharts)
Note: The chart is adjusted for the dividend.
PXD forms an ascending channel pattern with resistance at $240 and support at $235.1. RSI(14) is now 71, signaling an overbought situation with a sell flag.
What is a Rising Wedge ? The rising (ascending) wedge pattern is a bearish chart pattern that signals an imminent breakout to the downside . It's the opposite of the falling (descending) wedge pattern (bullish), as these two constitute a popular wedge pattern.
Thus, I recommend selling PXD between $239 and $241 with possible higher resistance at $242 . Conversely, as indicated in the chart above, I think it is safe to accumulate PXD between $235.2 and $232.5 , with possible lower support at $227.5. However, waiting below $229 to buy larger lots is prudent.
The trading of PXD is quite simple and depends on the price of oil and gas. You must base your expectations on oil and gas prices and adjust depending on the daily or weekly forecast. The oil market is very volatile and could change direction without any warning.
Trading LIFO is the most appropriate solution, in my opinion. It lets you keep a long-term position, delivering a sizeable dividend and allowing you to trade short-term fluctuations and accumulate short-term gain.
Warning: The TA chart must be updated frequently to be relevant. It is what I am doing in my stock tracker. The chart above has a possible validity of about a week. Remember, the TA chart is a tool only to help you adopt the right strategy. It is not a way to foresee the future. No one and nothing can.
For further details see:
Pioneer Natural Resources: A Peer-Leading Margins Permian Producer