SPY - PKW: Buyback Investors Beware This High-Fee ETF Isn't Worth The Risk
2023-05-17 13:14:50 ET
Summary
- PKW selects U.S. companies that have reduced shares outstanding by 5% or more in the last year. Fees are 0.61%, and the ETF manages $920 million in assets.
- The 5% threshold, combined with only utilizing one year's worth of buybacks, leads to high turnover. There is also no mechanism to remove current constituents that pause their buyback programs.
- PKW's ten-year returns, as well as the results of the S&P 500 Buyback Index, suggest trailing buybacks are not a good leading performance indicator.
- While PKW trades at an attractive 13x forward earnings, constituents are only of average quality, a surprising find for a group of stocks that should be flush with cash. Low sales growth is common.
- I rate PKW a sell. While the ETF can outperform the market from time to time, there are alternatives. This article features a fundamental comparison with DIVB, SYLD, and SPY for your consideration.
Investment Thesis
This article explains why the Invesco BuyBack Achievers ETF ( PKW ) is not a good investment choice for dividend or total return investors. By setting a high 5% buyback yield threshold for constituents, the approach means substantial portfolio turnover is likely. Furthermore, there is no mechanism to remove companies that have paused their buyback programs, current components are only of average quality, and PKW's ten-year returns do not justify its unreasonable 0.61% expense ratio. I rate PKW a "sell," and I look forward to explaining why in further detail below.
PKW Overview
Strategy Discussion
PKW tracks the Nasdaq Buyback Achievers Index, selecting U.S. securities that have reduced shares outstanding by at least 5% over the last year. Evaluations are at the end of January, and the Index is market-cap-weighted after selections meet the following criteria:
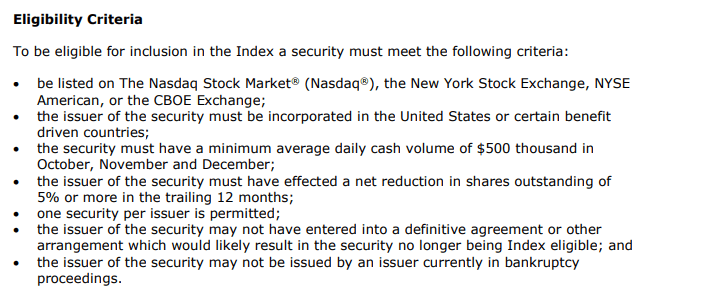
Previously, I compared PKW with the iShares Core Dividend ETF ( DIVB ). However, in December 2022, DIVB's Index underwent an "exceptional" reconstitution making it more dividend-yield focused rather than on buybacks. I believe these changes harmed the ETF fundamentally. However, I will still use DIVB as a comparator for this article alongside the actively-managed Cambria Shareholder Yield ETF ( SYLD ). Despite active management, SYLD's 0.59% expense ratio is competitive with PKW's 0.61%.
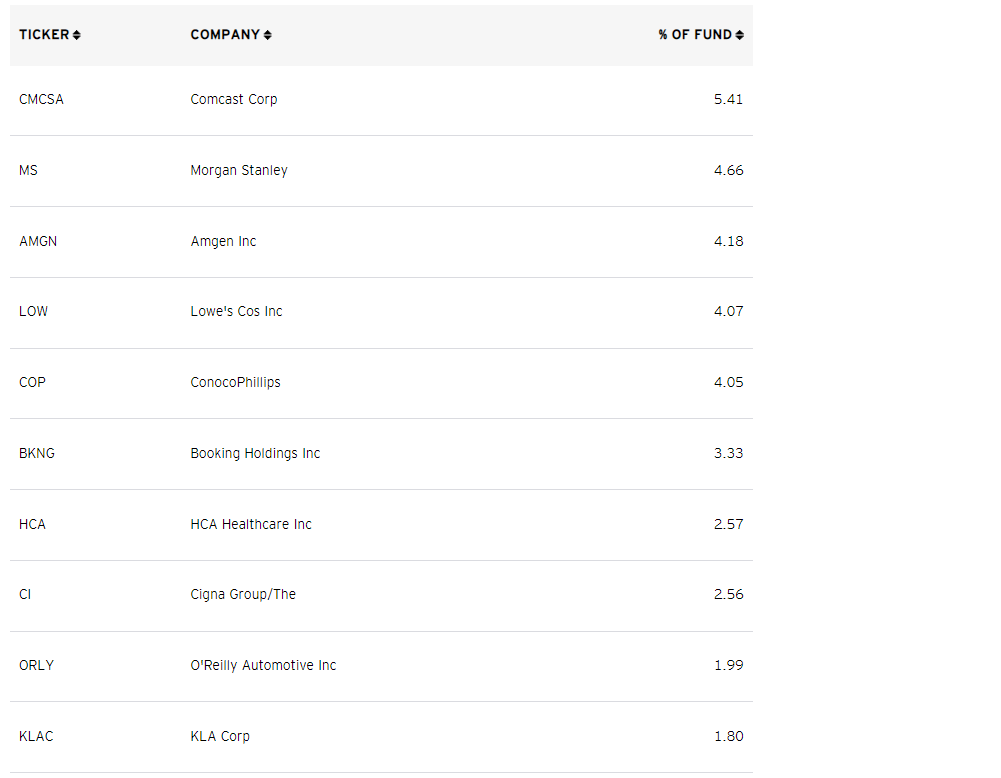
One distinction is that PKW evaluates securities based on one-year buybacks, while DIVB uses two years. This methodology difference can have enormous implications. For example, consider Amgen ( AMGN ), PKW's third-largest holding. It qualified because of $6.36 billion buybacks in Q1 2022 but has not repurchased shares since. HCA Healthcare ( HCA ) and The Cigna Group ( CI ) are PKW's other largest Health Care holdings.
It's a reminder that PKW is backward-looking. It won't necessarily select companies with strong future buyback programs, just ones that did previously. Furthermore, with a sensitive 5% buyback threshold, high turnover is likely. PKW's holdings more than doubled this year (313 vs. 152), with top names like Oracle ( ORCL ), Bank of America ( BAC ), and Dollar General ( DG ) removed. The Index added 221 companies, though many may be deleted next January after only a one-year stint.
The evidence suggests buybacks are not a good indicator of future performance. Consider the ten-year results of the S&P 500 Buyback Index, an Index of the 100 S&P 500 stocks with the highest buyback ratios. The Index has underperformed the S&P 500 Index by 0.33% per year. It's not a perfect proxy since the Buyback Index is equal-weighted. Still, even if the S&P 500 Equal Weight Index is a better comparator, the Buyback Index's outperformance is mostly offset by PKW's 0.61% fees.
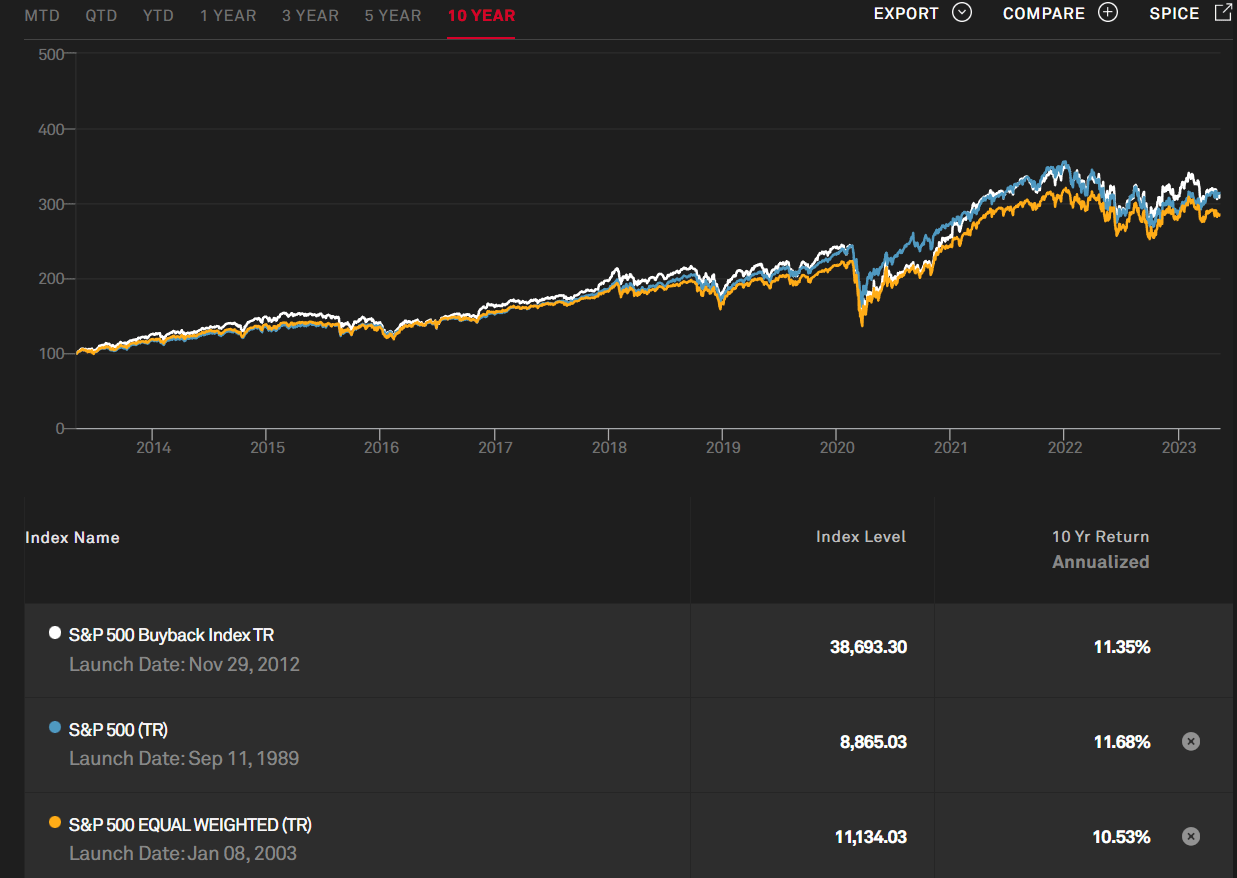
Sector Exposures and Top Ten Holdings
Sector exposures for PKW, DIVB, and SYLD are below, including the SPDR S&P 500 ETF ( SPY ) for reference purposes. SPY is a large-cap blend ETF, while the others are value-oriented and avoid most mega-cap stocks.
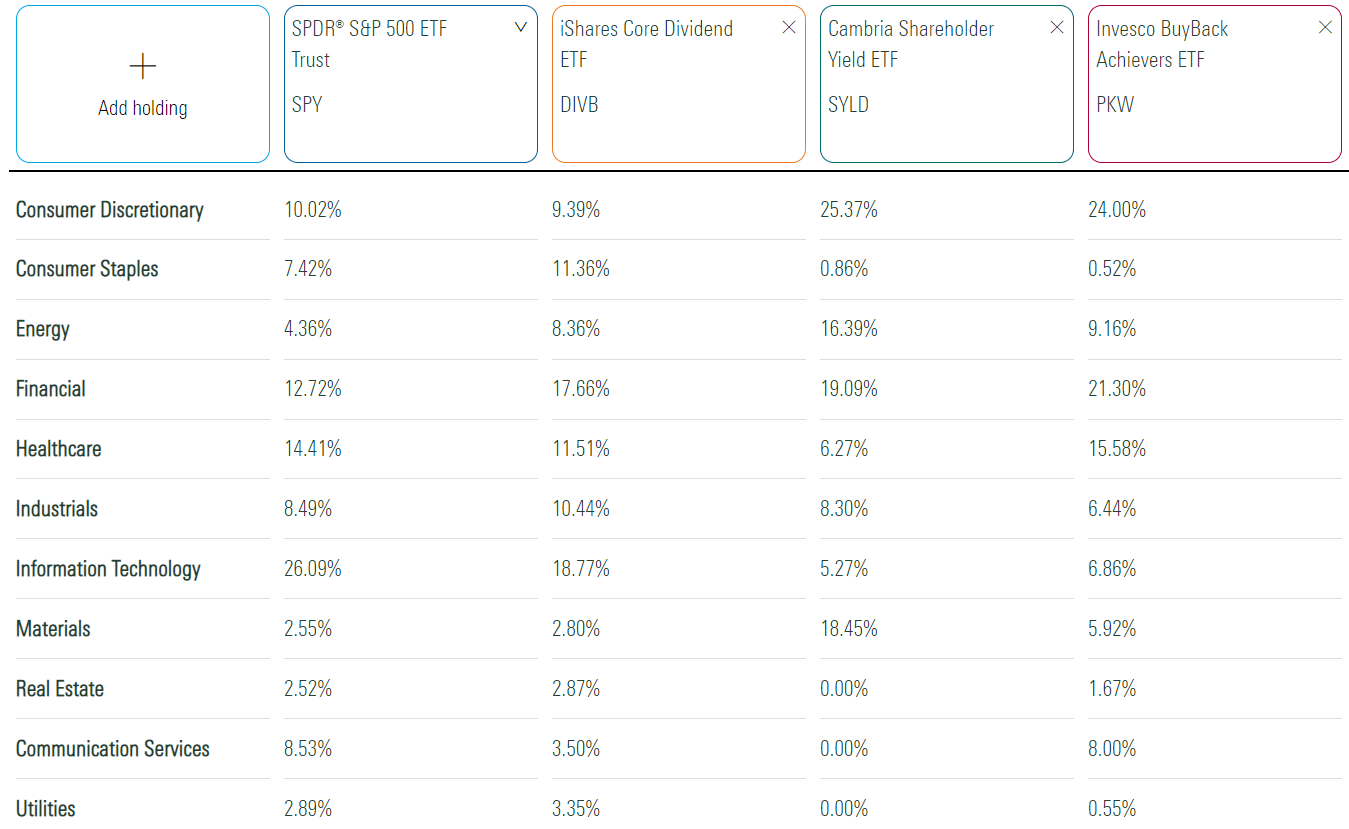
PKW and SYLD are similar: each overweight Consumer Discretionary but underweight Consumer Staples and Technology. However, PKW is 8% Communication Services, unusual for a value-oriented ETF. That's mostly Comcast ( CMCSA ), the top holding that recently expanded its share purchase authorization program to $20 billion. Morgan Stanley ( MS ) did the same in June 2022, while Amgen has paused its buyback program, as discussed earlier. These three companies comprise 14% of PKW.
Performance Analysis
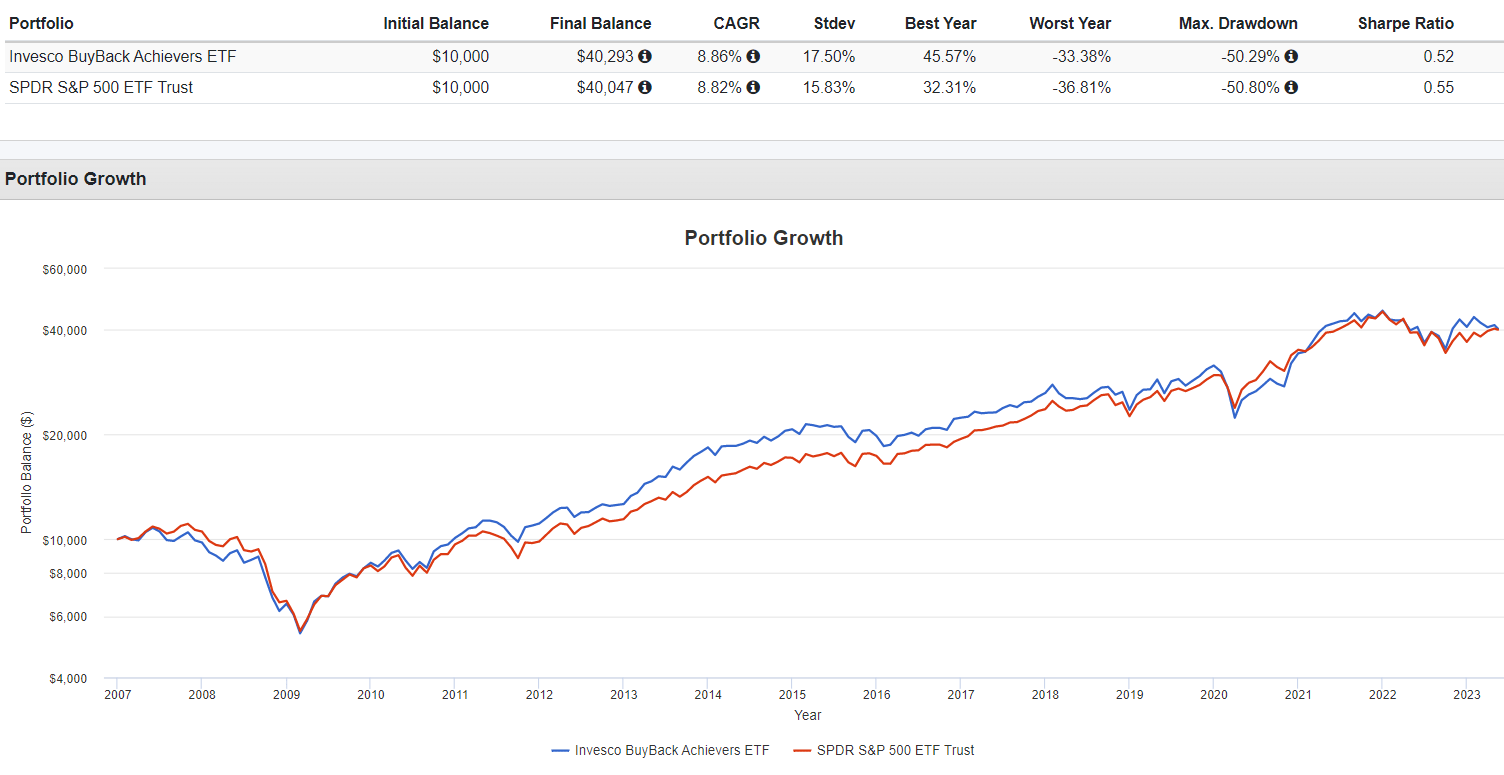
Since November 2006, PKW has outperformed SPY by 0.04% per year despite the higher expense ratio. However, due to higher volatility, SPY's risk-adjusted returns (Sharpe Ratio) were superior.
Three years contributed to PKW's outperformance:
- 2008: -33.38% vs. -36.81%
- 2009: 31.25% vs. 26.36%
- 2013: 45.57% vs. 32.31%
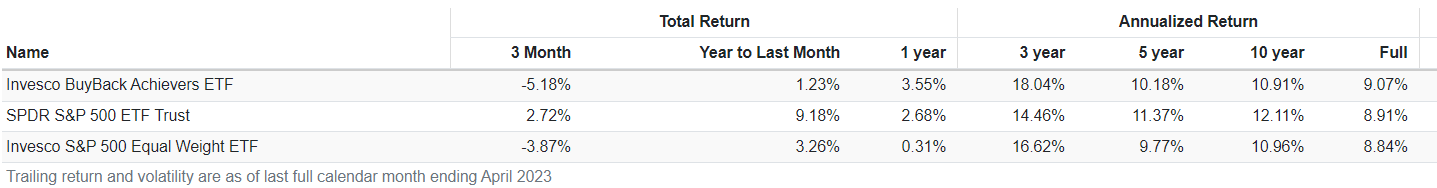
Since then, returns have been less strong, with PKW underperforming by 2.21% per year since January 2014. These results are reflected in the ten-year historical returns below, and as shown, PKW has also slightly lagged behind the Invesco S&P 500 Equal Weight ETF ( RSP ).
Long-term comparisons with DIVB and SYLD are misleading because their methodologies have recently changed. DIVB changed its screening process in December 2022, and SYLD switched to active management in June 2020. Nevertheless, here is a performance comparison since December 2017.
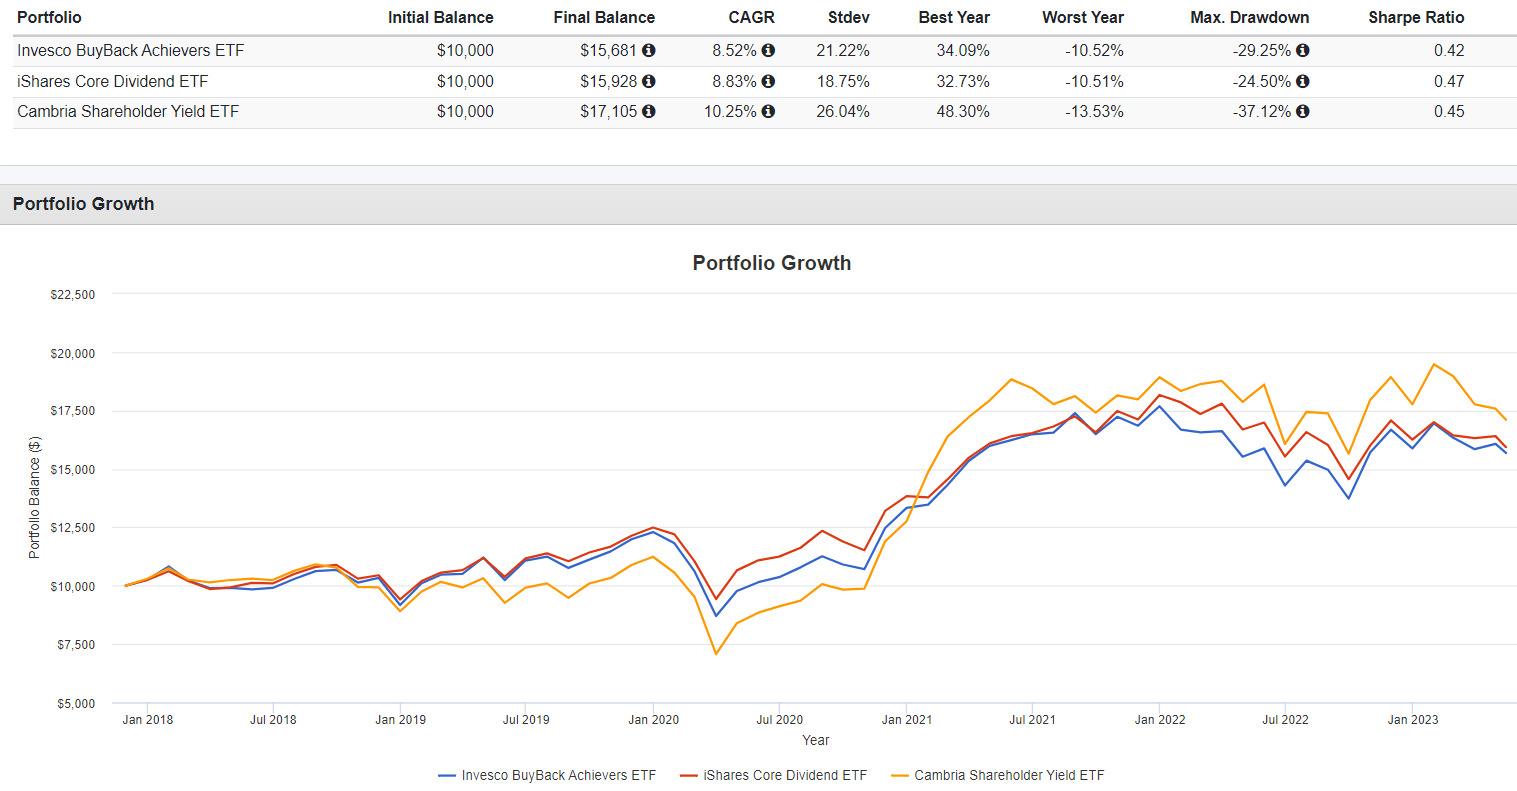
PKW's 8.52% annualized return was the lowest, but let's evaluate each ETF's current fundamentals to understand the risk/reward picture better.
PKW Fundamentals
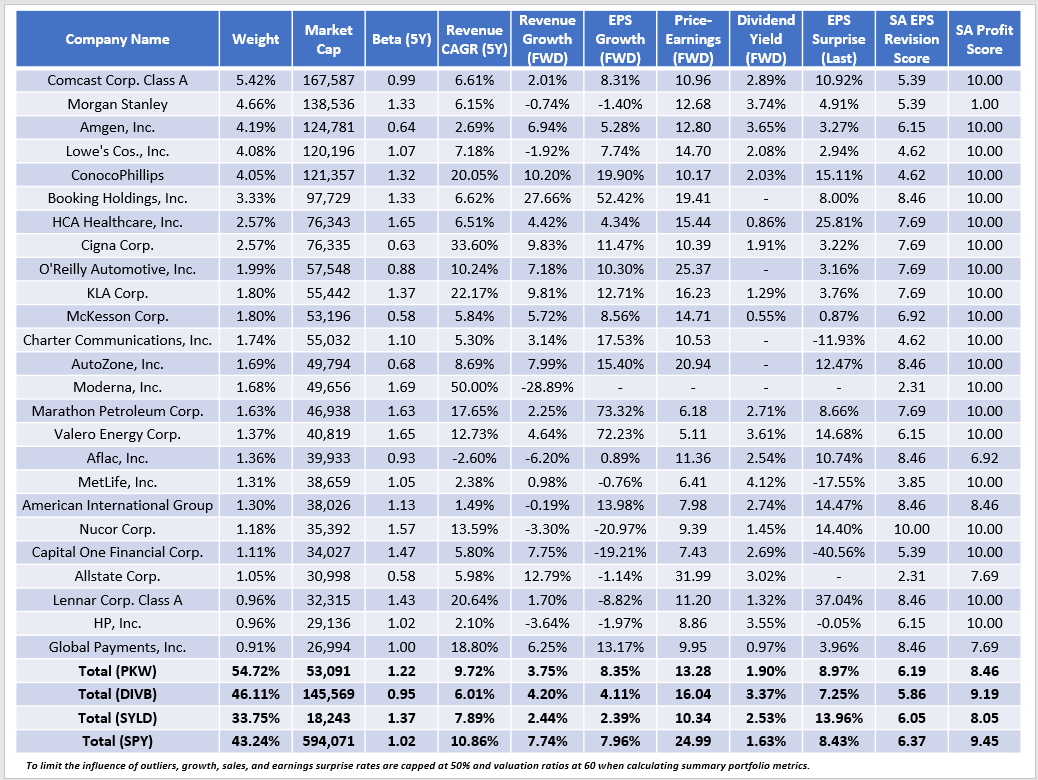
The following table highlights selected fundamentals for PKW's top 25 holdings, totaling 55% of the ETF. Summary metrics for PKW, DIVB, SYLD, and SPY are provided in the final rows.
PKW is the most concentrated, partially a result of its market-cap-weighting scheme. Its 1.22 five-year beta also indicates it's more volatile than DIVB and SPY because it avoids the mega-cap stocks that drive market returns. This feature could be beneficial from a diversification perspective, as there's only a 6% overlap between the funds. However, the downside to these deep-value funds is usually more risk. PKW trades at just 13.28x forward earnings, but few constituents have impressive expected sales growth rates. The weighted average for the portfolio is 3.75%, between DIVB and SYLD but less than half of SPY. I consider these weak and expect them to underperform in rising markets. Already in 2023, PKW has trailed SPY by almost 10%.
PKW has a much better 8.35% estimated EPS growth rate due to the buyback feature, which reduces outstanding shares and improves earnings per share. However, I'm concerned those estimates may not materialize if buybacks don't meet analyst expectations. Ironically, even prudent management decisions may be viewed negatively, like pausing a buyback program to conserve cash for a possible recession.
Finally, PKW has a 1.90% gross dividend yield (1.29% net). While dividends aren't the focus, I am disappointed at the portfolio's average 8.46/10 profitability score. It's surprising because companies capable of repurchasing shares should be more profitable than most. However, the average profitability score for diversified ETFs with market capitalizations between $25 and $75 billion is 8.23/10, so it's not much of an improvement. SPY's 9.45/10 score is ideal and likely why it typically bounces back strong after downturns.
Investment Recommendation and Conclusion
I don't recommend readers buy PKW. Despite more risk, the reward wasn't there, as PKW lagged SPY over the last ten years in a rising market. The 0.61% expense is unjustified, even though it improves portfolio diversification. In addition, I'm uneasy about using trailing buybacks as the primary input. This screen, combined with the high 5% threshold, leads to a high turnover that might not be beneficial. Furthermore, the timing of reconstitutions means that companies with no current buyback programs, like Amgen, may still have prominent weightings. Other considerations are a low 1.29% expected dividend yield and an average profitability score.
Readers may like SYLD more, especially since it's outperformed PKW since its June 2020 switch to active management. However, the category is a challenging one to pin down. Most are volatile, deep-value ETFs that will likely underperform in a downturn. Nevertheless, I hope you found this analysis helpful, and if you're interested in more detailed research on another similar ETF, please let me know in the comments section below.
For further details see:
PKW: Buyback Investors Beware, This High-Fee ETF Isn't Worth The Risk