TMO - Polen Focus Growth Q2 2023 Portfolio Manager Commentary
2023-07-21 00:55:00 ET
Summary
- Polen Capital is a high-conviction growth investment manager. We scour the globe in search of the highest quality, sustainable companies to invest in.
- The Focus Growth Composite Portfolio (the “Portfolio”) returned 10.51% gross fees and 10.36% net fees in the second quarter of 2023.
- We began 2023 expecting to see accelerating earnings growth for our Portfolio on a weighted average basis.
Summary
- Internet and technology-oriented businesses continued their outperformance for the second quarter in 2023, while many of last year's outperformers, like energy and utilities, struggled. The Federal Reserve may not yet be done tightening. However, with inflation receding even in a tight labor market, it seems to us that short-term interest rates are unlikely to go much higher.
- The Focus Growth Composite Portfolio (the "Portfolio") trailed the Russell 1000 Growth Index and outperformed the S&P 500 Index in the second quarter. Year to date, the Portfolio trailed the Russell 1000 Growth Index and outpaced the S&P 500 Index.
- The second quarter's top absolute contributors were Amazon, Netflix, and Microsoft. The top absolute detractors were Illumina, Thermo Fisher Scientific, and PayPal. On a relative basis, the top performers were Amazon, Netflix, and Adobe, and the leading detractors were NVIDIA, Illumina, and Thermo Fisher Scientific. We detail our current thoughts on artificial intelligence ((AI)) and "AI-Darling" NVIDIA further in this commentary.
- We initiated a position in Workday and added to our position in PayPal. We modestly trimmed our holdings in Microsoft, Salesforce, Autodesk, and Gartner to fund these purchases.
- We began 2023 expecting to see accelerating earnings growth for our Portfolio on a weighted average basis. Nearly halfway through the year, the Portfolio is on pace for better than 20% earnings per share growth in 2023, which is well above the Portfolio's long-term, mid-teens average.
Seeks Growth & Capital Preservation (Performance (%) as of 6-30-2023)
The performance data quoted represents past performance and does not guarantee future results. Current performance may be lower or higher. Periods over one year are annualized. Performance figures are presented gross and net of fees and have been calculated after the deduction of all transaction costs and commissions, and include the reinvestment of all income. Please reference the GIPS Report which accompanies this commentary.
The commentary is not intended as a guarantee of profitable outcomes. Any forward-looking statements are based on certain expectations and assumptions that are susceptible to changes in circumstances. Opinions and views expressed constitute the judgment of Polen Capital as of the date herein, may involve a number of assumptions and estimates which are not guaranteed, and are subject to change.
All company-specific information has been sourced from company financials as of the relevant period discussed.
Commentary
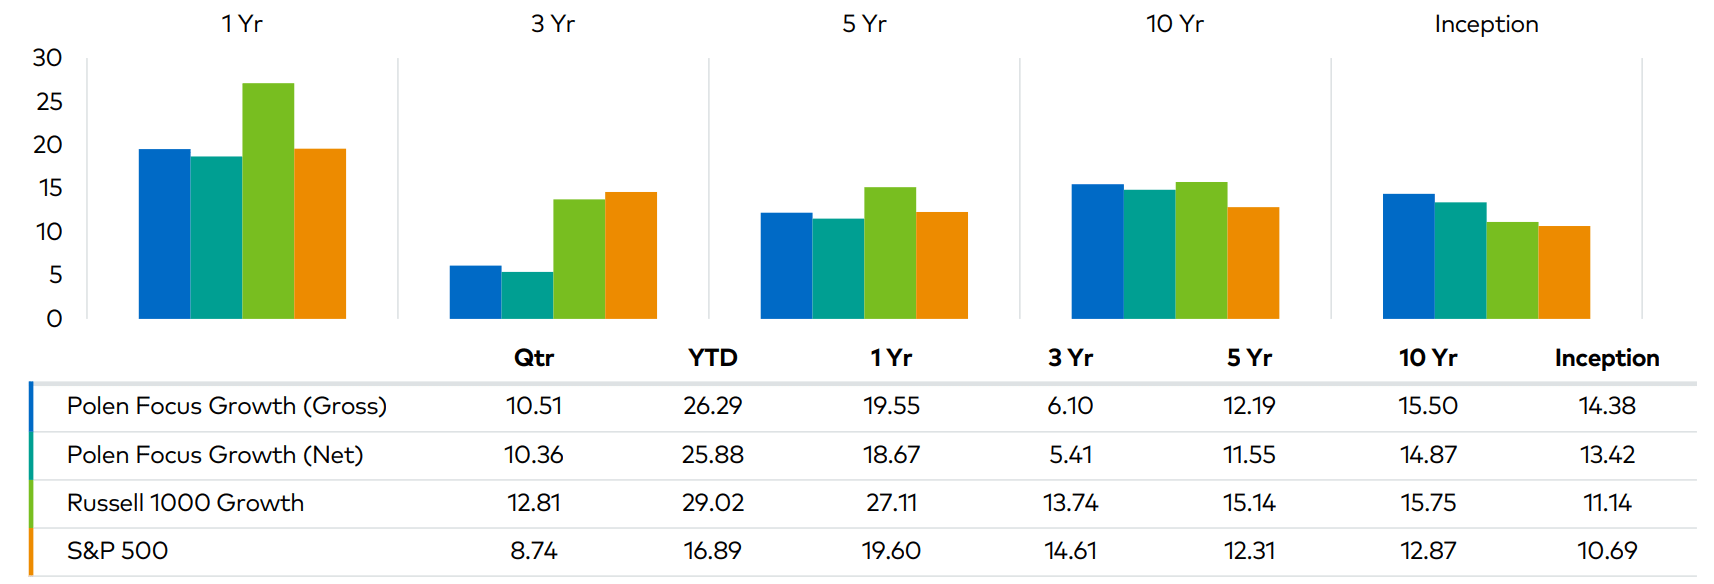
The Focus Growth Composite Portfolio (the "Portfolio") returned 10.51% gross fees and 10.36% net fees in the second quarter of 2023. The Russell 1000 Growth Index returned 12.81% and the S&P 500 Index returned 8.74% for the same period. Year to date, the Portfolio returned 26.29% and 25.88 %, gross and net of fees, respectively, versus 29.02% and 16.89% for the Russell and S&P 500, respectively.
Internet and technology-oriented businesses continued their outperformance for the second straight quarter, while many of last year's outperformers, like energy and utilities, struggled. The Federal Reserve may not yet be done tightening. However, with inflation receding even in a tight labor market, it seems to us that short-term interest rates are unlikely to go much higher. The longer end of the Treasury yield curve has been relatively stable, with yields remaining below 4% at the time of this writing and well below short-term rates. As the bond market indicates, inflation should move lower and toward more historical levels.
Assuming rates do not rise significantly from here, we believe our Portfolio's valuation is quite fair.
The Portfolio's weighted average earnings growth is accelerating, as we expected.
In 2022, some of our holdings had difficulty achieving revenue growth in line with their long-term trends because of difficult comparisons and changing COVID dynamics. Now, most of these companies have experienced a rebound in revenue growth and have also shown a newfound willingness to control their operating expenditures, yielding substantial margin expansion and earnings growth. For example, Amazon ( AMZN ) and Netflix ( NFLX ) (two of our top three absolute contributors to our return in 2Q) are exercising more stringent spending discipline while revenue growth accelerates, a powerful combination for earnings growth in our view.
The hype around AI (artificial intelligence) hit a fever pitch in the first half of 2023. Below, we discuss some of our developing thoughts on the hype versus reality in AI and how businesses may be impacted.
Portfolio Performance & Attribution
The top absolute contributors to the Portfolio's performance in the second quarter were Amazon , Netflix , and Microsoft ( MSFT ) . The top absolute detractors were Illumina ( ILMN ) , Thermo Fisher Scientific ( TMO ) , and PayPal ( PYPL ) . On a relative basis, based on total attribution, the top performers in the quarter were Amazon, Netflix, and Adobe. The leading detractors to our relative performance were NVIDIA ( NVDA ) , Illumina , and Thermo Fisher Scientific.
As mentioned, Amazon and Netflix are seeing their revenue growth accelerate after a difficult 2022 while keeping expense growth in check. We expect robust earnings growth for both companies in 2023 and growth rates in the mid-teens or higher well into the future. Adobe ( ADBE ) has had several cross-currents this year with slightly slower revenue growth, the announcement of a sizeable potential acquisition of Figma, and the introduction of generative AI functionality into many of its products. These issues seem to be a net positive, although we are cautious about the company's ability to achieve regulatory approval for the Figma acquisition. Generative AI also poses some potential competitive challenges for Adobe, which we will describe in more detail later.
Many investors believe Microsoft will see a significant net benefit from AI because of its partnership with OpenAI (the developer of ChatGPT) and its position as a leading public cloud computing platform that can provide AI-related tools and capabilities to its enterprise and commercial customers. We tend to agree that AI can benefit Microsoft across its product portfolio. However, we expect AI to be more additive to the company's Azure cloud business and, potentially, its existing productivity products rather than provide a massive boost to the company's Bing search engine despite CEO Satya Nadella's recent displays of exuberance in this area.
With respect to detractors, the ongoing headache with Illumina's acquisition of Grail continues to pressure the company's share price, in our view. It seems increasingly likely that the company will have to divest the early-stage, cancer-testing company soon, as a divestiture order from the European Commission appears inevitable in the coming months. While we believe regulators far overreach on antitrust concerns, our opinions don't matter here. We would prefer that Illumina own Grail and better position the company to bring potentially lifesaving cancer screenings to patients across the globe. Our investment thesis is based on Illumina's competitive position in its core, next-generation genomic sequencing business. We remain sanguine on the company's ability to compound earnings growth at attractive rates for many years to come, and as such, we find today's valuation quite attractive. We expect the Grail drama to be in the rearview mirror within the next few quarters.
Thermo Fisher Scientific's share price came under pressure after its recent investor day. Management articulated that they continue to expect 7-9% annualized revenue growth and midteens earnings per share growth over the long term, in line with our expectations. But, management's comments on the near-term potential for slower-than-normal growth across the industry led to immediate share price weakness. Our view on the company is unchanged, and our focus on the longer term allows us to look beyond any minor near-term headwinds.
PayPal was also weak in the quarter, but we have become more optimistic about the company's growth prospects. which we discuss in the Portfolio Activity section.
Our Current Thoughts on AI
NVIDIA was the largest relative headwind to the Portfolio as we do not own this "AI darling." NVIDIA shares rose more than 50% in the second quarter alone, following a 90% increase in the share price in the first quarter of 2023. NVIDIA supplies GPUs (graphics processing units), the preferred (often necessary) semiconductors for machine learning and AI. On their recent earnings call, NVIDIA management announced that they expect a significant increase in demand for the GPUs for datacenter customers beginning this quarter and lasting at least through the end of this year. NVIDIA's datacenter business, which was almost non-existent from a revenue perspective eight years ago, is now the company's largest and fastest-growing business.
We find NVIDIA's competitive advantages to be quite large around its technology, but even more importantly around its full-stack solutions, including highly integrated hardware, software, and networking equipment and a robust developer ecosystem. It would be difficult to disrupt these competitive advantages in our view. That said, with a greater than $1 trillion valuation on the back of what feels like peak-level AI exuberance since OpenAI's breakthrough with ChatGPT, we believe virtually all the upside opportunities we can currently see for the company are already priced in.
To justify today's market capitalization for NVIDIA, we believe the following will need to occur over the next five years: 1) NVIDIA will achieve virtually 100% market share in the datacenter chip market, which itself would grow to be 2x its current size, 2) its Gaming business will double, 3) the Automotive business will grow five-fold, 4) roughly another $10 billion in revenue will come in from nascent areas like Metaverse/Omniverse, 5) net margins will improve from 40% to 50%, and 6) the stock will maintain at least a 25x next-twelve-months P/E multiple in 2028. To be clear, these are all possible, even the nearly 100% data center market share potential, but these are not the types of more conservative assumptions that we believe are appropriate to price in today.
To be clear, NVIDIA is seeing real and robust demand for its AI chips as large cloud service providers and consumer internet companies must build their AI foundations with NVIDIA's GPUs as the backbone. Essentially, the investments many businesses are making today in this new AI arms race in hopes of what AI can bring them in the future are being earned as revenues for NVIDIA today.
The reality is that real business and consumer applications using AI and large language models (LLMs) are still in the very early stages.
Companies know they need to build AI into their offerings, but most do not know exactly how or how much it will cost. According to a leading IT services firm that has shared views on this topic, roughly half of the world's large enterprises do not have the ability to meaningfully deploy AI because of the current architecture of their data and technology infrastructure.
NVIDIA is on the front end supplying the chips that will do much of the computational hard work of AI in the future and raking in billions of incremental revenues over a short period as part of this arms race. Meanwhile, the rest of the world is still trying to figure out how to harness that power in a way that will bring more revenue or less expense (or both) to their respective businesses. With the hype around AI and a meaningful percentage of NVIDIA's 2023 data center revenue being driven by this AI arms race, it is challenging to project the sustainability of the current demand for NVIDIA's datacenter GPUs. We will continue to follow NVIDIA closely because, on the one hand, it is clear the company is a large and advantaged winner that will be extremely difficult to displace, but on the other hand, understanding the magnitude and cadence of NVIDIA's growth remains complex. The market is already assigning a much higher degree of certainty surrounding all the factors we listed above going right than we are willing to underwrite given our research to date.
Beyond NVIDIA, our team believes AI will be transformational for businesses of all kinds. However, it is likely still very early, and understanding opportunities and risks requires open-mindedness and diligence.
Many of the companies we research will likely be able to create even better products and services with AI.
For instance, Adobe has integrated a generative AI tool called Firefly into its creative software that can quickly create new visual images and videos with ease. It is a convenient upgrade to its existing creative software tools. We believe Google Search will create an even better ability for users to find answers to their search queries than they can today through AI.
Yet, for both companies, AI can also be a risk. Free generative AI text-to-visual tools like Dall-E are new competition to Adobe at the low end of the market but could get better and encroach on the company's core market. Even if Google keeps the competition away from search because its AI is better than or at least as good as newer entrants, will it still be as monetizable as Google Search is today? In addition, what level of investment will be required for these companies to invest appropriately in AI (GPUs are not cheap), and will there be enough incremental revenue to offset higher levels of investment? These are key questions for future investment. It is still too early to know the answers to many of these questions with certainty at this stage.
We will remain invested in businesses that will be affected by AI as long as we believe their core businesses are among the strongest globally and they have a clear path to making the necessary investments and product innovations or enhancements to be leaders in their respective industries as AI becomes more important. Our views will naturally evolve as we continue to learn more in these areas over time. We expect to update our clients regularly on our AI-related thoughts just as we have over the years with other transformational technologies like e-commerce and mobile as they have developed.
Portfolio Activity
Toward the end of the second quarter, we added a new position in Workday ( WDAY ) and added to our position in PayPal . We modestly trimmed our holdings in Microsoft , Salesforce ( CRM ) , Autodesk ( ADSK ) , and Gartner ( IT ) to fund these purchases.
Workday is a large enterprise software company specializing in human capital management ((HCM)) software, which includes payroll, workforce planning/analytics, employee experience, recruiting, learning, and talent optimization software. It also offers financial/accounting software, which includes financial management, spend management, analytics, and financial planning software.
Workday is generating over $6 billion in annual revenue and growing at roughly a 20% rate with 95% client retention.
As an HCM cloud leader in the U.S., it is also now seeing robust growth outside the U.S. and in its financial software offerings. We expect compelling revenue growth to continue over the next five years and beyond, with free cash flow growing faster than revenue, given new co-CEO Carl Eschenbach's focus on balancing growth and profitability more effectively. We believe valuation at approximately 30x next-twelve-months free cash flow is attractive for a highly recurring revenue business with about 20% revenue growth and faster free cash flow per share growth.
We recently doubled our position in PayPal to bring it up from a small to an average-sized position for us. We have been patient with PayPal while the company is changing its CEO and trying to modernize its technology architecture to accelerate product development. At a recent investor meeting, the company's new Chief Product Officer, John Kim, demonstrated that PayPal, Venmo, and Braintree are now all finally on one modern tech stack that is integrated and flexible. This demonstrated to us that a new, one-touch buying experience across all of PayPal's merchants should finally be within reach and should put PayPal back at parity with its innovative peers regarding web and mobile checkout functionality and user experience.
This means PayPal's competitive position should be improving just as the growth rate of e-commerce is set to accelerate, likely leading to double-digit revenue growth again in 2024 and beyond. While we continue to monitor PayPal's ongoing CEO search, the company's technology and product development are now on a much better footing in our view, e-commerce growth is set to accelerate, and we believe the valuation is surprisingly low at approximately 13x next-twelve-month EPS.
As a reminder, PayPal is still by far the most prominent digital wallet in the world, with over 400 million users, 190 million monthly active users, and 35 million merchant customers. In their digital vault, PayPal also has nearly one in four credit and debit cards issued globally (outside of China). This unmatched size and scale, now on a modern, flexible technology foundation, positions PayPal well for the future of digital payments in our view.
The trims of Microsoft , Salesforce , Autodesk , and Gartner allow for more appropriate position sizes for their respective valuations.
Outlook
We began 2023 expecting to see accelerating earnings growth for our Portfolio on a weighted average basis. Nearly halfway through the year, the Portfolio is on pace for better than 20% earnings per share growth in 2023, which is well above the Portfolio's long-term, mid-teens average. Even in a slowing global economy, the businesses we seek to invest in can typically grow at double-digit rates, especially today, as several companies in the Portfolio are moving further past a very challenging year in 2022. A few companies that we do not currently own but have large benchmark weights, namely NVIDIA, but also Tesla and Apple, have been meaningful headwinds to our relative performance thus far in 2023. We will continue to follow these businesses closely but currently believe there is too much business risk, valuation risk, or both, depending on the company.
Team Update
Effective June 30, 2023, Bryan Power joined Damon Ficklin and Jeff Mueller as co-portfolio managers of the Global Growth strategy. Jeff Mueller has decided to retire for family reasons and will relinquish his responsibilities on the Large Company Growth Team effective December 31, 2023. While saddened by his departure, we celebrate Jeff's decade-long contribution and commitment to Polen Capital. We also appreciate him supporting this transition through the end of the year.
Given Bryan's strong analytical work and thought leadership on the team, he was promoted to the Director of Research on January 1, 2022, where he has been responsible for managing the Large Company Growth Team Analysts and our global research effort. Bryan will continue to serve as the Director of Research and is well prepared to succeed Jeff as co-portfolio manager for Global Growth.
We have built a deep bench of experienced talent on the Large Company Growth Team that allows us to adapt over time. Please join us in congratulating Bryan on his promotion and wishing Jeff and his family all the best.
Thank you for your interest in Polen Capital and the Focus Growth strategy. Please feel free to contact us with any questions or comments.
Experience in High-Quality Growth Investing
Dan Davidowitz, CFA Portfolio Manager & Analyst
Brandon Ladoff, Portfolio Manager & Director of Sustainable Investing
Definitions:
Price-to-earnings (P/E) ratio: The price-to-earnings (P/E) ratio is the ratio for valuing a company that measures its current share price relative to its per-share earnings.
EPS (earnings per share): The portion of a company's income available to shareholders and allocated to each outstanding share of common stock.
Free cash flow: Free cash flow ((FCF)) is the money a company has left over after paying its operating expenses and capital expenditures. The more free cash flow a company has, the more it can allocate to dividends, paying down debt, and growth opportunities.
GIPS Report
Polen Capital Management
Focus Growth Composite - GIPS Composite Report
| UMA |
| Firm |
| Composite Assets |
| Annual Performance Results |
| 3 Year Standard Deviation |
| Year End |
| Total () |
| Assets () |
| Assets () |
| U.S. Dollars () |
| Number of Accounts |
| Composite Gross % |
| Composite Net (%) |
| S&P 500 (%) |
| Russell 1000 ((G)) (%) |
| Composite Dispersion (%) |
| Composite Gross (%) |
| S&P 500 (%) |
| Russell 1000 ((G)) (%) |
| 2022 |
| 48,143 |
| 18,053 |
| 30,090 |
| 16,657 |
| 1886 |
| -37.51 |
| -38.02 |
| -18.11 |
| -29.14 |
| 0.3 |
| 23.47 |
| 20.87 |
| 23.47 |
| 2021 |
| 82,789 |
| 28,884 |
| 53,905 |
| 14,809 |
| 2387 |
| 24.71 |
| 24.04 |
| 28.71 |
| 27.61 |
| 0.3 |
| 17.25 |
| 17.17 |
| 18.17 |
| 2020 |
| 59,161 |
| 20,662 |
| 38,499 |
| 12,257 |
| 1904 |
| 34.64 |
| 34.00 |
| 18.40 |
| 38.49 |
| 0.4 |
| 18.16 |
| 18.53 |
| 19.64 |
| 2019 |
| 34,784 |
| 12,681 |
| 22,104 |
| 8,831 |
| 939 |
| 38.80 |
| 38.16 |
| 31.49 |
| 36.40 |
| 0.3 |
| 12.13 |
| 11.93 |
| 13.07 |
| 2018 |
| 20,591 |
| 7,862 |
| 12,729 |
| 6,146 |
| 705 |
| 8.99 |
| 8.48 |
| -4.38 |
| -1.51 |
| 0.2 |
| 11.90 |
| 10.95 |
| 12.12 |
| 2017 |
| 17,422 |
| 6,957 |
| 10,466 |
| 5,310 |
| 513 |
| 27.74 |
| 27.14 |
| 21.83 |
| 30.22 |
| 0.3 |
| 10.66 |
| 10.07 |
| 10.54 |
| 2016 |
| 11,251 |
| 4,697 |
| 6,554 |
| 3,212 |
| 426 |
| 1.72 |
| 1.22 |
| 11.96 |
| 7.09 |
| 0.2 |
| 11.31 |
| 10.74 |
| 11.31 |
| 2015 |
| 7,451 |
| 2,125 |
| 5,326 |
| 2,239 |
| 321 |
| 15.89 |
| 15.27 |
| 1.38 |
| 5.68 |
| 0.1 |
| 10.92 |
| 10.62 |
| 10.85 |
| 2014 |
| 5,328 |
| 1,335 |
| 3,993 |
| 1,990 |
| 237 |
| 17.60 |
| 16.95 |
| 13.69 |
| 13.06 |
| 0.2 |
| 10.66 |
| 9.10 |
| 9.73 |
| 2013 |
| 5,015 |
| 1,197 |
| 3,818 |
| 1,834 |
| 245 |
| 23.77 |
| 23.07 |
| 32.39 |
| 33.49 |
| 0.3 |
| 11.91 |
| 12.11 |
| 12.35 |
Performance % as of 12-31-2022:
(Annualized returns are presented for periods greater than one year)
1 Yr 5 Yr 10 Yr Inception
| Polen Focus Growth (Gross) |
| -37.51 |
| 9.68 |
| 13.28 |
| 13.82 |
| Polen Focus Growth (Net) |
| -38.02 |
| 9.08 |
| 12.67 |
| 12.86 |
| Russell 1000 Growth |
| -29.14 |
| 10.96 |
| 14.11 |
| 10.49 |
| S&P 500 |
| -18.22 |
| 9.40 |
| 12.55 |
| 10.34 |
Some versions of this GIPS Report previously included assets of the Firm's wholly-owned subsidiary in the 2022 Firm Assets figure, in error. The figure above has been corrected to no longer count assets at the subsidiary level.
Total assets and UMA assets are supplemental information to the GIPS Composite Report.
While pitch books are updated quarterly to include composite performance through the most recent quarter, we use the GIPS Report that includes annual returns only. To minimize the risk of error we update the GIPS Report annually. This is typically updated by the end of the first quarter.
GIPS Report
The Focus Growth Composite created on January 1, 2006, with inception date April 1, 1992, contains fully discretionary large-cap equity accounts that are not managed within a wrap fee structure and for comparison purposes are measured against the S&P 500 and the Russell 1000 Growth indices. Effective January 2022, fully discretionary large-cap equity accounts managed as part of our Focus Growth strategy that adheres to the rules and regulations applicable to registered investment companies subject to the U.S. Investment Company Act of 1940 and the Polen Focus Growth Collective Investment Trust were included in the Focus Growth Composite.
Prior to March 22, 2021, the composite was named Large Capitalization Equity Composite. The accounts comprising the portfolios are highly concentrated and are not constrained by EU diversification regulations.
Polen Capital Management claims compliance with the Global Investment Performance Standards (GIPS®) and has prepared and presented this report in compliance with the GIPS standards. Polen Capital Management has been independently verified for the periods April 1, 1992, through June 30, 2022. A firm that claims compliance with the GIPS standards must establish policies and procedures for complying with all the applicable requirements of the GIPS standards. Verification provides assurance on whether the firm's policies and procedures related to composite and pooled fund maintenance, as well as the calculation, presentation, and distribution of performance, have been designed in compliance with the GIPS standards and have been implemented on a firm-wide basis. The Focus Growth Composite has had a performance examination for the periods April 1, 1992 through June 30, 2022. The verification and performance examination reports are available upon request.
Polen Capital Management is an independent registered investment adviser. Polen Capital Management invests exclusively in equity portfolios consisting of high-quality companies but also has a subsidiary, Polen Capital Credit, LLC, that specializes in high-yield securities and special situations investing. A list of all composite and pooled fund investment strategies offered by the firm, with a description of each strategy, is available upon request. In July 2007, the firm was reorganized from an S-corporation into an LLC and changed names from Polen Capital Management, Inc. to Polen Capital Management, LLC.
Results are based on fully discretionary accounts under management, including those accounts no longer with the firm. Effective January 1, 2022, the composite policy requires the temporary removal of any portfolio incurring a client-initiated significant net cash inflow or outflow of 10% or greater of portfolio assets. From July 1, 2002, through April 30, 2016, composite policy required the temporary removal of any portfolio incurring a client-initiated significant cash outflow of 10% or greater of portfolio assets. The temporary removal of such an account occurred at the beginning of the month in which the significant cash flow occurred and the account re-entered the composite the first full month after the cash flow. The U.S. Dollar is the currency used to express performance. Certain accounts included in the composite may participate in a zero-commission program. Returns are presented gross and net of management fees and include the reinvestment of all income. Net of fee performance was calculated using either actual management fees or the highest fees for fund structures. The annual composite dispersion presented is an asset-weighted standard deviation using returns presented gross of management fees calculated for the accounts in the composite the entire year. Policies for valuing investments, calculating performance, and preparing GIPS Reports are available upon request.
The separate account management fee schedule is as follows:
Institutional: Per annum fees for managing accounts are 75 basis points (.75%) on the first $50 Million and 55 basis points (.55%) on all assets above $50 Million of assets under management. HNW: Per annum fees for managing accounts are 150 basis points (1.5%) of the first $500,000 of assets under management and 100 basis points (1.0%) of amounts above $500,000 of assets under management. Actual investment advisory fees incurred by clients may vary.
The per annum fee schedule for managing the Polen Growth Fund, which is included in the Focus Growth Composite, is 85 basis points (.85%). The total annual fund operating expenses are up to 125 basis points (1.25%). As of 4/30/2022, the mutual fund expense ratio goes up to 1.21%. This figure may vary from year to year. The per annum all-in fee* schedule for managing the Polen Focus Growth Collective Investment Trust, which is included in the Focus Growth Composite, goes up to 60 basis points (.60%). The per annum all-in fee* schedule for managing the Polen Capital Focus Growth Fund, which is included in the Focus Growth Composite, goes up to 65 basis points (.65%). *The all-in fee (which is similar to a total expense ratio) includes all administrative and operational expenses of the fund as well as the Polen Capital management fee.
Past performance does not guarantee future results and future accuracy and
profitable results cannot be guaranteed. Performance figures are presented gross and net of management fees and have been calculated after the deduction of all transaction costs and commissions. Polen Capital is an SEC-registered investment advisor and its investment advisory fees are described in its Form ADV Part 2A. The advisory fees will reduce clients' returns. The chart below depicts the effect of a 1% management fee on the growth of one dollar over a 10-year period at 10% (9% after fees) and 20% (19% after fees) assumed rates of return.
The Russell 1000® Growth Index is a market capitalization-weighted index that measures the performance of the large-cap growth segment of the U.S. equity universe. It includes Russell 1000® Index companies with higher price-to-book ratios and higher forecasted growth values. The index is maintained by the FTSE Russell, a subsidiary of the London Stock Exchange Group. The S&P 500® Index is a market capitalization-weighted index that measures 500 common equities that are generally representative of the U.S. stock market. The index is maintained by S&P Dow Jones Indices.
The volatility and other material characteristics of the indices referenced may be materially different from the performance achieved. In addition, the composite's holdings may be materially different from those within the index. Indices are unmanaged and one cannot invest directly in an index.
The information provided in this document should not be construed as a recommendation to purchase or sell any particular security. There is no assurance that any securities discussed herein will remain in the composite or that the securities sold will not be repurchased. The securities discussed do not represent the composites' entire portfolio. Actual holdings will vary depending on the size of the account, cash flows, and restrictions. It should not be assumed that any of the securities transactions or holdings discussed will prove to be profitable, or that the investment recommendations or decisions we make in the future will be profitable or will equal the investment performance of the securities discussed herein.
A complete list of our past specific recommendations for the last year is available upon request.
| Return |
| 1 Year |
| 2 Years |
| 3 Years |
| 4 Years |
| 5 Years |
| 6 Years |
| 7 Years |
| 8 Years |
| 9 Years |
| 10 Years |
| 10% |
| 1.10 |
| 1.21 |
| 1.33 |
| 1.46 |
| 1.61 |
| 1.77 |
| 1.95 |
| 2.14 |
| 2.36 |
| 2.59 |
| 9% |
| 1.09 |
| 1.19 |
| 1.30 |
| 1.41 |
| 1.54 |
| 1.68 |
| 1.83 |
| 1.99 |
| 2.17 |
| 2.37 |
| 20% |
| 1.20 |
| 1.44 |
| 1.73 |
| 2.07 |
| 2.49 |
| 2.99 |
| 3.58 |
| 4.30 |
| 5.16 |
| 6.19 |
| 19% |
| 1.19 |
| 1.42 |
| 1.69 |
| 2.01 |
| 2.39 |
| 2.84 |
| 3.38 |
| 4.02 |
| 4.79 |
| 5.69 |
Editor's Note: The summary bullets for this article were chosen by Seeking Alpha editors.
For further details see:
Polen Focus Growth Q2 2023 Portfolio Manager Commentary