CA - Precious Metals Look Primed For Secular Bull Market (Technical Analysis)
2023-11-17 10:31:11 ET
Summary
- Gold and silver are ready for explosive moves to the upside. I expect gold to break the key $2,050 level against the USD in the coming weeks.
- The catalyst is likely to be a weakening USD. The Dollar Index's uptrend looks to be over, suffering its sharpest fall in almost a year after this week's CPI data.
- If and when gold breaks above $2,050, I expect precious metals to enter a secular bull market. Silver will likely outperform gold in this scenario.
Gold and Silver ready for explosive breakouts higher
I have been watching precious metals like a hawk in the past few weeks, and I now believe that gold ( GLD ) and silver ( SLV ) are ready to make explosive moves to the upside.
Gold looks primed to take out its $2,000 psychological level against the USD, which then paves the way for a test of the $2,050 mark.
This is a level gold has been trying to break above for 3 years, and I think it will succeed this time.
Silver has lagged gold, but if we are looking at the start of a precious metals bull market (confirmed if gold breaks above $2,050), then silver is highly likely to play catch-up.
I think silver has the potential to rise to $30 at least, which is a +25% move from the current level of $24.
Dollar's uptrend appears to be over
The catalyst for all this to play out is the US CPI on the 14th of November. The inflation data underwhelmed, but not by much. However, the part that caught my attention was the price action, which was very decisive.
The USD saw its sharpest drop in close to a year, and now looks poised to continue trending lower in the weeks ahead. The USD's drop coincided with fall in bond yields and rise in risk assets (equities, cryptos) and precious metals.
The inflation data seems to have set the ball rolling. Over the span of the next few weeks, I expect the USD to continue to weaken, and precious metals to rise.
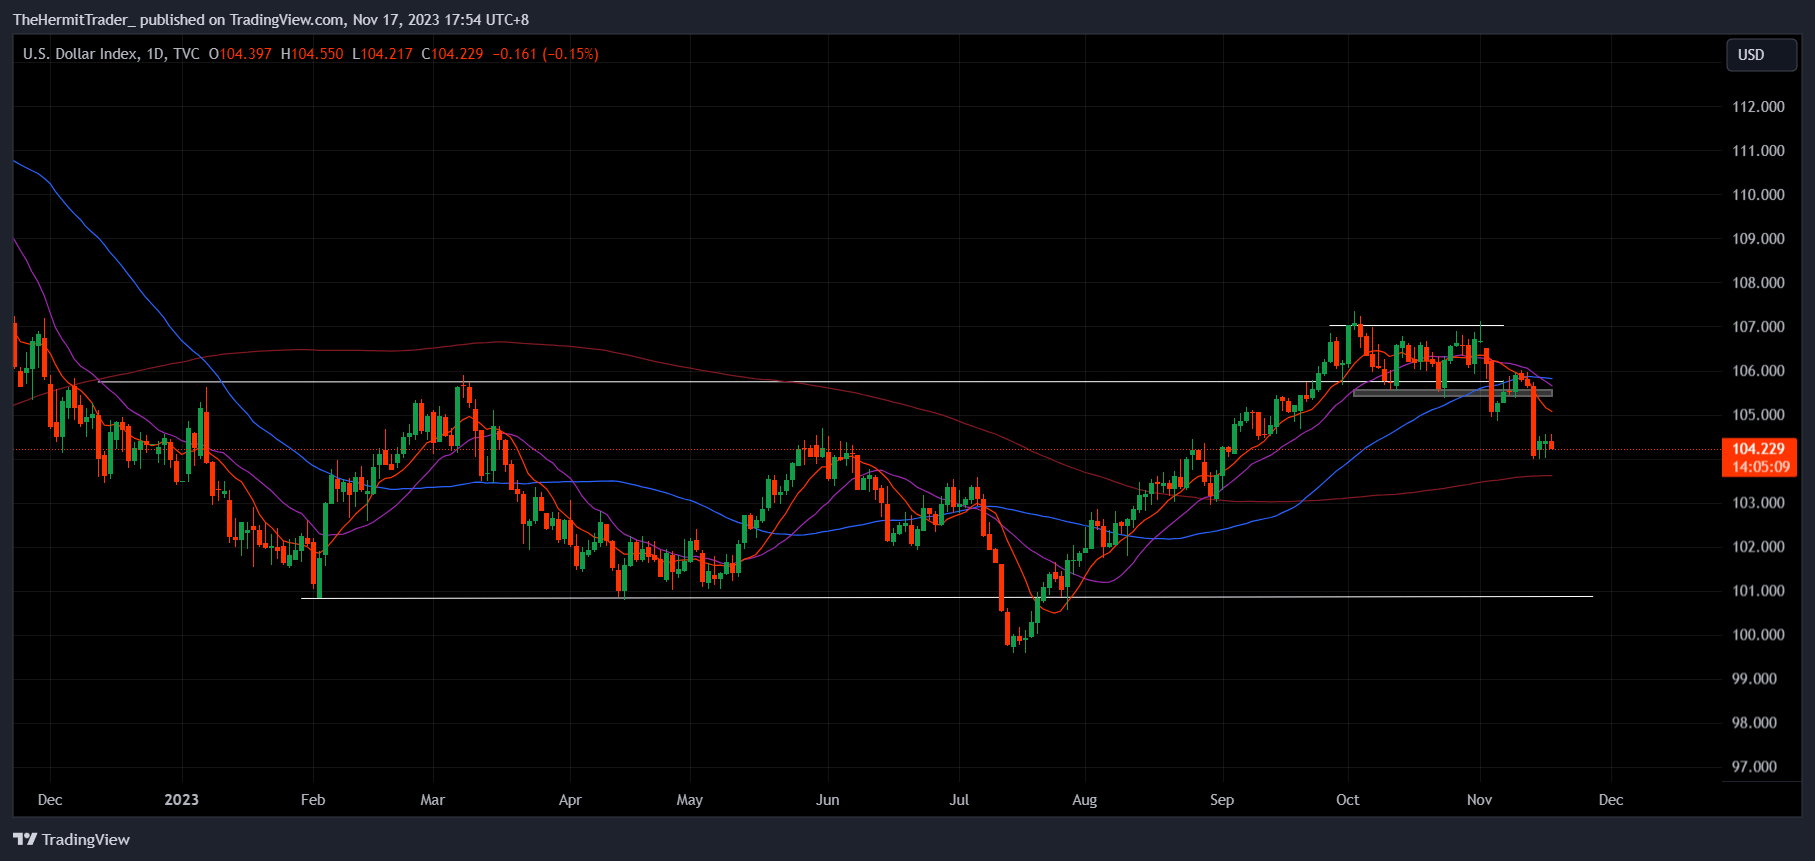
On the daily chart of the Dollar Index, we may observe how the USD briefly broke out higher from its multi-month range when it took out the 106 pivot back in September.
Daily Chart:
However, there was a distinct lack of follow through higher. The USD was rangebound and crashed back within the range after US inflation data.
As the saying goes, "From false moves come fast moves in the opposite direction". I now expect the Dollar Index to trade down to the 100-101 level.
Simply put, the USD saw its sharpest sell-off in close to a year at a pivotal level. The magnitude of the drop and the importance of the level it dropped from tells me the USD's uptrend is most likely over.
I would be very surprised if the USD recovers from its post-CPI drop.
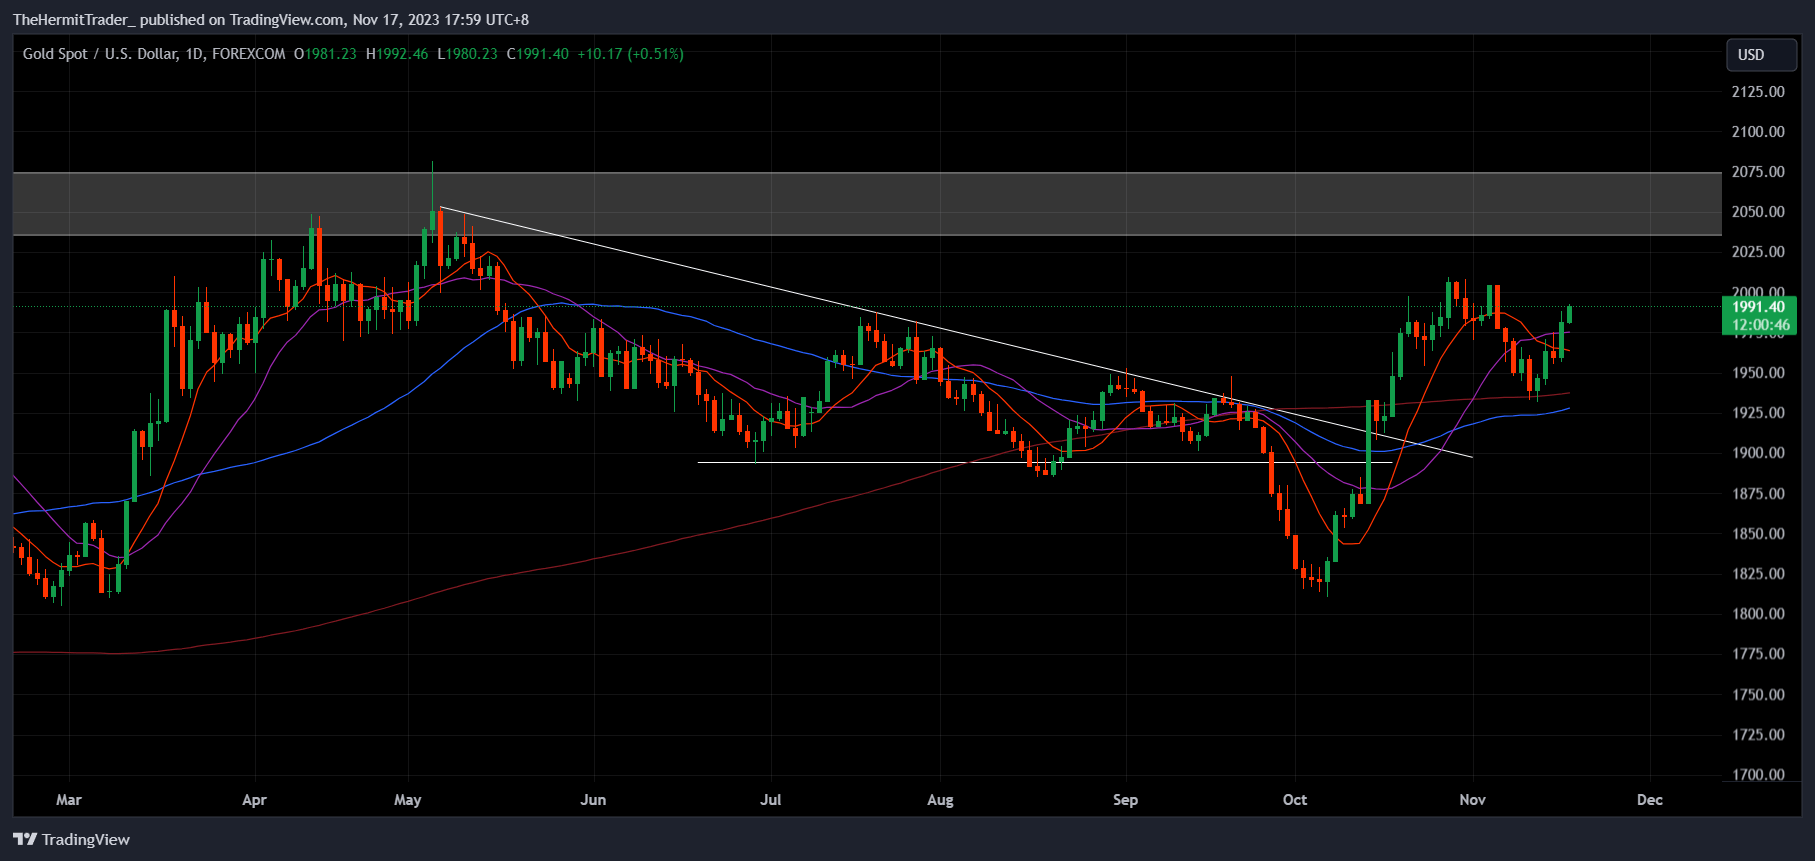
Gold ready to take out $2,050 key level against USD
Gold's daily chart shows a failed breakdown from a descending wedge pattern. The failed breakdown took place in September, when prices broke below the $1,895 pivot.
The subsequent swift reversal higher shows the potential explosiveness of a failed breakdown.
Daily Chart: Gold
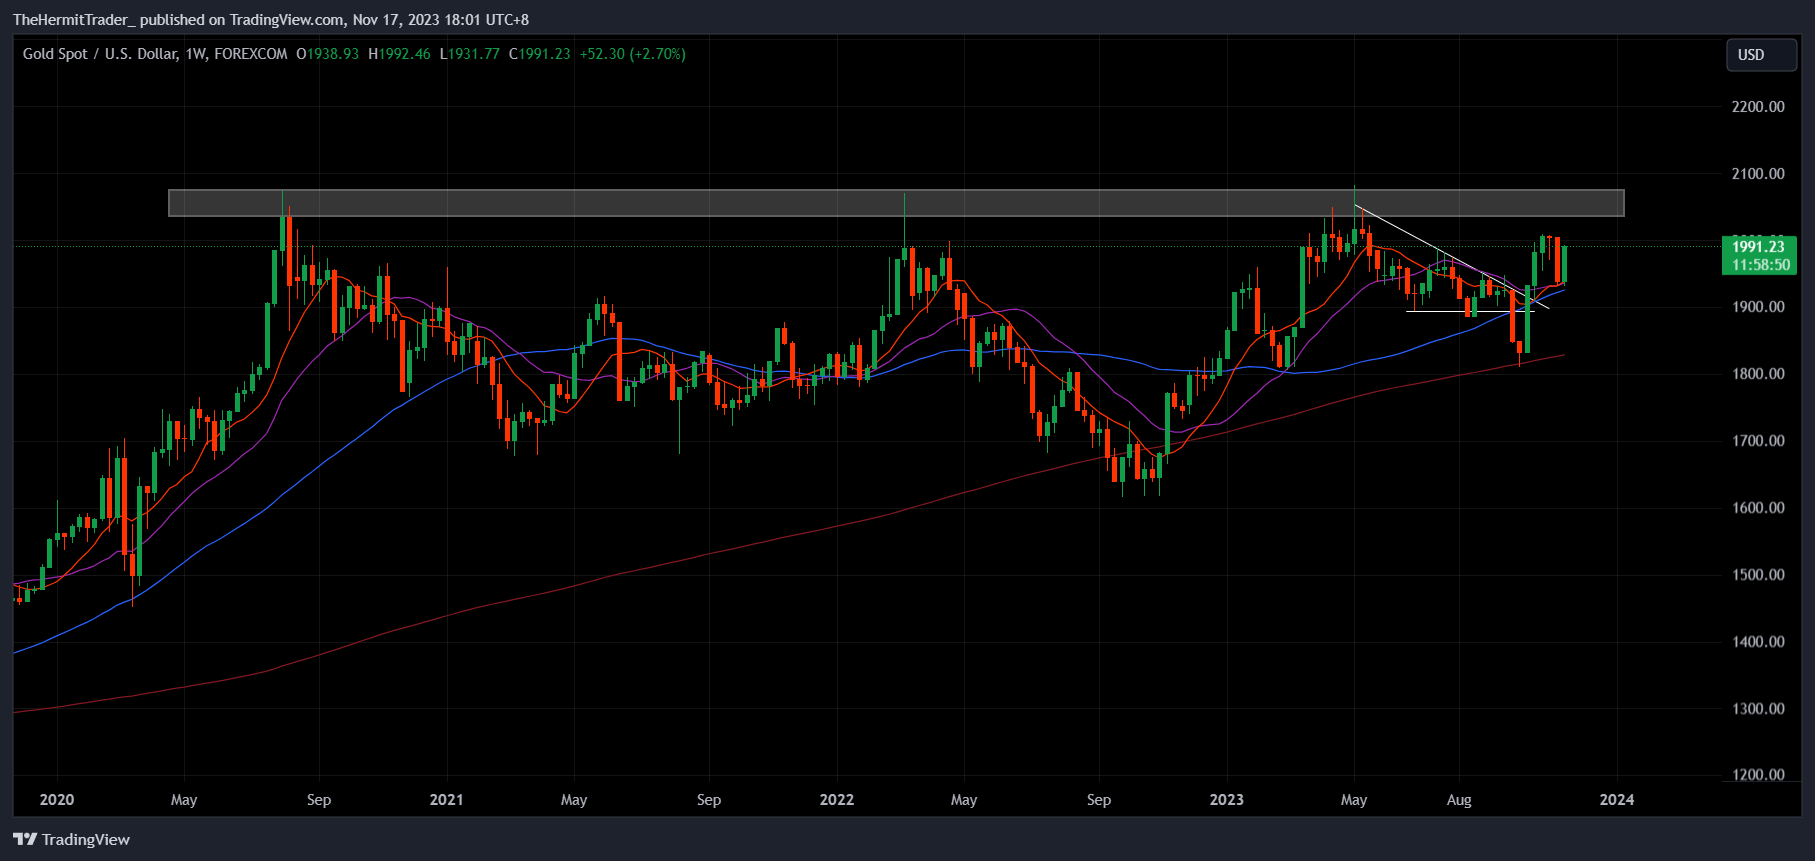
On a grander scale, looking at the weekly chart, gold has been building a massive base since August 2020. This is a huge 3+ year base, with the key breakout pivot at $2,050.
Gold has struggled to break this level on three occasions, but I think it will succeed in the upcoming weeks, looking at the overall price action.
If gold makes a new all-time high against the USD, I believe this will mean we are entering a secular bull market in precious metals.
Weekly Chart: Gold
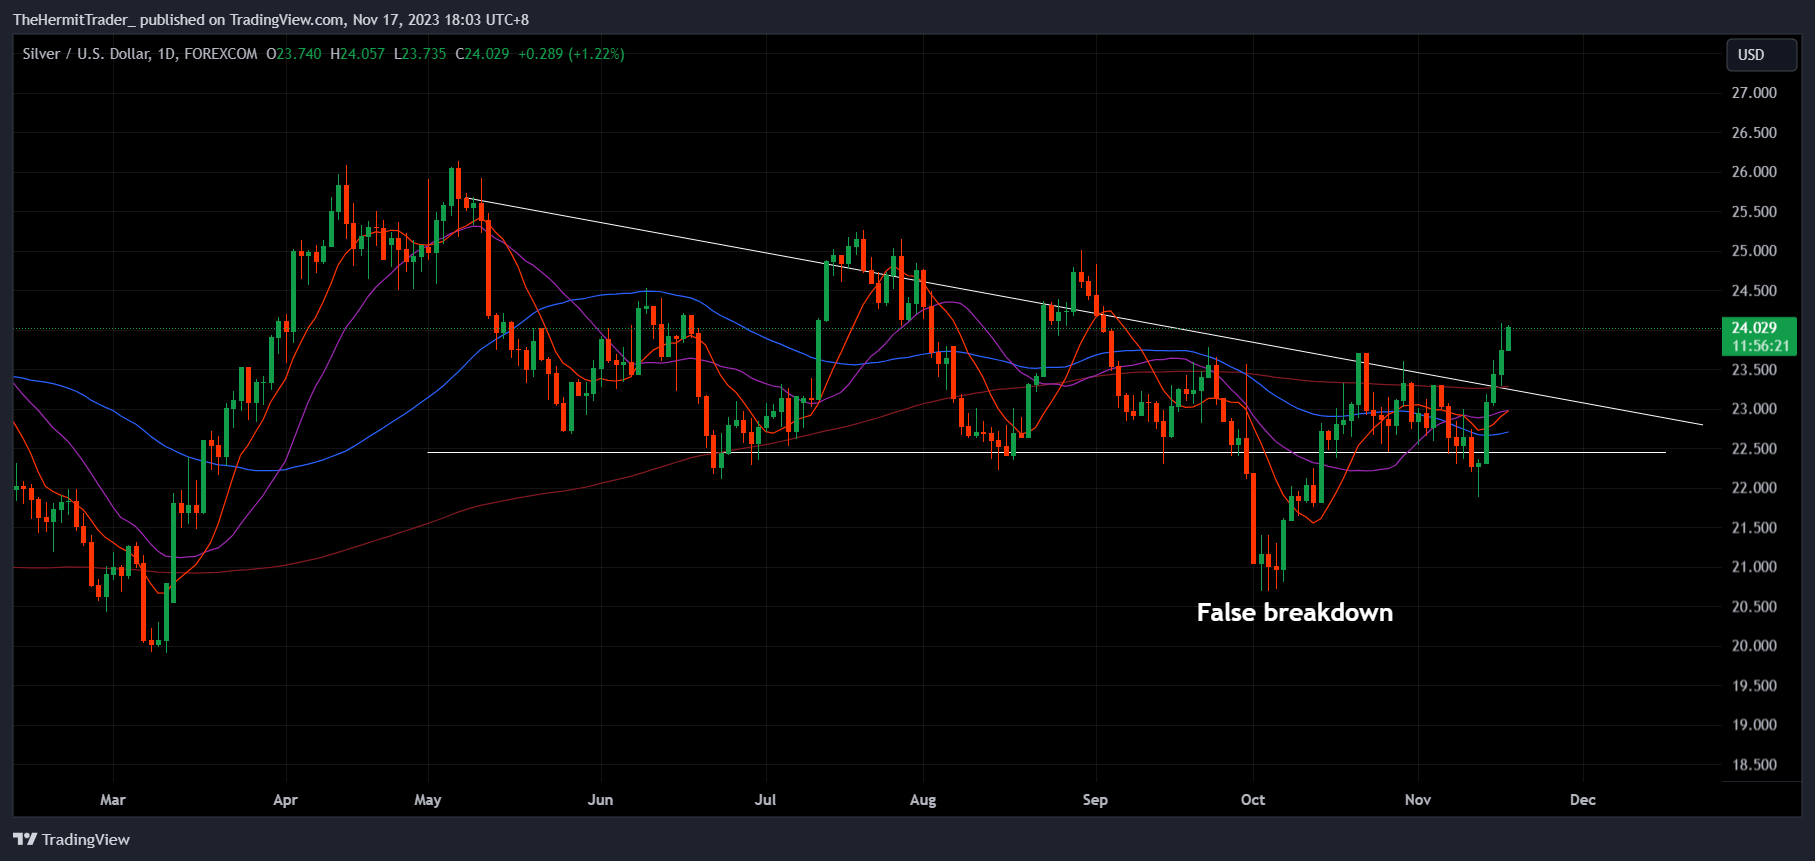
Higher-beta Silver to outperform in a precious metals bull market
From the daily chart of silver, we may observe that similar to gold, silver has recovered from a false breakdown from a descending wedge pattern.
It is now seeing a swift reversal higher.
Daily Chart: Silver
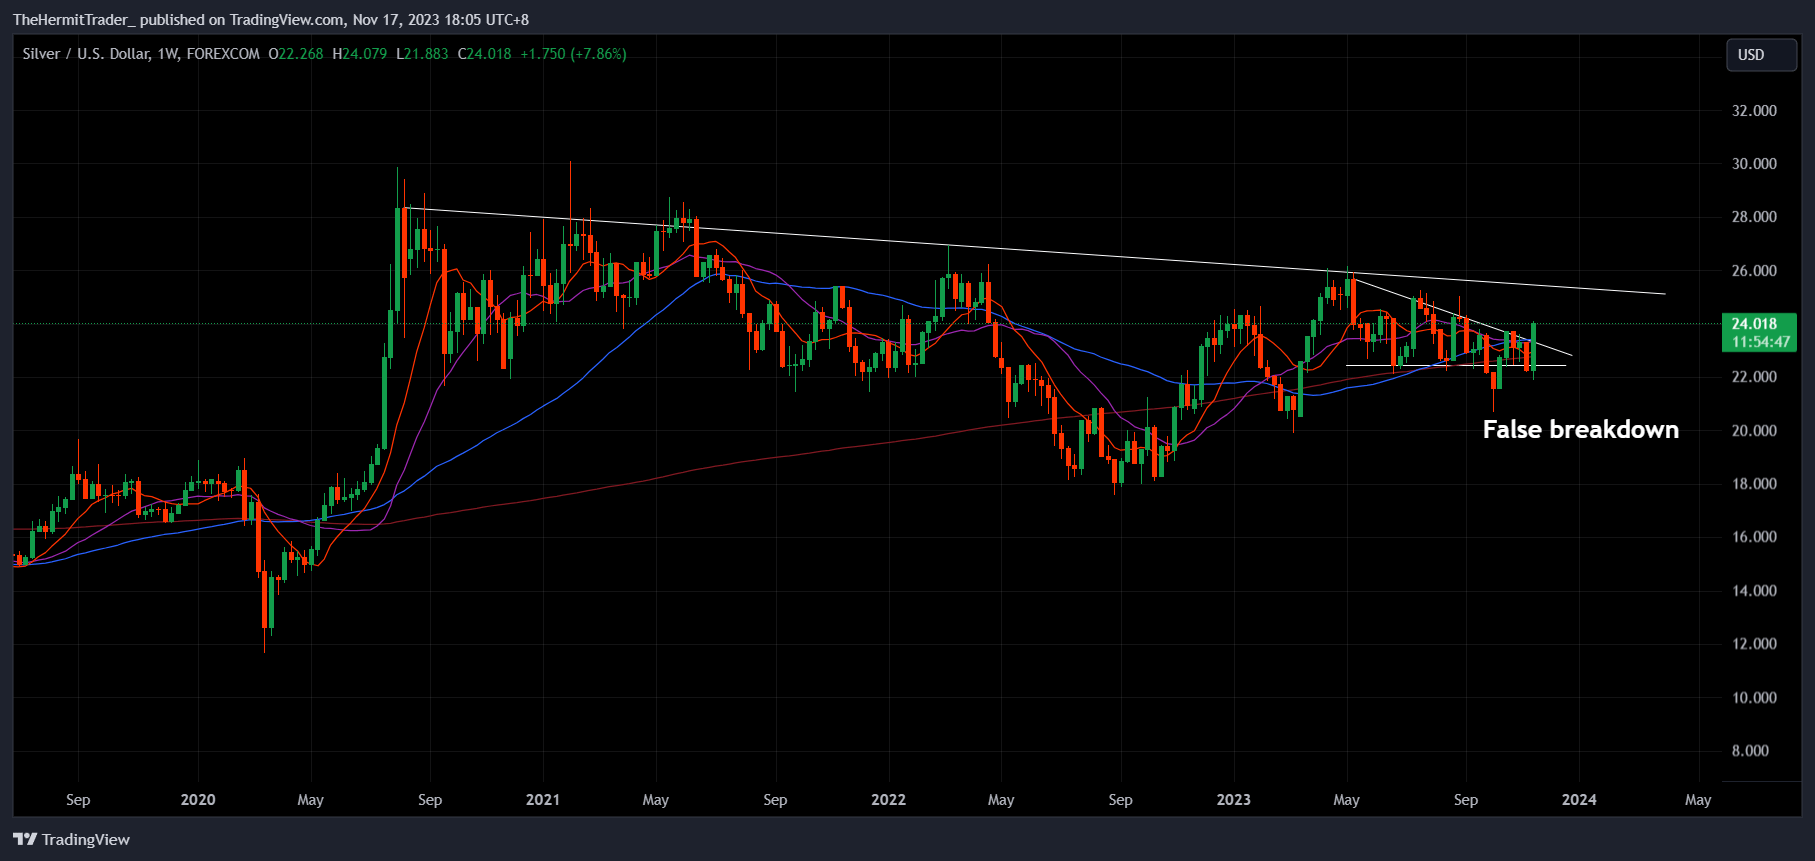
From the longer-term weekly chart, we may observe that silver is also building a massive 3-year base, very similar to gold.
I see potential for silver to take out the overhead downtrend resistance, and then make a move to the $30 psychological level.
Weekly Chart: Silver
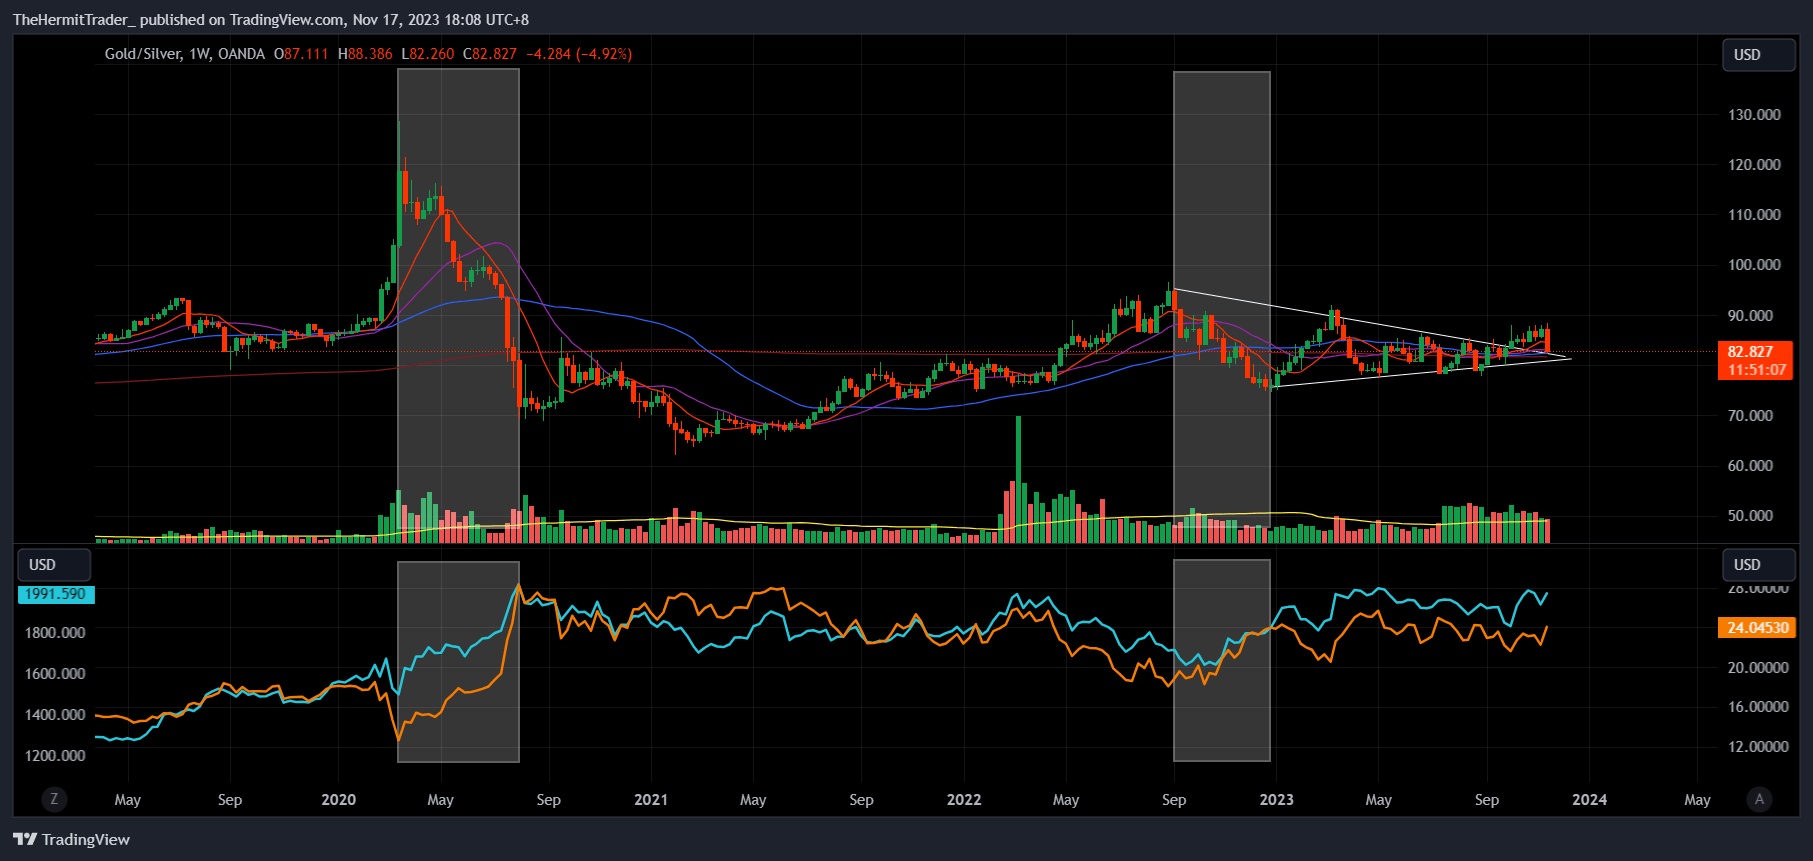
In precious metals bull markets, characterised by both gold and silver seeing strong rallies, silver tends to outperform gold, which means a down trending gold-to-silver ratio.
I have highlighted the two periods in the past three years where precious metals went on multi-week rallies.
Weekly Chart: Gold-to-silver ratio (above) vs Gold (below in blue) and Silver (below in orange)
As such, I prefer silver over gold as I believe there are strong odds that precious metals are about to enter a secular bull market, especially if gold breaks above $2,050.
This bull market is expected to be stronger than what we saw in 2020 and 2022.
This is because we will potentially see gold and silver breakout from huge three-year bases, which forces the market to adjust to this development after years of rangebound price action.
The larger the base, the stronger the subsequent breakout.
We are currently at a point where gold and silver have yet to be breakout from their big bases. I would suggest getting long exposure to both of them, especially silver.
If and when the breakouts do happen, prices can be very volatile, and it might be difficult to land good entries.
If prices of gold and silver lose their post-CPI gains, then the charts would have soured, and my bull thesis on precious metals is likely wrong.
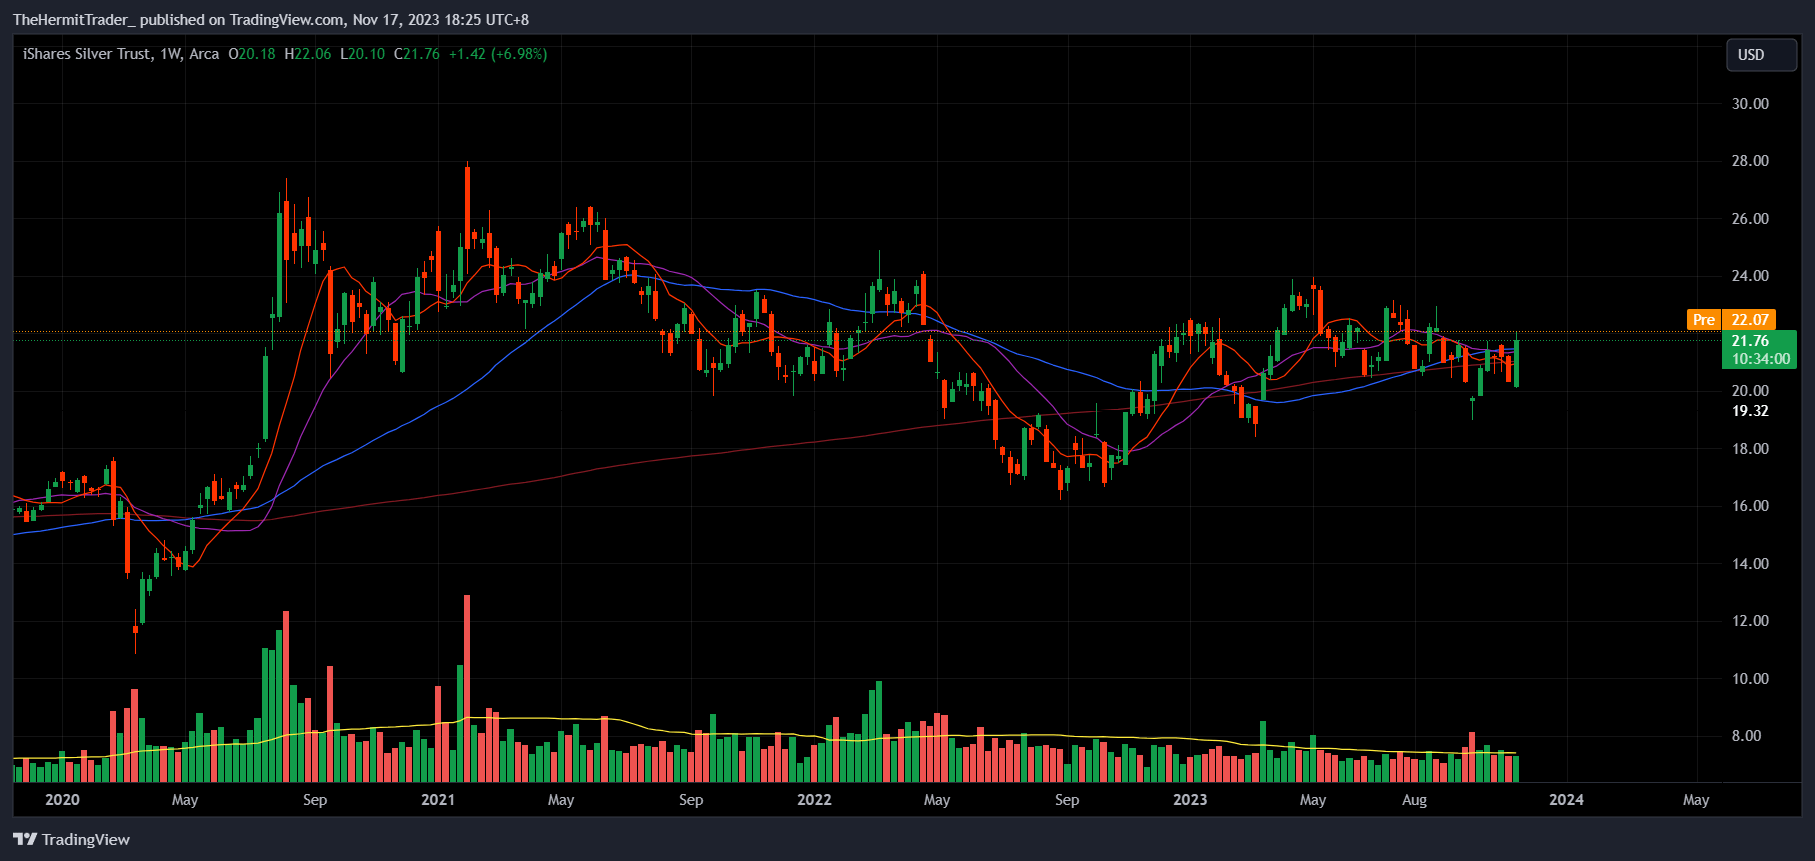
Investors can consider a long position in iShares Silver Trust ((SLV)), which aims to reflect the price performance of silver.
Weekly Chart: SLV
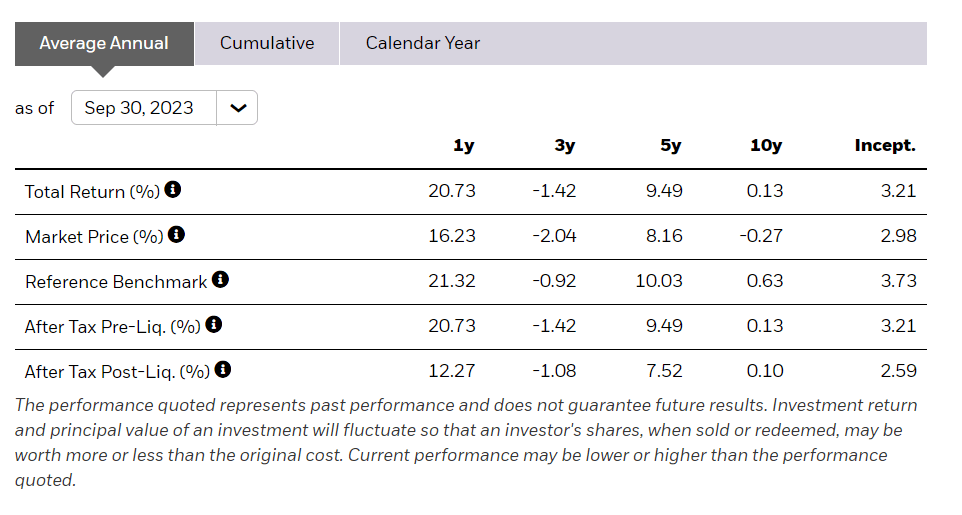
There is little tracking error in SLV's performance relative to silver's spot price.
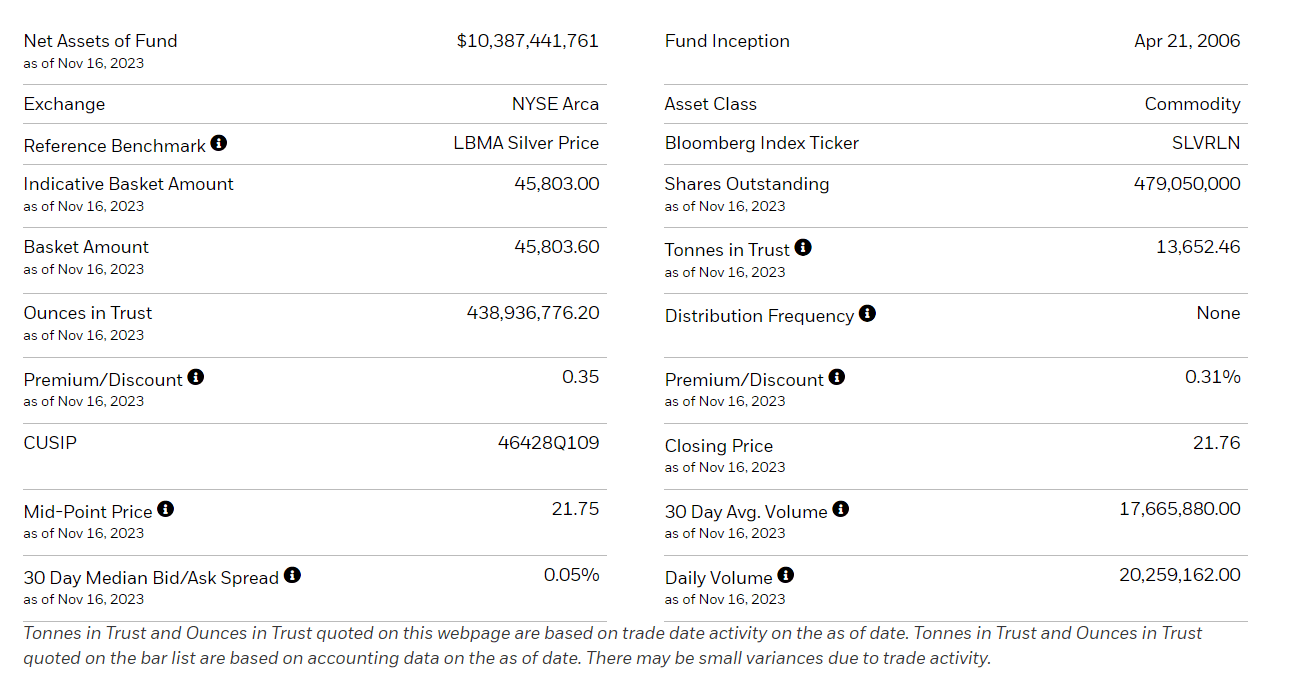
The 30-day average volume for the ETF is more than 17 million shares, which represents an average daily traded volume of close to $370 million, given the closing price of $21.76. This is a very liquid ETF.
For further details see:
Precious Metals Look Primed For Secular Bull Market (Technical Analysis)