TECH - Q3 2023 Earnings: Where Street Earnings Are Too High And Who Should Miss
2023-10-12 14:55:05 ET
Summary
- Wall Street analysts are overly optimistic about third-quarter earnings expectations for most S&P 500 companies.
- 71% of S&P 500 companies have Street Earnings higher than Core Earnings, with over 40% overstating by more than 10%.
- Five S&P 500 companies, including Bio-Techne, are likely to miss 3Q23 earnings due to overstated Street EPS estimates.
Wall Street analysts are too bullish on third quarter earnings expectations for most S&P 500 companies. Although down from record highs set in early 2021, the percentage of S&P 500 companies whose Street EPS exceeds our Core EPS remains high at 71%.
This report shows:
- The frequency and magnitude of overstated Street Earnings in the S&P 500 and
- Five S&P 500 companies likely to miss 3Q23 earnings.
Street EPS Are Higher Than Core EPS for 357 S&P 500 Companies
For 357 companies in the S&P 500, or 71%, Street Earnings are higher than Core Earnings in the trailing twelve months ((TTM)) ended 2Q23. In the TTM ended 1Q23, Street Earnings were overstated for 347 companies.
The more interesting trend, however, is in the percentage of the S&P 500 where Street Earnings overstate Core Earnings by more than 10%. That number rose to over 40% (208 companies), which is up from 38% (191 companies) in the TTM ended 1Q23.
Those 208 companies make up 30% of the market cap of the S&P 500 as of 10/2/23, which is up from 28% of the market cap in 1Q23, measured with TTM data in each quarter. See Figure 1.
Figure 1: Overstated Street Earnings by >10% as % of Market Cap: 2012 through 10/2/23
New Constructs, LLC
Source: Company filings.
The 357 companies with overstated (by any amount) Street Earnings make up 70% of the market cap of the S&P 500 as of 10/2/23, which is down from 72% in 1Q23, measured with TTM data in each quarter.
Figure 2: Overstated Street Earnings as % of Market Cap: 2012 through 10/2/23
New Constructs, LLC
Source: Company filings.
When Street Earnings are higher than Core Earnings, they are overstated by an average of 24%, per Figure 3.
Figure 3: Street Earnings Overstated by 24% on Average in TTM Through 2Q23
New Constructs, LLC
Source: Company filings.
Five S&P 500 Companies Likely to Miss 3Q23 Earnings
Figure 3 shows five S&P 500 companies likely to miss calendar 3Q23 earnings because their Street EPS estimates are overstated. Below, we detail the hidden and reported unusual items that caused the overstated Street Earnings in the TTM ended 2Q23 for Bio-Techne Corp ( TECH ). Because investors and analysts tend to anchor their earnings projections to historical results, errors in historical Street EPS lead to errors in Street EPS estimates.
Figure 4: Five S&P 500 Companies Likely to Miss 3Q23 EPS Estimates
New Constructs, LLC
Sources: Company filings and Zacks. *Assumes Street Distortion as a percent of Core EPS is the same for 3Q23 EPS as for TTM ended 2Q23.
Bio-Techne: The Street Overestimates Earnings for 3Q23 by 32%
The Street's 3Q23 EPS estimate of $0.45/share for Bio-Techne is $0.15/share higher than our estimate for 3Q23 Core EPS of $0.30/share. Large gains on investments and acquisition-related gains drive much of the difference between Street and Core EPS estimates. After removing these non-recurring gains, our analysis of the entire S&P 500 reveals Bio-Techne as one of the companies most likely to miss Wall Street analysts' expectations in its calendar 3Q23 earnings report.
Bio-Techne's Earnings Distortion Score is Strong Miss and its Stock Rating is Very Unattractive, in part due to its -2% free cash flow ((FCF)) yield, price-to-economic book value (PEBV) ratio of 5.3, and market-implied growth appreciation period ((GAP)) of >100 years. Bio-Techne's economic book value, or no growth value, is just $13/share, or 81% below its current price.
Below, we detail the unusual gains that materially boost and distort Bio-Techne's TTM 2Q23 Street and GAAP earnings. After removing all unusual items, we find that Bio-Techne's TTM 2Q23 Core EPS is $1.42/share, which is lower than TTM 2Q23 Street EPS of $1.68/share and GAAP EPS of $1.76/share.
Figure 5: Comparing Bio-Techne's GAAP, Street, and Core Earnings: TTM Through Calendar 2Q23
New Constructs, LLC
Sources: Company filings.
Figure 5 shows the differences between Bio-Techne's TTM Core Earnings and GAAP Earnings, so readers can audit our research. Given the small difference between GAAP and Street Earnings, the adjustments that drive the difference between Core and Street Earnings are likely mostly the same.
Figure 6: Bio-Techne's GAAP Earnings to Core Earnings Reconciliation: TTM Calendar 2Q23
New Constructs, LLC
Sources: Company filings.
More details:
Total GAAP Earnings Distortion of $0.35/share, which equals $56 million, is comprised of the following:
Hidden Unusual Gains, Net = $0.11/share, which equals $18 million and is comprised of:
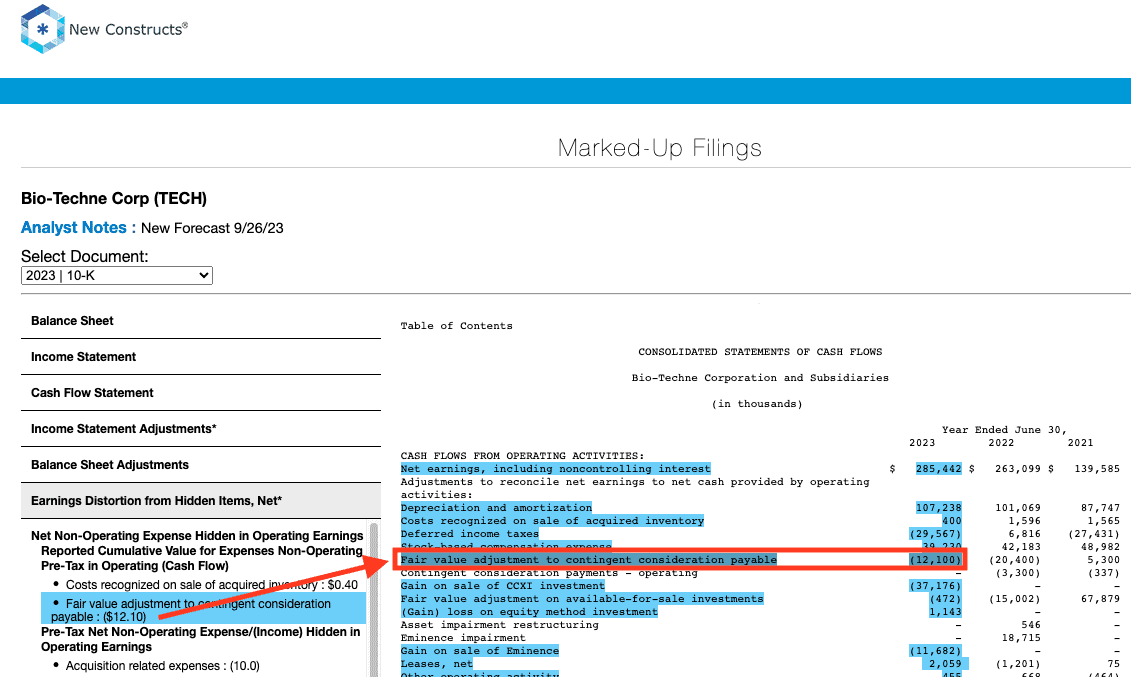
- $12 million gain in the fair value adjustment to contingent consideration payable - Page 50 fiscal 2023 10-K.
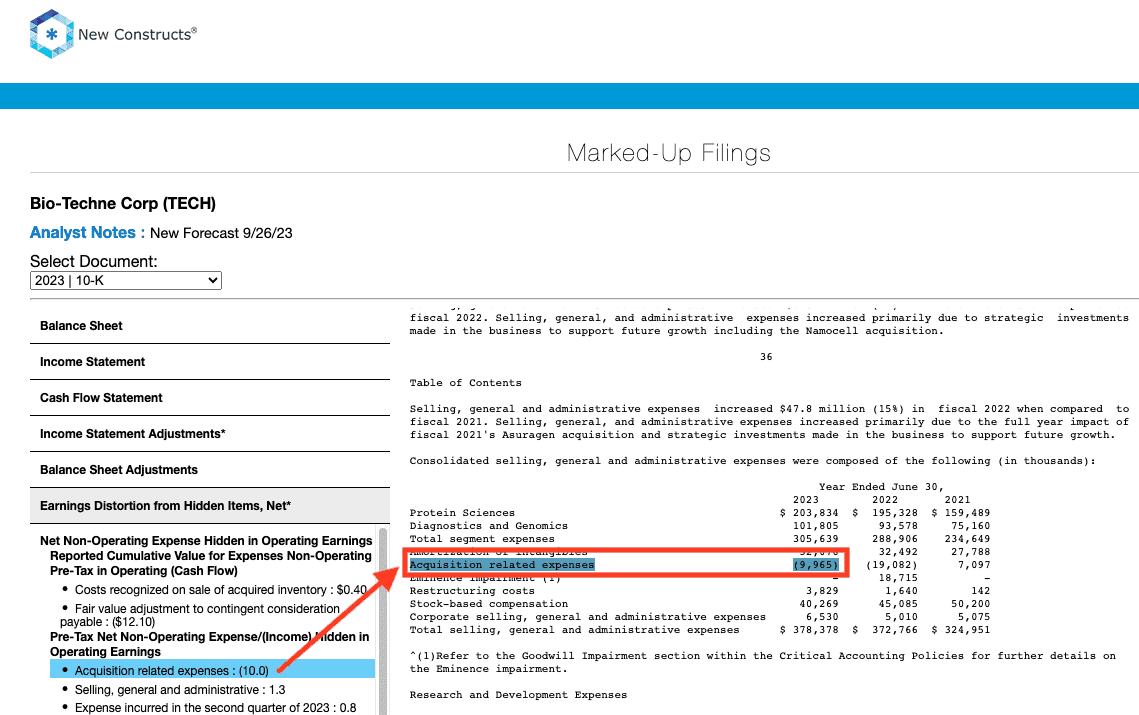
- $10 million in acquisition-related gains bundled in selling, general, and administrative - Page 37 fiscal 2023 10-K.
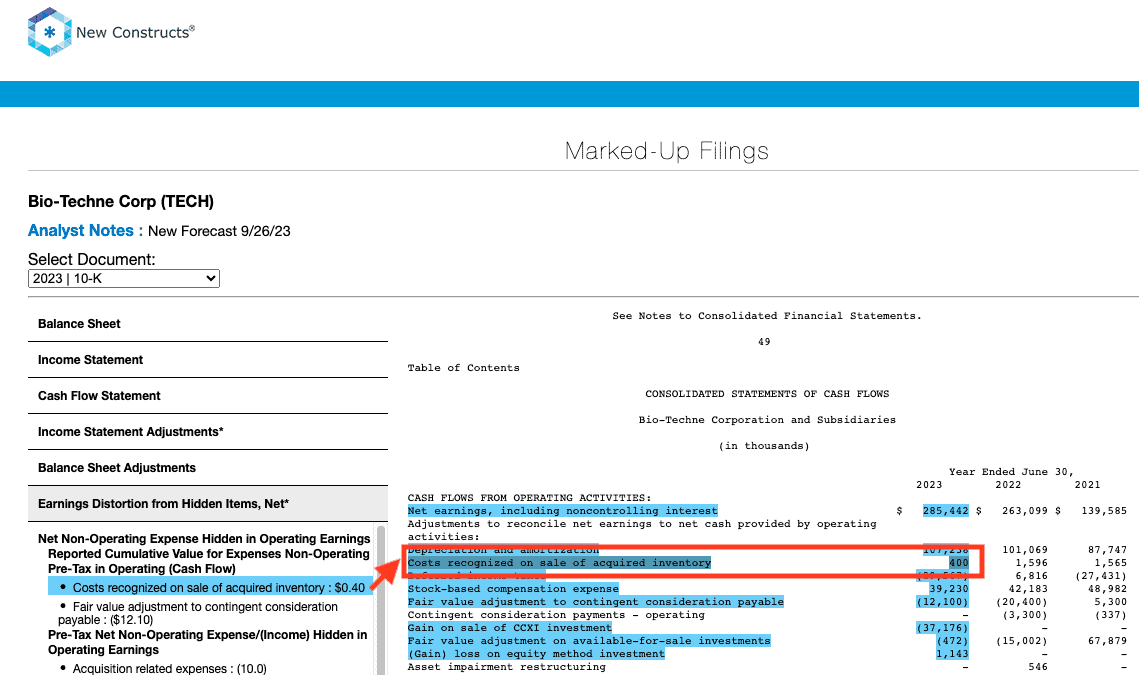
- -$0.4 million in costs recognized on the sale of acquired inventory - Page 50 fiscal 2023 10-K.
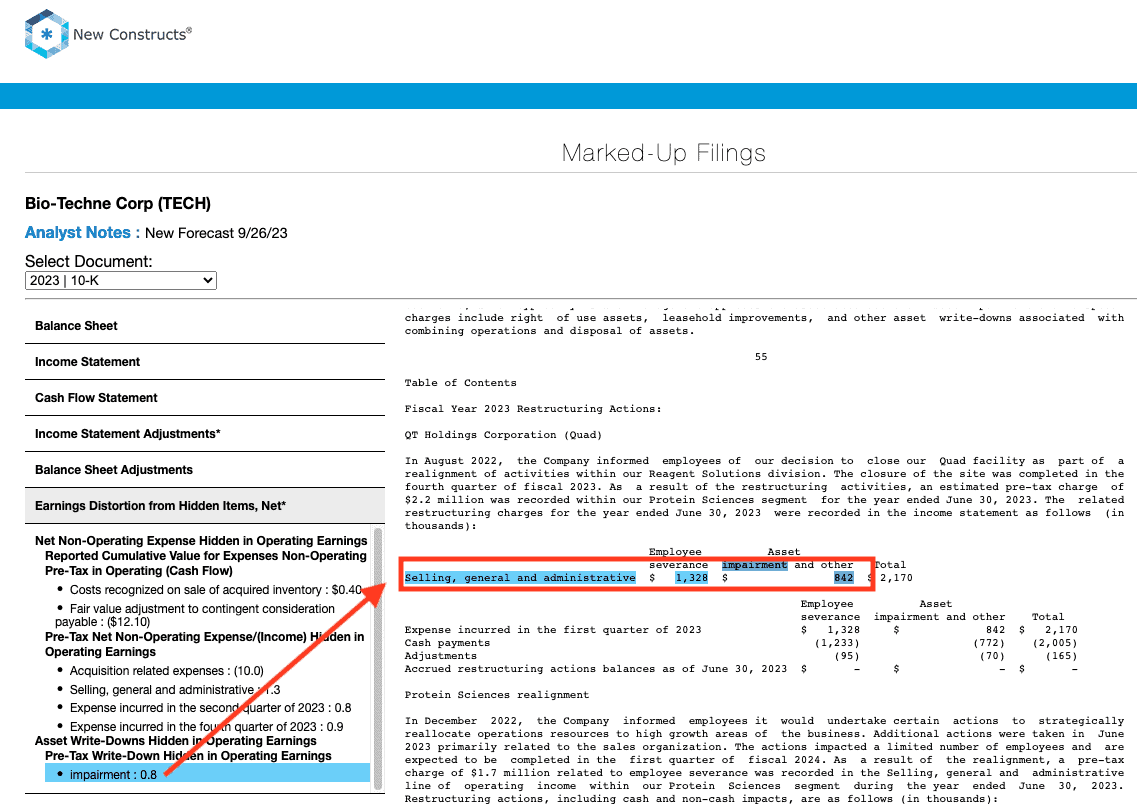
- -$0.8 million in asset impairment charges bundled in selling, general, and administrative - page 56 fiscal 2023 10-K.
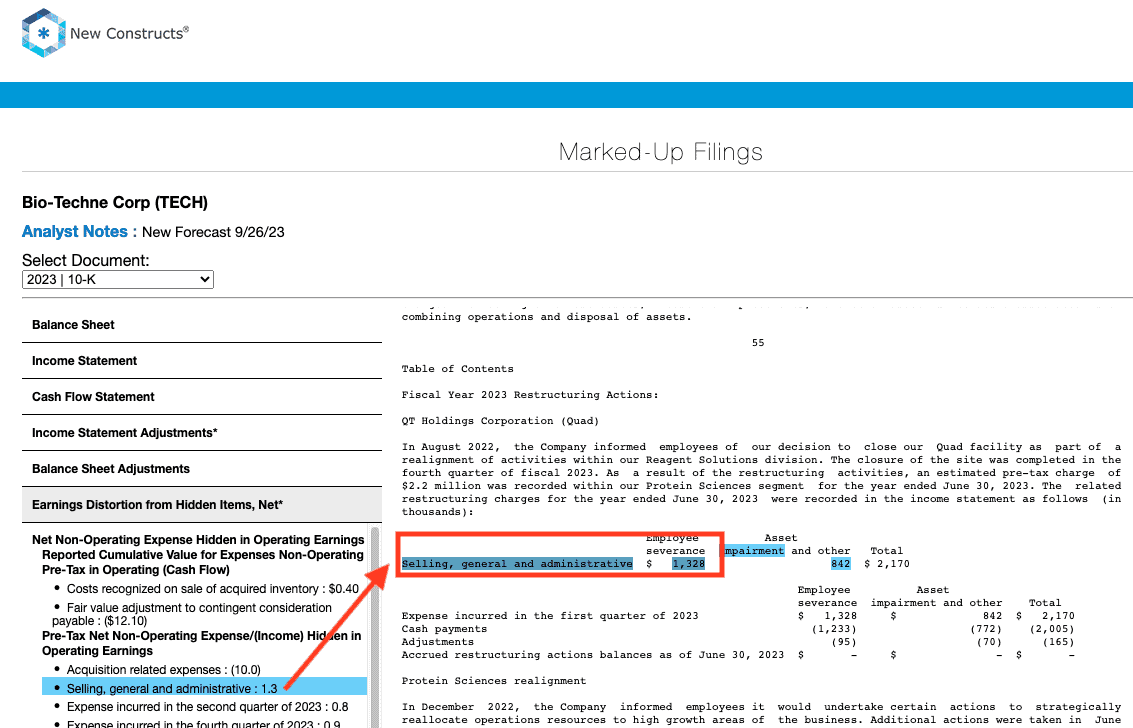
- -$1.3 million in severance charges bundled in selling, general, and administrative - Page 56 fiscal 2023 10-K.
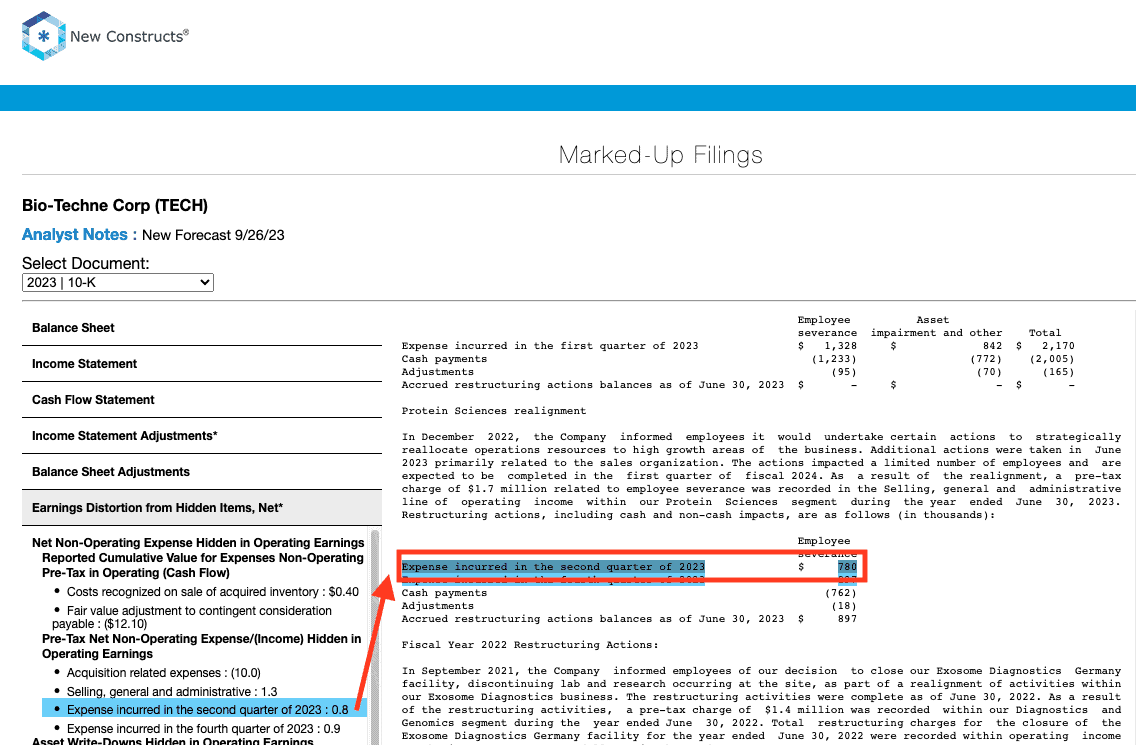
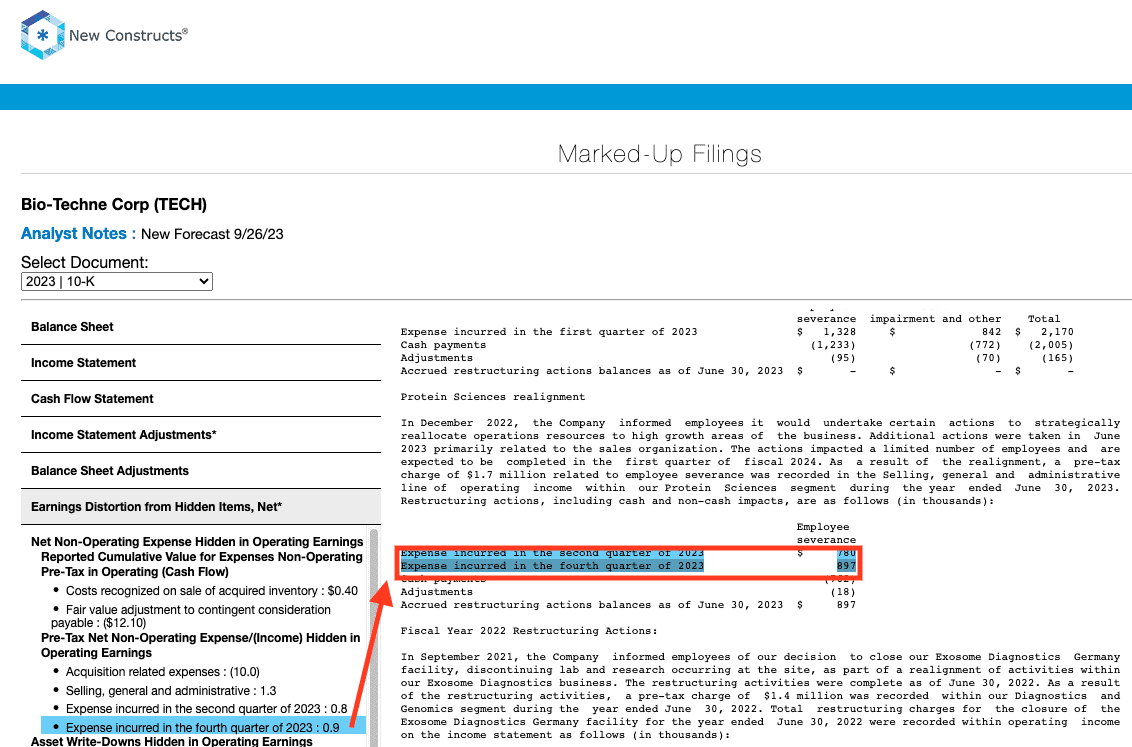
- -$1.7 million in restructuring expense in the TTM based on:
- -$0.8 million incurred in fiscal second quarter of 2023 - Page 56 fiscal 2023 10-K.
- -$0.9 million incurred in fiscal fourth quarter of 2023 - Page 56 fiscal 2023 10-K.
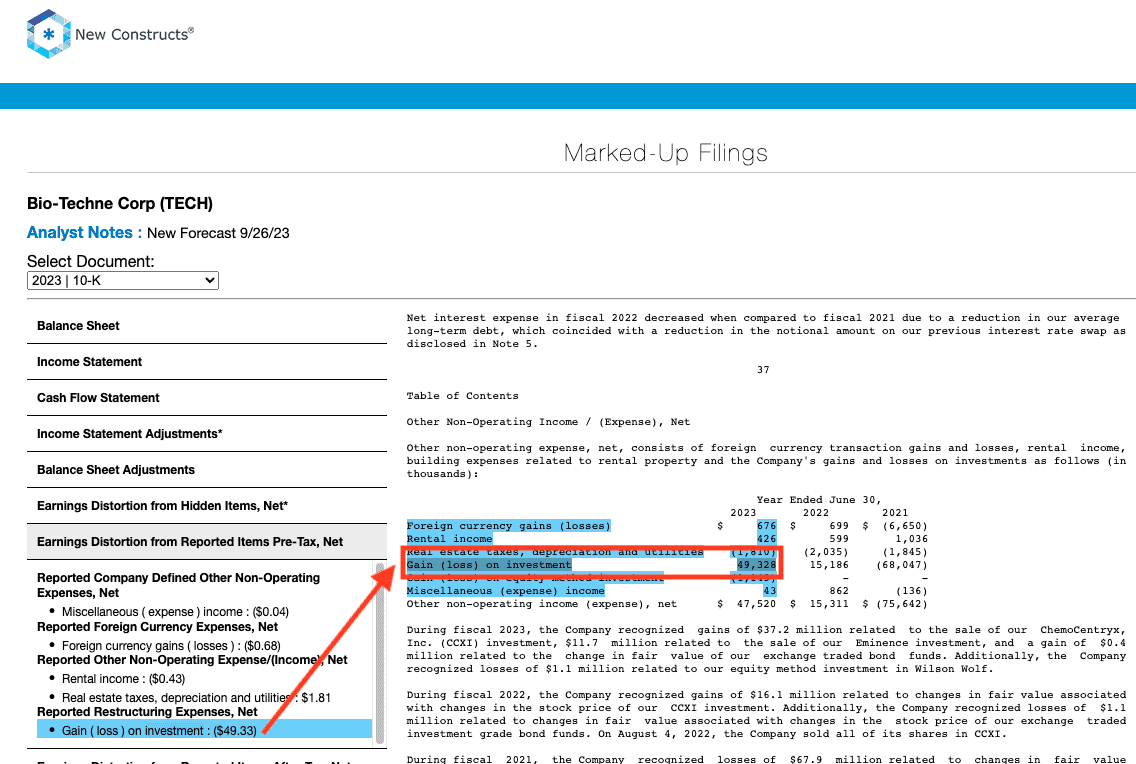
Reported Unusual Gains Pre-Tax, Net = $0.30/share, which equals $49 million and is comprised of:
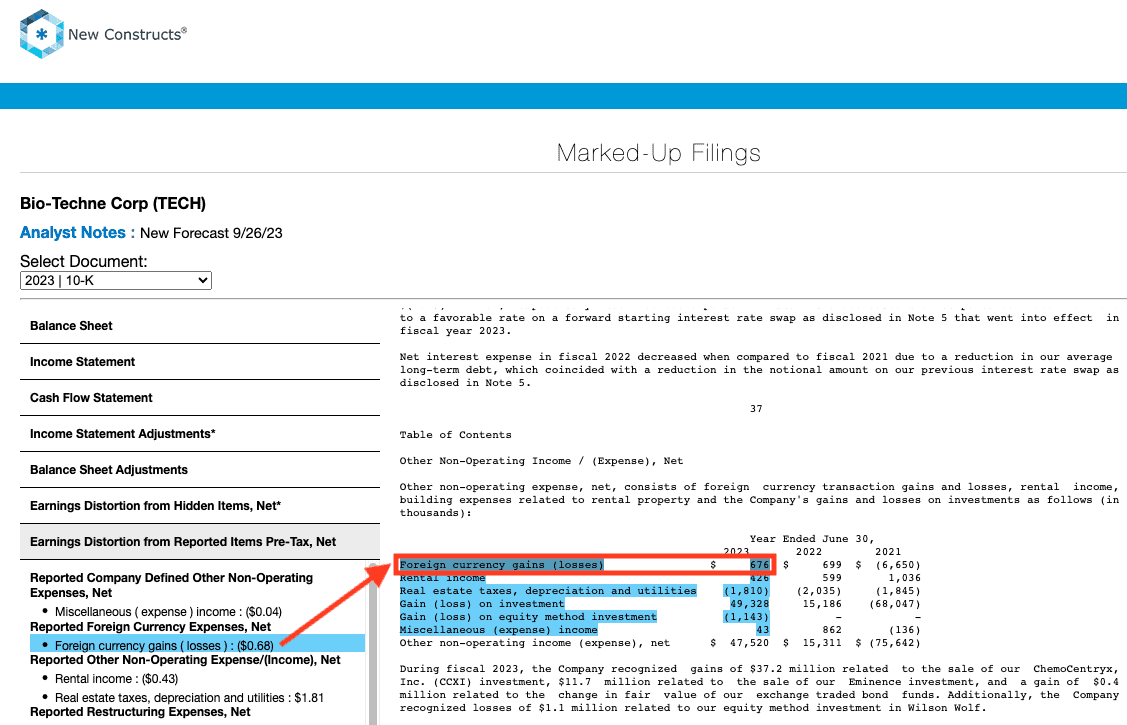
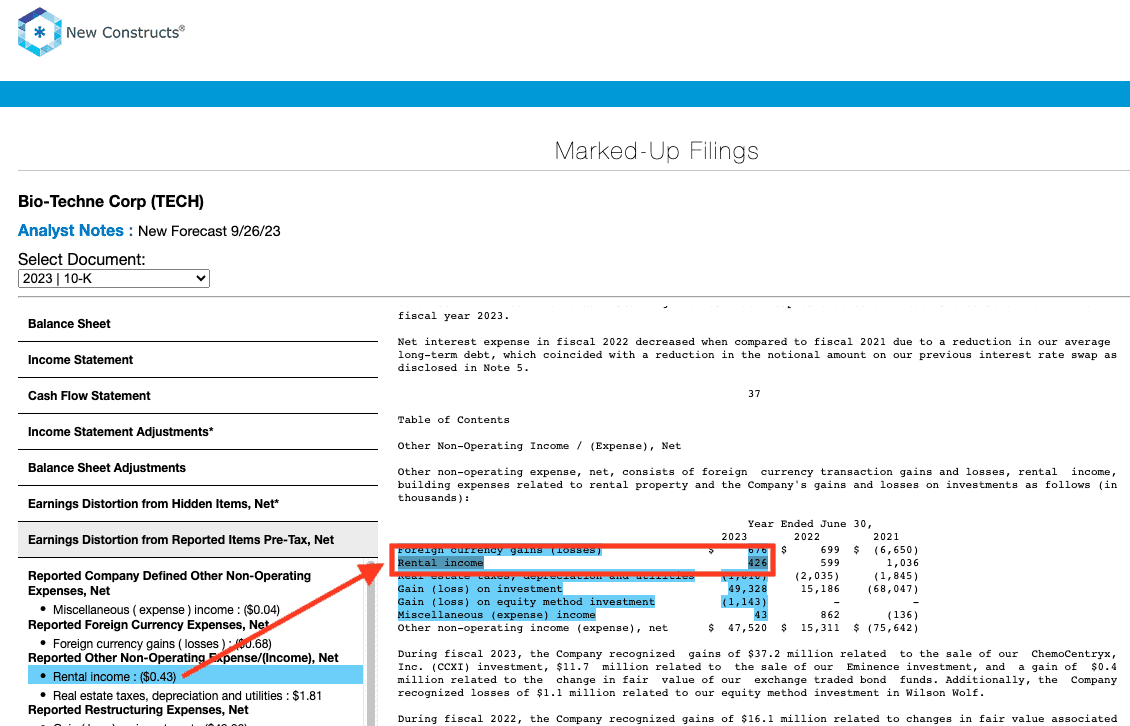
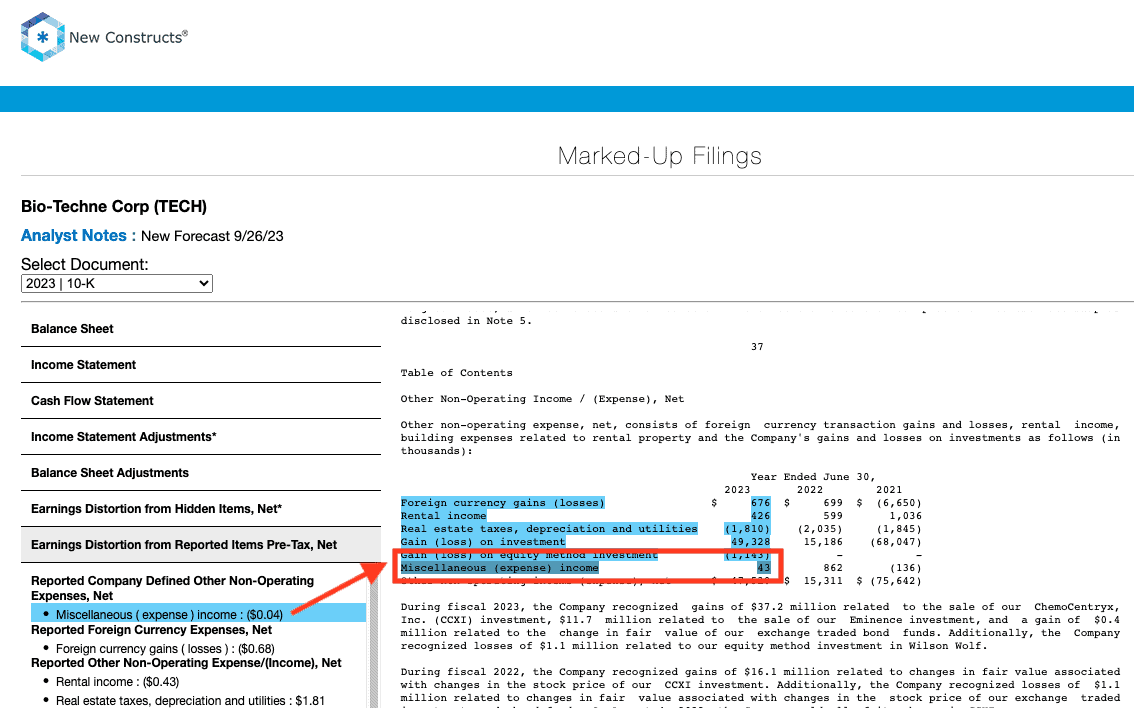
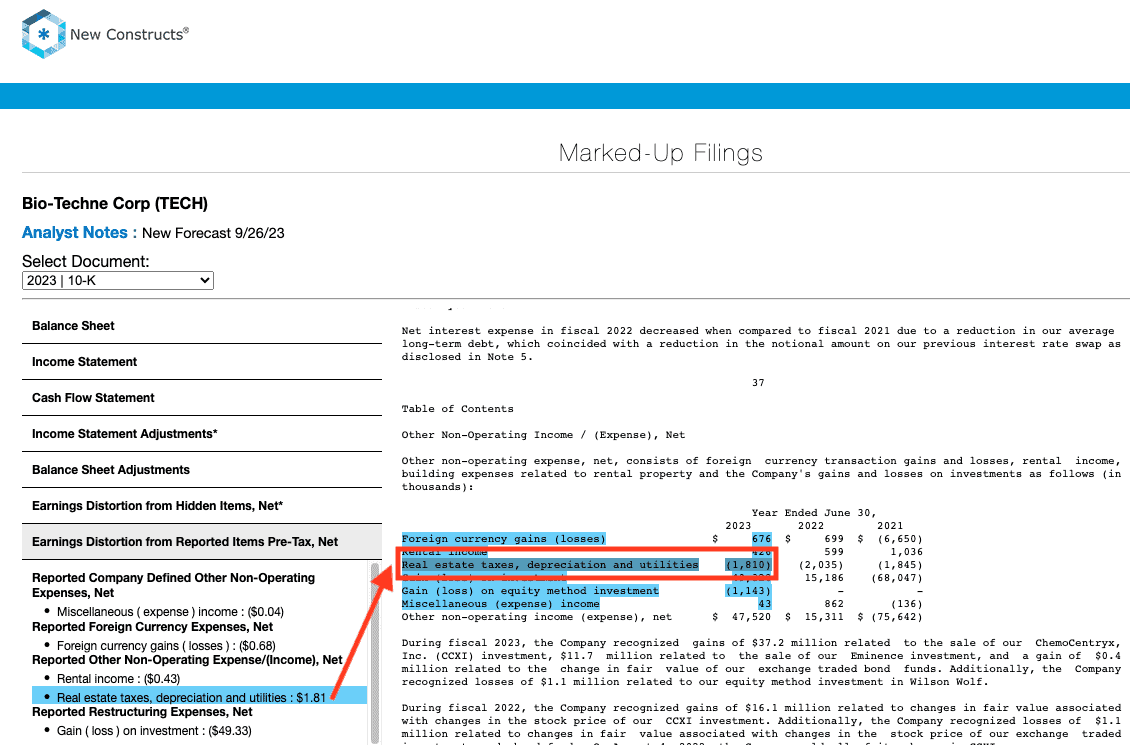
- $49 million gain on investment bundled in other non-operating expenses in the fiscal 2023 10-K.
- $0.7 million in foreign currency gains in the fiscal 2023 10-K.
- $0.4 million in rental income in the fiscal 2023 10-K.
- $0.04 million in miscellaneous income in the fiscal 2023 10-K.
- -$1.8 million in real estate taxes, depreciation, and utilities expenses bundled in "other" in the fiscal 2023 10-K.
Tax Distortion = -$0.06/per share, which equals -$10 million.
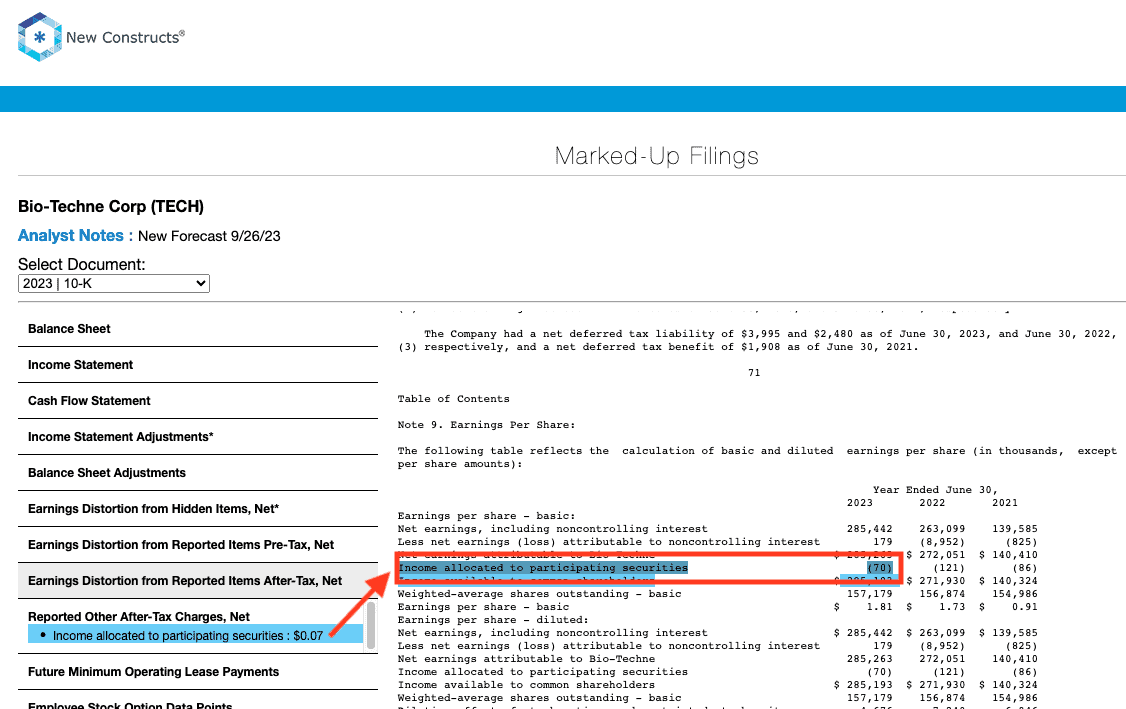
Reported Unusual Expenses After-Tax, Net = <-$0.01/share, which equals $70,000 and is comprised of:
- -$0.07 million in income allocated to participating securities in fiscal 2023 10-K.
The $0.54/share of Street Distortion in the TTM-ended calendar 2Q23 highlights that Core Earnings account for a more comprehensive set of unusual items when calculating Bio-Techne's true profitability.
Disclosure: David Trainer, Kyle Guske II, Hakan Salt, and Italo Mendonça receive no compensation to write about any specific stock, style, or theme.
[1] The Journal of Financial Economics features our Core Earnings in Core Earnings: New Data & Evidence.
[2] Street Earnings refer to Zacks Earnings, which are reported to remove non-recurring items using standardized assumptions from the sell-side.
For further details see:
Q3 2023 Earnings: Where Street Earnings Are Too High And Who Should Miss