TLT - QLD: The Rally Continues (Technical And Intermarket Analysis)
2023-04-03 09:49:43 ET
Summary
- The AMI market risk indicator is risk-on since December 2. The NASDAQ 100 had a huge rally in January.
- After a five-week retreat in February, the rally resumed in the second week of March.
- Simulations of the AMI strategy for two NASDAQ 100 ETFs, non-leveraged QQQ and 2X leveraged QLD, are presented.
- The risk-adjusted returns of the 2x leveraged portfolio are not much different than those of the non-leveraged variant.
Thesis
NDX made a sequence of bear market lows since October 12 to the end of the year on December 28. In January it had a huge rally that had stalled in February, but the rally resumed in the second week of March. My thesis is that the current rally will continue in April. I will support the thesis with two arguments, one with Technical Analysis of the [[QQQ]] price chart, and another with Intermarket Analysis using a Market Risk Indicator.
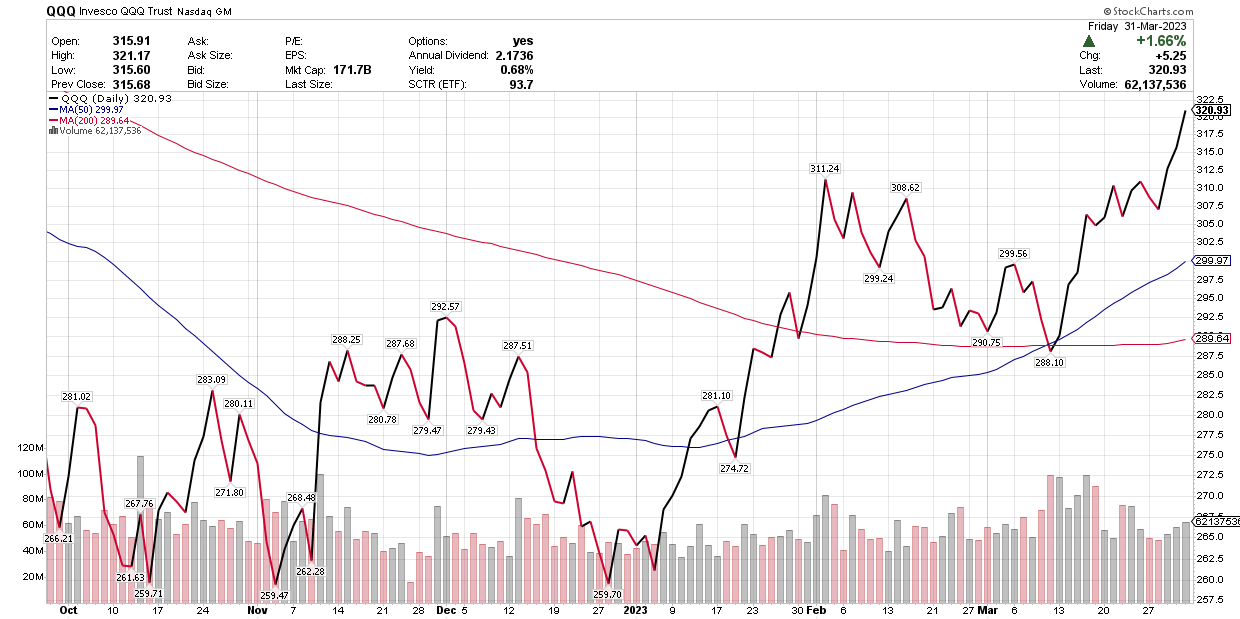
Technical Analysis - Bullish Cross
The QQQ chart shows that the 50-day MA made a bullish cross above the 200-day MA in the last week of January. Currently, the price of QQQ is above both the 50-day and the 200-day MA.
Intermarket Analysis - Momentum Market Risk Indicator is ON
To determine the market state, we evaluate the total return of some assets over an evaluation period. The following four conditions are indicative of a risk-on market:
- r( DBB ) - r( UUP ) > TH1
- r( RCD ) - r( RHS ) > TH2
- r( XLI ) - r( XLU ) > TH3
- r( SLV ) - r( GLD ) > TH4
Based on the returns of the eight ETFs shown above, the market state is classified as (1) risk-on, (2) risk-off, and (3) risk-neutral.
Currently, the first three conditions are currently satisfied and the indicator is risk-on. This indicator has been risk-on since December 2.
AMI Strategy
The Market Risk Indicator is used in my "Adaptive Momentum Investing" marketplace service.
When the markets are risk-on, the strategy is invested 100% in risky assets.
When the markets are risk-off, the strategy invests all the funds in the top one or two ETF from the following list.
['IEI','IEF','TLT','DBC','UUP']
When the markets are risk-NEUTRAL, the strategy invests all the funds equally divided in the assets of the following list.
['XLP','XLV']
Applications
The thesis of this article is that when the markets are in risk-on state, it is more profitable to invest in leveraged funds than in non-leveraged. We will show simulation results made with the Portfolio Visualizer application on two portfolio variants, one investing in QQQ, another in the corresponding 2X leveraged fund QLD.
The Single QQQ Portfolio
Here I will show the simulation of the strategy in managing a simple broad market portfolio, called "Single QQQ".
When the markets are risk-on, the strategy is invested 100% in QQQ.
The table below shows the summary performance of the portfolios for simulations from 11/1/2007 to 3/31/2023.
| Portfolio |
| CAGR |
| stdev |
| maxDD |
| Sharpe R |
| Sortino R |
| Single QQQ |
| 26.75% |
| 14.15% |
| -10.02% |
| 1.71 |
| 4.39 |
| QQQ B&H |
| 13.10% |
| 19.40% |
| -49.74% |
| 0.70 |
| 1.07 |
More details of the performance can be seen in the following PDF report generated by the Portfolio Visualizer application.
Below are three charts: (1) portfolio growth, (2) the chart bar of annual returns and (3) the chart of drawdowns.
Single QQQ portfolio growth:
PortfolioVisualizer.com
Single QQQ annual returns:
PortfolioVisualizer.com
Single QQQ drawdowns:
PortfolioVisualizer.com
The Single QLD Leveraged Portfolio
Exactly the same strategy is applied to a portfolio that invests 100% in [[QLD]], the 2X leveraged ETF of the NASDAQ 100 index. This portfolio invests equally in [[XLP]] and [[XLV]] during risk-NEUTRAL states, and in the same top risk-OFF asset as the Single QQQ portfolio.
The table below shows the summary performance of the portfolios for simulations from 11/1/2007 to 3/31/2023.
| Portfolio |
| CAGR |
| stdev |
| maxDD |
| Sharpe R |
| Sortino R |
| Single QLD |
| 41.27% |
| 22.42% |
| -19.51% |
| 1.64 |
| 4.41 |
| QLD B&H |
| 18.58% |
| 39.57% |
| -80.65% |
| 0.62 |
| 0.94 |
More details of the performance can be seen in the following PDF report generated by the Portfolio Visualizer application.
Below are three charts: (1) portfolio growth, (2) the chart bar of annual returns and (3) the chart of drawdowns.
Single QLD portfolio growth:
PortfolioVisualizer.com
Single QLD annual returns:
PortfolioVisualizer.com
Single QLD drawdowns:
PortfolioVisualizer.com
Observations
The two portfolios, non-leveraged QQQ and leveraged QLD perform similarly better than their buy-and-hold counterparts. Both achieve substantially higher returns at substantially lower drawdowns.
Additionally, their risk-adjusted returns as shown by their Sharpe and Sortino ratios are almost identical.
Conclusion
The Nasdaq 100 index made a bear market bottom in October to December and it is in an uptrend since then.
QQQ and QLD are rated as BUY.
Risk Warning
The following warning is provided by ProShares.
ProShares Ultra QLD seeks a return that is 2x the return of its index (target) for a single day, as measured from one NAV calculation to the next. Due to the compounding of daily returns, holding periods of greater than one day can result in returns that are significantly different than the target return and ProShares' returns over periods other than one day will likely differ in amount and possibly direction from the target return for the same period. These effects may be more pronounced in funds with larger or inverse multiples and in funds with volatile benchmarks. Investors should monitor their holdings as frequently as daily. Investors should consult the prospectus for further details on the calculation of the returns and the risks associated with investing in this product.
Here is a detailed message from the SEC on the risks inherent in leveraged ETFs.
For further details see:
QLD: The Rally Continues (Technical And Intermarket Analysis)