NVDA - QUAL: Outperforming The Market And Most Peers In 2023
2023-09-06 07:08:10 ET
Summary
- iShares MSCI USA Quality Factor ETF invests in large and mid-cap U.S. companies using a quality score.
- My metrics confirm the high quality of the portfolio, but it is slightly inferior to the benchmark and peers regarding valuation.
- QUAL is one of the best-performing quality ETFs in 2023.
- However, total return since 2015 is just on par with the S&P 500.
This article series aims at evaluating ETFs (exchange-traded funds) regarding past performance and portfolio metrics. Reviews with updated data are posted when necessary.
QUAL strategy and portfolio
iShares MSCI USA Quality Factor ETF ( QUAL ) started investing operations on 7/16/2013 and tracks the MSCI USA Sector Neutral Quality Index. It changed strategies on 9/1/2015: before this date, it was tracking the MSCI USA Quality Index. It has 125 holdings, a 12-month trailing yield of 1.26% and a total expense ratio of 0.15%.
As described by iShares , the underlying index modifies weights in the MSCI USA Index (the parent index) by multiplying them by a quality score. This score is based on three factors: return on equity (higher is better), earnings variability (lower is better) and financial leverage (lower is better). Then, weights are adjusted so that the sector breakdown matches the parent index. Moreover, individual companies are capped at 5% on rebalancing. The portfolio turnover rate was 41% in the most recent fiscal year.
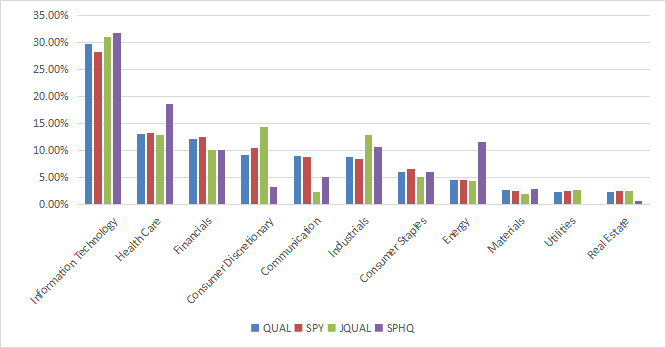
The fund is mostly invested in large and mega caps companies (about 82% of asset value). The heaviest sector is technology (29.7%), followed by healthcare (13%) and financials (12.1%). Other sectors are below 10%. Although it is based on the MSCI USA Index, the sector breakdown is very similar to the S&P 500 ( SPY ), and also to two other U.S. quality ETFs: JPMorgan U.S. Quality Factor ETF ( JQUA ) and Invesco S&P 500 Quality ETF ( SPHQ ). The main differences are:
- JQUA overweights consumer discretionary, industrials, and underweights communication.
- SPHQ overweights healthcare, energy, underweights consumer discretionary, communication, real estate, and ignores utilities.
Compared sector breakdowns (Chart: author; data: iShares, SSGA, JPMorgan, Fidelity)
QUAL is significantly more expensive than SPY, JQUA and SPHQ regarding the price/book and price/sales ratios, and close to them in price/earnings and price/cash flow.
| QUAL |
| SPY |
| JQUA |
| SPHQ |
| P/E TTM |
| 22.91 |
| 23.32 |
| 23.06 |
| 20.93 |
| Price/Book |
| 6.65 |
| 4.1 |
| 5.46 |
| 5.8 |
| Price/Sales |
| 3.69 |
| 2.62 |
| 3.15 |
| 2.77 |
| Price/Cash Flow |
| 15.66 |
| 16.37 |
| 15.92 |
| 14.48 |
Data: Fidelity
The portfolio is quite concentrated: the top 10 companies, listed below, represent 40.8% of asset value, and the top name (NVIDIA) weighs 6.4%. Risks related to other individual companies are moderate. The two share series of Alphabet Inc. (GOOG) (GOOGL), accounted as different holdings, have been grouped in the next table.
| Ticker |
| Name |
| Weight (%) |
| EPS growth %TTM |
| P/E TTM |
| P/E fwd |
| Yield% |
| NVIDIA Corp. |
| 6.44 |
| 35.76 |
| 117.18 |
| 45.55 |
| 0.03 |
| Visa Inc. |
| 4.65 |
| 16.71 |
| 32.04 |
| 28.62 |
| 0.73 |
| Apple Inc. |
| 4.49 |
| -1.68 |
| 31.84 |
| 31.30 |
| 0.51 |
| Microsoft Corp. |
| 4.29 |
| 0.42 |
| 33.94 |
| 29.91 |
| 0.83 |
| Meta Platforms, Inc. |
| 4.18 |
| -28.97 |
| 34.55 |
| 22.12 |
| 0 |
| Mastercard Inc. |
| 4.03 |
| 8.13 |
| 38.94 |
| 34.20 |
| 0.55 |
| GOOGL, GOOG |
| Alphabet Inc. |
| 4.01 |
| -12.04 |
| 28.70 |
| 23.95 |
| 0 |
| Eli Lilly and Co. |
| 3.03 |
| 13.03 |
| 78.60 |
| 57.95 |
| 0.81 |
| ConocoPhillips |
| 2.97 |
| -14.39 |
| 11.75 |
| 14.03 |
| 3.72 |
| NIKE, Inc. |
| 2.66 |
| -14.00 |
| 31.72 |
| 27.40 |
| 1.33 |
Performance
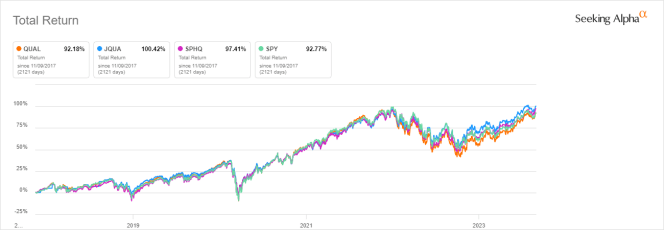
The next chart compares total returns since JQUA inception (November 2017). QUAL is on par with SPY and slightly lags its competitors
QUAL vs peers and SPY ( Seeking Alpha)
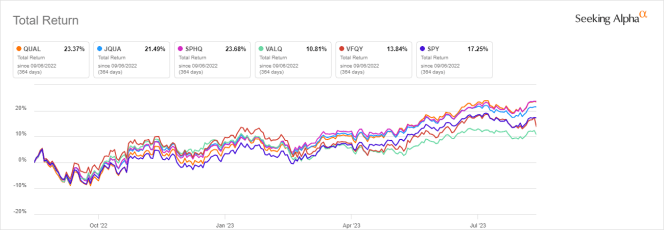
The next chart compares the same funds in the last 12 months, and adds two more recent quality ETFs:
In this time interval, QUAL and SPHQ are almost tie and lead the pack. They have beaten the S&P 500 by about 6% in 8 months.
QUAL vs peers and SPY (Seeking Alpha)
Comparing QUAL with my quality model
In previous articles, I have shown how three factors may help cut the risk in a dividend portfolio: Return on Assets , Piotroski F-score , and Altman Z-score .
The next table compares QUAL since September 2015 with a subset of the S&P 500: stocks with a dividend yield and an ROA above the average, a good Altman Z-score, a good Piotroski F-score, and a sustainable payout ratio. It is rebalanced annually to make it comparable with a passive index.
| Total Return |
| Annual Return |
| Drawdown |
| Sharpe ratio |
| Volatility |
| QUAL |
| 167.21% |
| 13.05% |
| -34.06% |
| 0.74 |
| 16.45% |
| Large-cap quality subset |
| 181.71% |
| 13.80% |
| -37.34% |
| 0.78 |
| 16.51% |
Past performance is not a guarantee of future returns. Data Source: Portfolio123
QUAL slightly lags my quality subset. However, ETF performance is real, whereas the subset is simulated. My core portfolio holds 14 stocks selected in this subset (more info at the end of this post).
Scanning QUAL with quality metrics
7 stocks out of 125 are risky regarding my metrics. In my ETF reviews, risky stocks are companies with at least 2 red flags among: bad Piotroski score, negative ROA, unsustainable payout ratio, bad or dubious Altman Z-score, excluding financials and real estate where these metrics are unreliable. Here, risky stocks weight only 2.6% asset value, which is an excellent point.
According to the calculation of my preferred quality metrics (reported in the next table), portfolio quality is significantly superior to the benchmark. The aggregate return on assets is especially impressive.
| QUAL |
| SPY |
| Atman Z-score |
| 9.46 |
| 3.54 |
| Piotroski F-score |
| 6.13 |
| 5.67 |
| ROA % TTM |
| 15.75 |
| 7.05 |
Takeaway
iShares MSCI USA Quality Factor ETF invests in large and mid-cap U.S. companies using a quality score based on ROE, earnings variability and financial leverage. It preserves the sector weights of its parent index. My metrics confirm the high quality of the fund’s portfolio, but it is slightly inferior to the benchmark and competitors regarding valuation. Exposure to risky stocks regarding my criteria is only 2.6%. QUAL is one of the best-performing quality ETFs in 2023, but total return since 2015 is just on par with the S&P 500. QUAL historical performance is not very compelling, but it doesn’t show a risky behavior, and it has outperformed several competitors lately. It is a reliable instrument for investors seeking to bet on quality, an all-weather investing style, without the hassle of picking individual stocks.
For further details see:
QUAL: Outperforming The Market And Most Peers In 2023