CA - Reitmans: A Minimum Increase Of 115% Needed To Approach Fair Value
Summary
- The new Reitmans is a cash flow machine that has generated $1.07 of FCF per share over the LTM, a FCF yield of +50% after considering excess cash.
- The stock is undervalued by any metric: A 20% FCF yield would command a price of $6.35. Fair market NAV is $7.84/share.
- YTD results are the best they've been since 2012. At that time, Reitmans was paying an annual dividend of $0.80/share.
- Publication of Q4 numbers in April 2023 should provide the board an adequate basis to decide to reinstate a dividend payment.
Editor's note: Seeking Alpha is proud to welcome Stripes Capital as a new contributor. It's easy to become a Seeking Alpha contributor and earn money for your best investment ideas. Active contributors also get free access to SA Premium. Click here to find out more »
After remarkable runs following the publication of their Q2 and Q3 results, I believe that shares of Reitmans ( RET.A.CA) ( RTMAF ) ( RET.CA ) ( RTMNF ) still need to at least double to reach their fair value. I estimate the mark-to-market net asset value at $7.84 per share. My free cash flow analysis leads to a price range of $6.35 to $8.49.
Valuation Summary
The Opportunity
This undervaluation comes from a mix of factors, but I believe that the quality of the business/assets is still vastly misunderstood. This is due to the fact that Reitmans filed for bankruptcy protection during the COVID-19 crisis, and emerged from it after a serious restructuring process. From an operational and financial standpoint, the company is not the same anymore - and it is starting to show. The company printed net earnings of $50.2m ($1.03/share) for the first nine months of its fiscal year. Those are the best results since 2012 when Reitmans was paying a dividend of $0.80/share.
The company has always paid a dividend to its shareholders, until COVID-19 hit. The target payout ratio was 50% to 80% of sustainable EPS. Applying this rule to LTM adjusted earnings of $1.1/share would generate a dividend payment of $0.55 to $0.88 per share.
The company is now debt-free and sits on a cash pile of $1.26/share. Publication of Q4 numbers in April 2023 will provide the board of directors with the first full-year picture of the company's profitability post-crisis, and an adequate basis to decide to reinstate a dividend payment. I believe that upcoming catalysts in 2023 - such as a dividend reinstatement and a potential uplisting to the TSX - will bring the stock back to its fair value range.
Company Overview
Market, products, and business model
Reitmans is a Canadian specialized retailer operating three banners:
- Reitmans: 58% of locations; target market is 35-plus-year-old, budget-conscious women looking for affordable, classic, office-appropriate attire
- PENN: 23% of locations; budget-conscious, plus-sized women
- RW&Co: 17% of locations; higher end, more men than Reitmans
The market share ranges between 2.5% and 3% of the entire Canadian clothing store industry depending on the quarters. It means that 95%-plus of Canadians don't shop in these stores. And that's for a good reason, since these brands won't attract fashionistas or teenagers. The company's mission has always been to provide affordable clothing to the average, middle-aged Canadian woman. And they make money when they stick to this niche.
The company operates 404 locations spread over Canada and is present in every province. It rents its stores but owns two large pieces of real estate in Montréal: its headquarters and its distribution center. It sources its products from Asia and pays its suppliers in USD while selling in CAD to its customers. Finally, e-commerce represents a fourth of total sales.
Key macro factors that impact the company profitability are the overall health of the Canadian economy and Canadian consumers (especially the lower to middle income ones), the strength of the CAD/USD exchange rate, and the weather and the associated foot traffic in malls and retail centers.
History
Reitmans is a 96-year-old Canadian success story. Starting with one single clothing store in Montreal in 1926, the Reitmans family grew the company to a pan-Canadian group of seven banners with close to 1,000 stores at its peak in 2011. At that time, the company was generating over $100m of free cash flow per year and paying an annual dividend of $0.80 per share. The stock was trading over $15, and the market cap was around $1 billion.
An inflow of international new entrants and the rise of e-commerce heightened competition in the Canadian apparel market. Losing market share and operating unprofitable locations, the company embarked on a challenging downsizing trend. It closed its first banner (Cassis) in 2012, reduced its U.S. footprint in 2014, and closed its second banner in 2015 (Smart Set). Fast forwarding to early 2019, the company was operating 600 stores and generating slightly over $20m FCF per year. Now paying an annual dividend of $0.20, the stock price was trading around $4.
Dragged down by the negative performance of its plus-sized banners, the company booked a negative free cash flow of circa $50m in FY20 and the stock was trading around $1 just before COVID-19 hit. With nationwide lockdowns implemented, the company sought protection under the Companies' Creditors Arrangement Act (CCAA) in May 2020 to implement a restructuring plan, under the monitoring of Ernst & Young.
The company started an 18-month journey with Ernst & Young helping to enhance the efficiency and profitability of operations, including the disclaimer of commercial leases and contracts and discussions with suppliers to obtain goods and services. Basically, they were revamping the whole business. As a result, the company closed the Thyme Maternity and Addition Elle banners, terminated approximately a fourth of its workforce, and closed 140 banners.
After a painful 2020 where the whole economy was turned off and the company in a midst of a restructuring process, Reitmans started to demonstrate the earning potential of its new structure. While restrictions were progressively lifted in 2021, right-sized Reitmans was consistently exceeding Ernst & Young's financial projections presented to the court. In November 2021, BMO agreed to provide up to $115M to finance a plan of arrangement with creditors. In January 2022, the company exited CCAA after agreeing with its creditors to pay $95m to settle $186m of liabilities. Because of the cash flow generated over the previous quarters, the company only had to draw $30m of BMO's facility.
The New Reitmans
Today, the company operates only three profitable banners under a lean cost structure and is printing money. Since BMO's $30m was paid off in the first quarter of this year, Reitmans is now debt-free and sits on a positive working cap of $150m, nearly $3/share. It also owns real estate assets worth more than its current market cap (more on that later).
Finally, they printed the best first nine-month results from operating activities since 2012 - with half the store count. Let's look at the numbers.
Top-Down Financial Analysis
Please note that all the numbers below follow the fiscal year reporting system of the retail industry. Q1 starts at the beginning of February and Q4 ends at the end of January. For example, Q1 of FY21 covers February, March, and April 2020. So, the COVID-19 crisis started in Q1 of FY21, and restrictions were lifted nationwide in Q4 FY22.
Canadian Clothing Sector Back on Historical Growth Trend
After eight quarters of COVID-19 restrictions (shown in yellow on the chart below), the retail business environment has been back to normal since the beginning of FY23. With consumers back in stores, clothing sales reached record levels in the first three quarters .
The Canadian clothing sector is back on its historical growth trend (Statcan)
For those who are less familiar with the retail industry, notice the sales seasonality. Q1 is historically the weakest quarter, with clothing stores often booking small losses. Profits then increase with the level of sales as the bricks-and-mortar cost structure is mostly fixed.
Because Reitmans' product mix leans toward casual, affordable, day-to-day clothes, the company's sales do not usually benefit from the holiday season surge. Historically, Q2 has always been the stronger quarter for Reitmans, followed by a small decrease in sales in Q3 and a stable Q4.
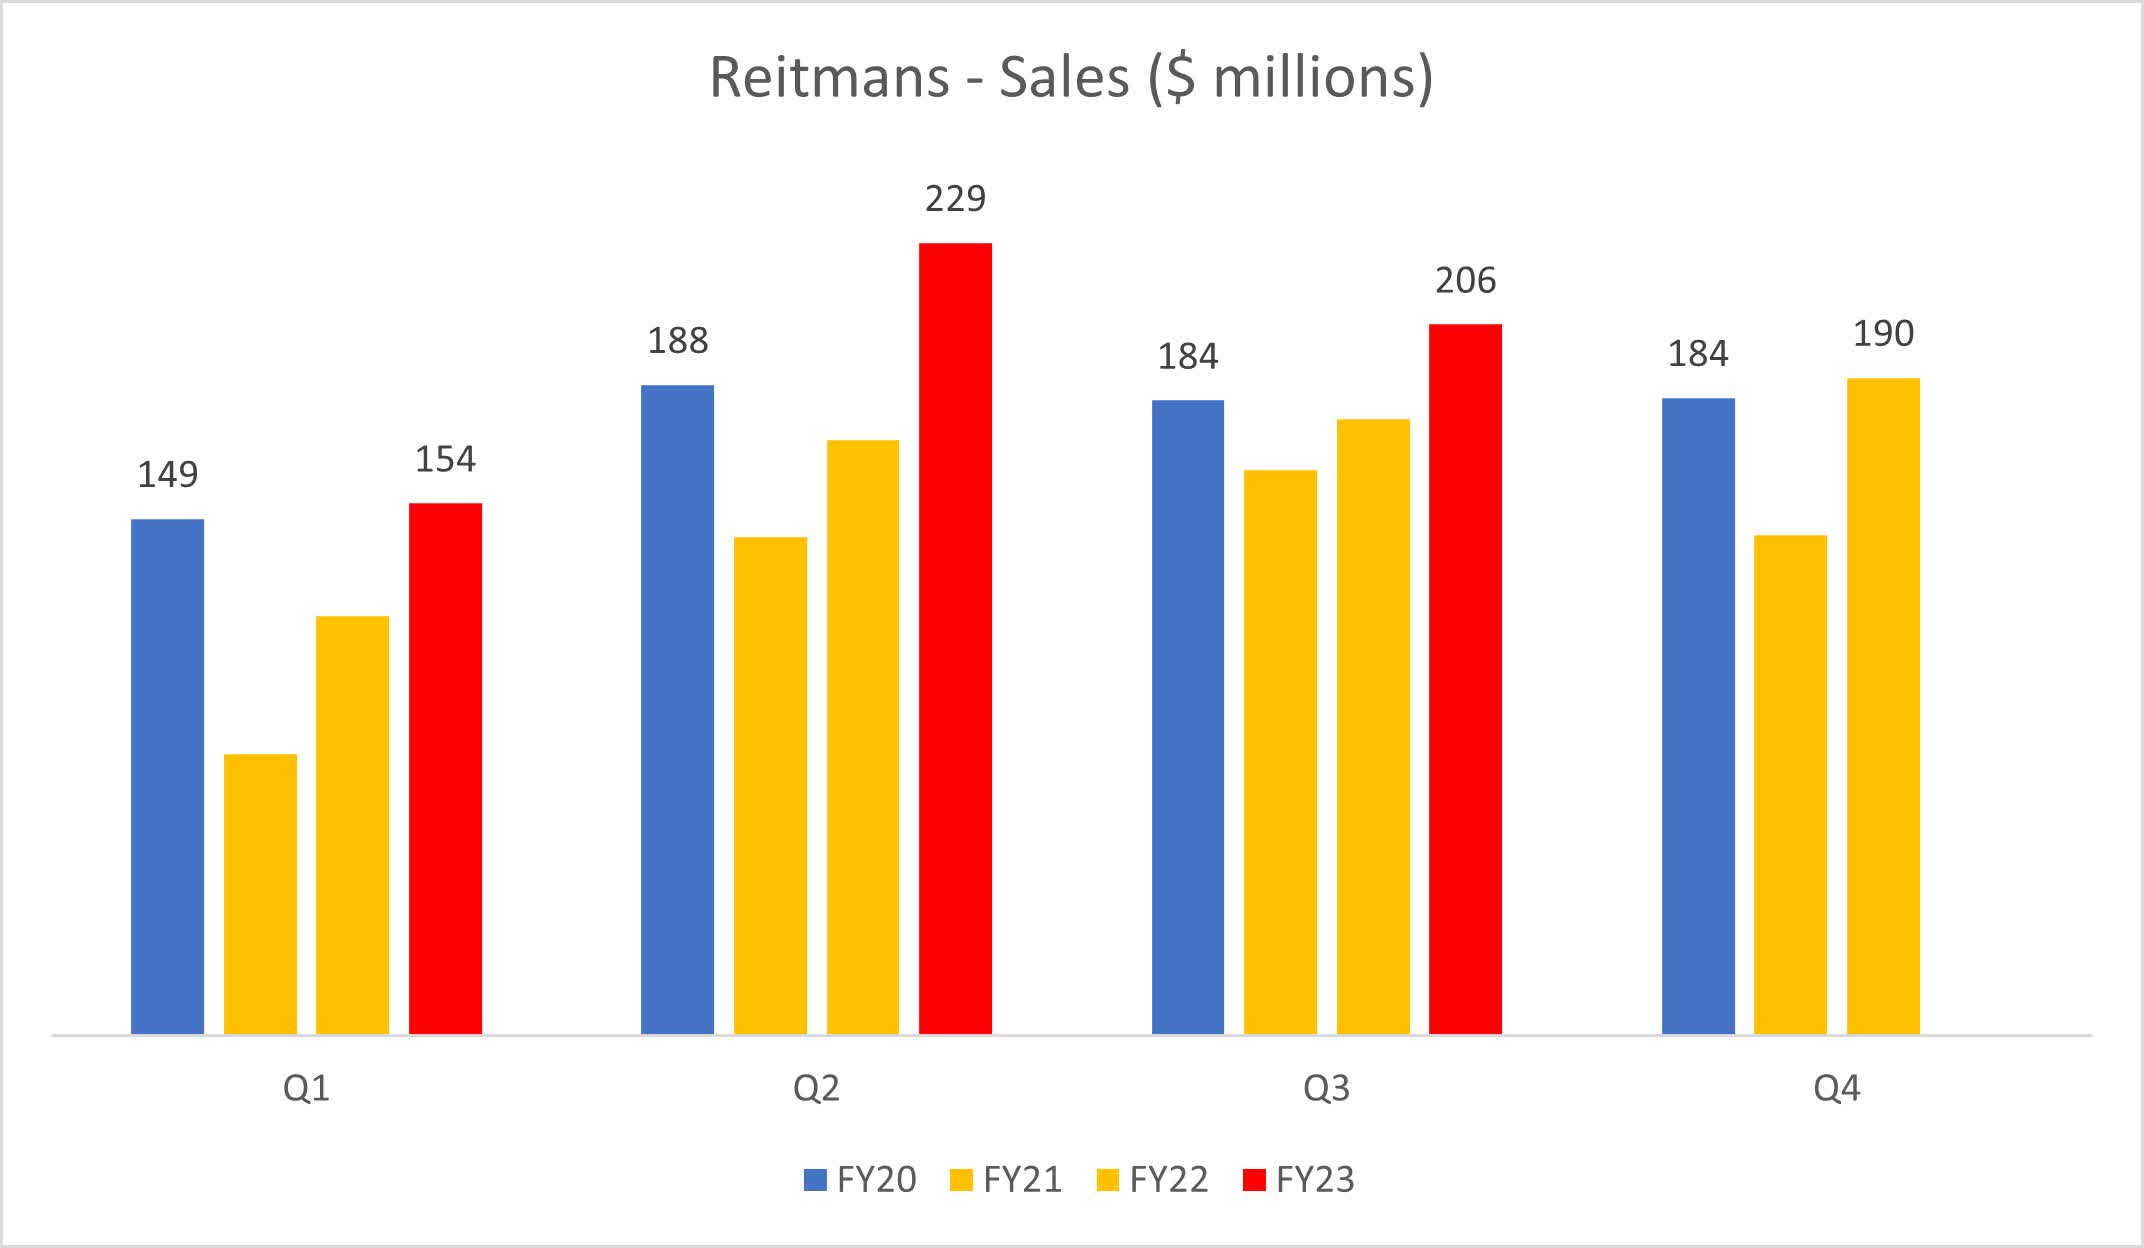
New Three-Banner Reitmans' Sales on a Better Trend...
Since the restructuring happened in FY21, we only have access to comparable data for the three-banner Reitmans for one historical fiscal year non-impacted by restrictions: FY20. It's enough to observe that the new company experienced the same trend vs. the industry: a drastic drop during the sanitary crisis, followed by a sharp recovery to reach record-high numbers in FY22. Reitmans recovered even faster than the industry since it surpassed its FY20 sales level as soon as Q4 of FY22.
Reitmans sales are growing faster than the industry (Financial statements)
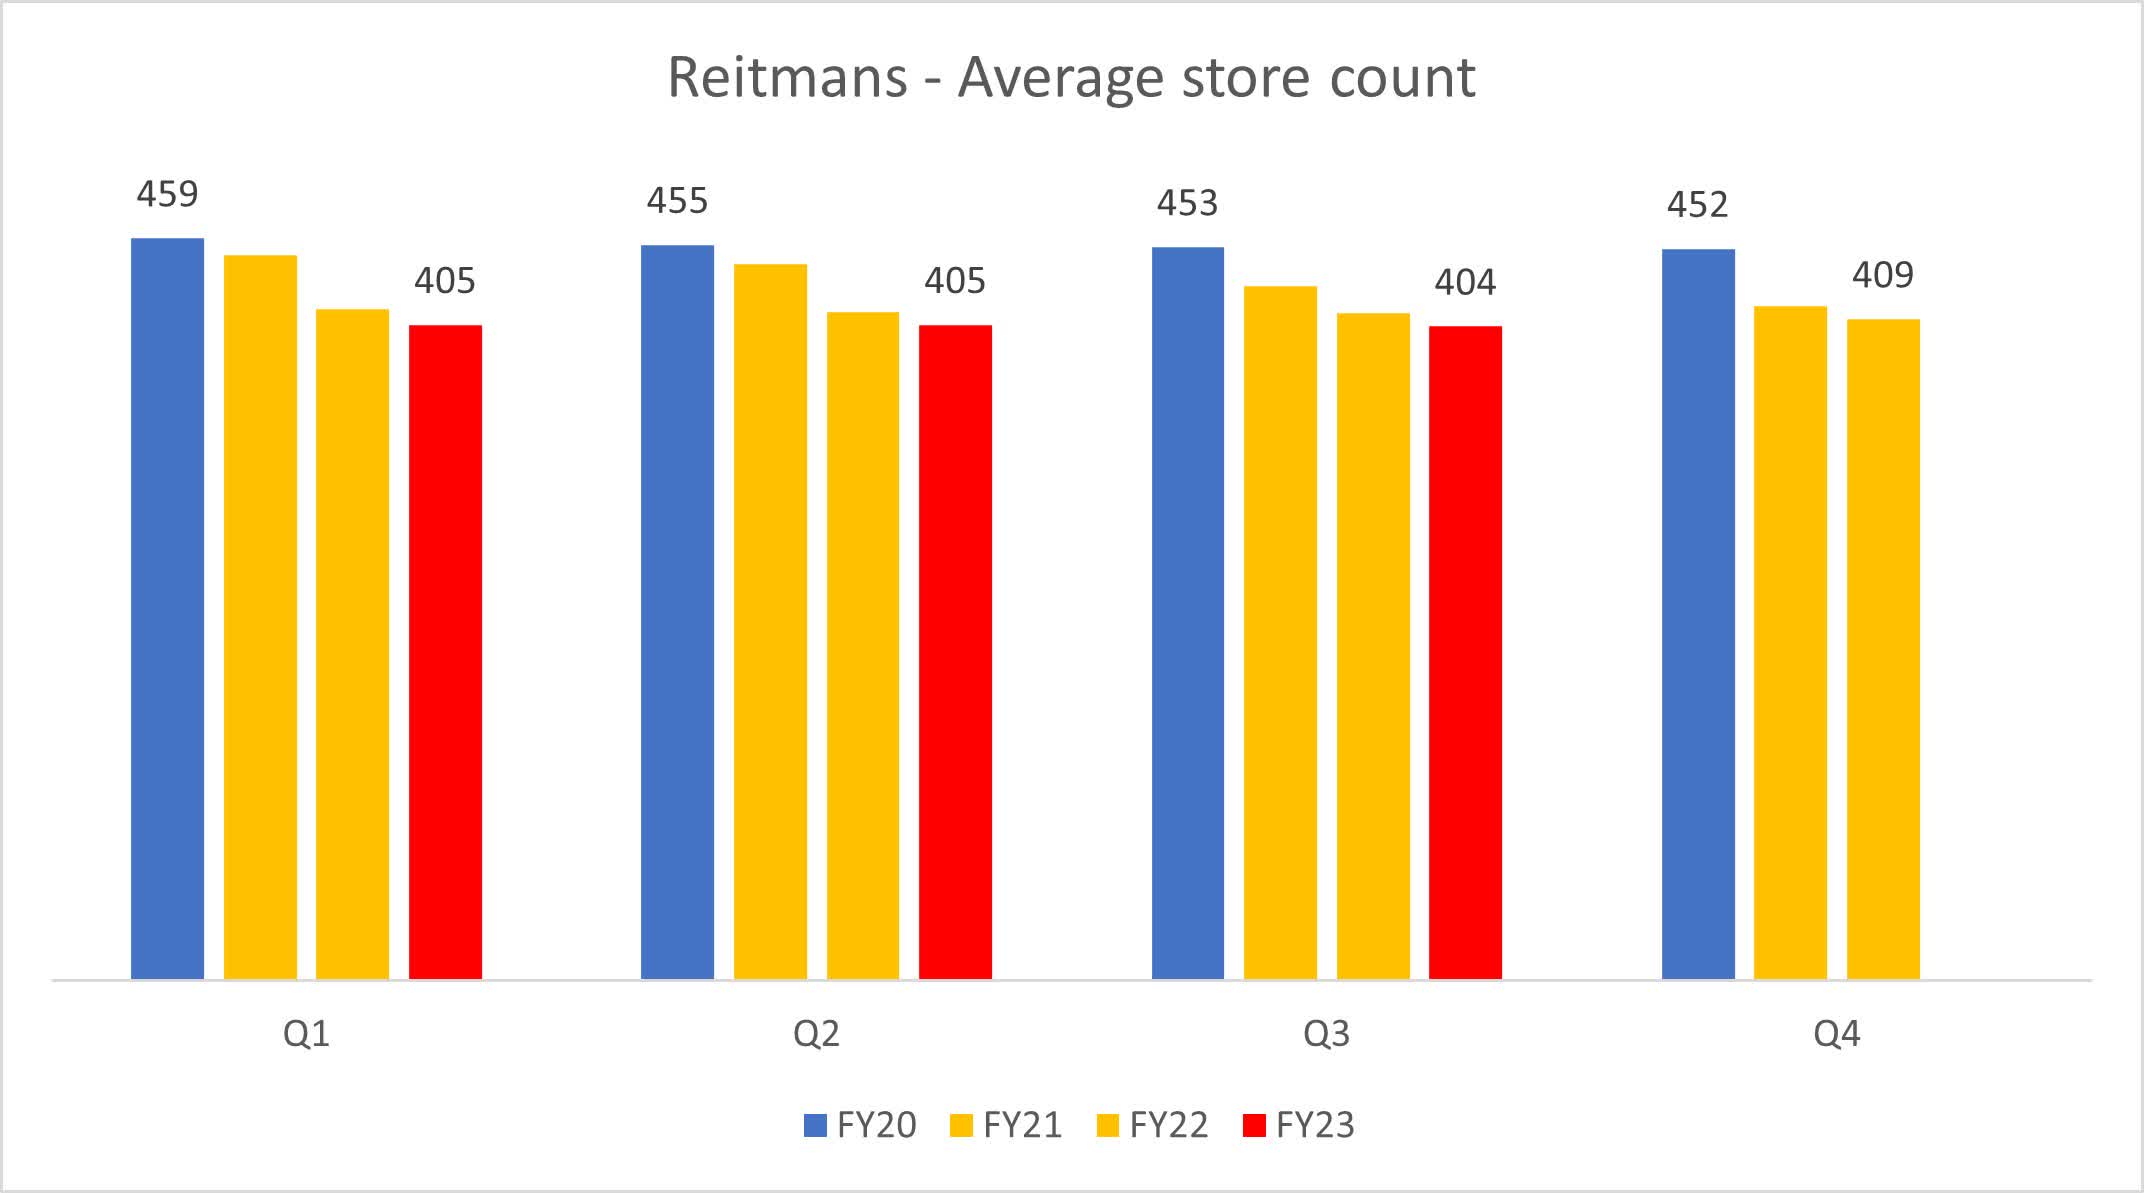
…While the Company Was Decreasing Its Store Count
On top of discontinuing two unprofitable banners, the company has been closing underperforming locations, reducing the three-banner store count by 12% over the last three years.
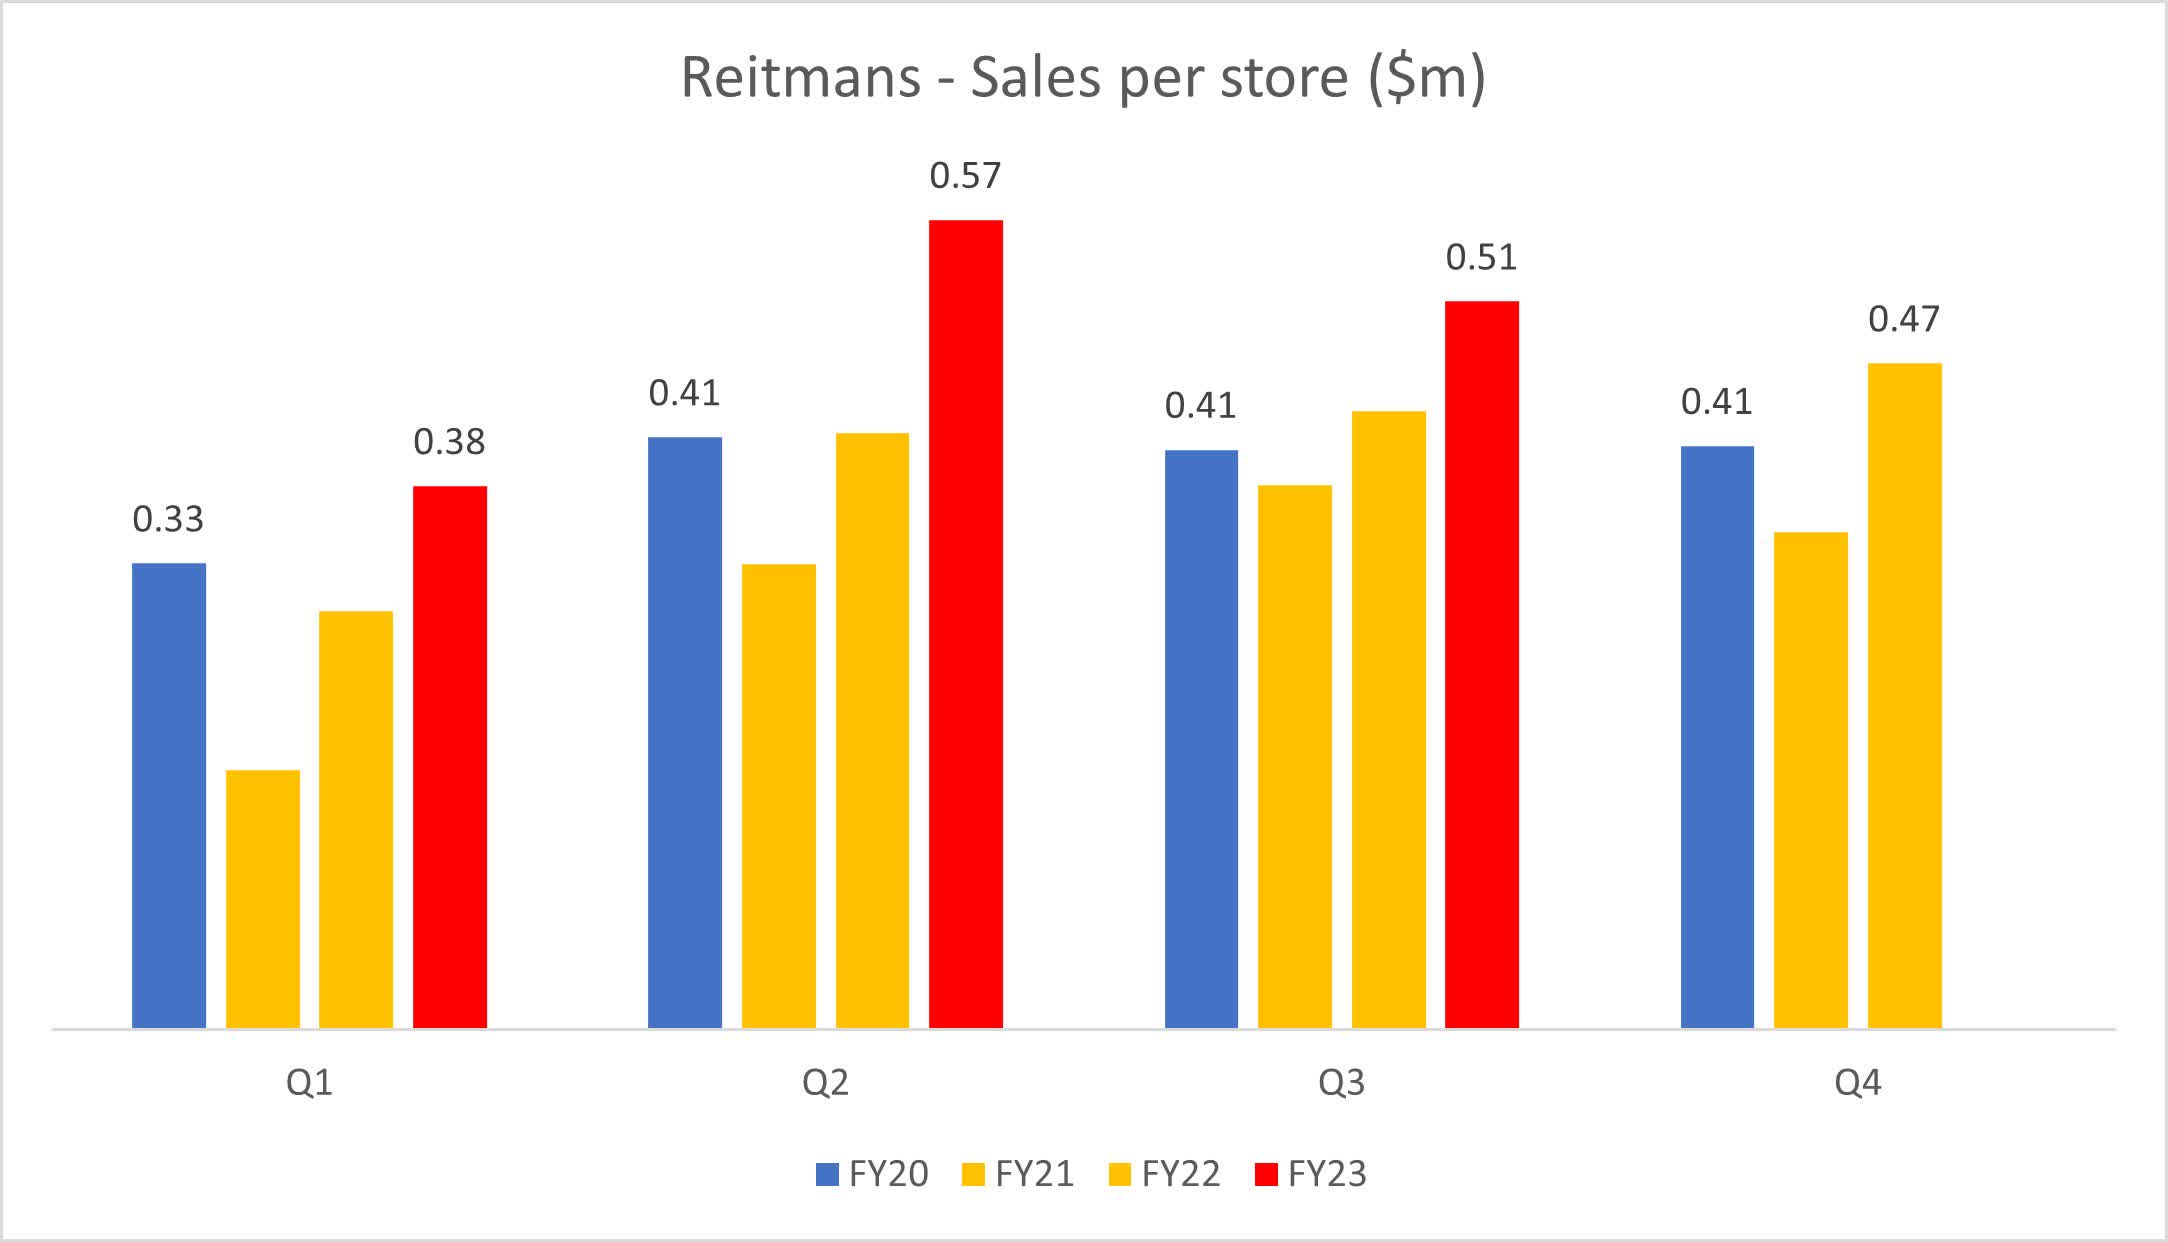
Total sales up + store count down = sales per store up 27% in FY23.
The results of the company's efforts to enhance its operational efficiency are really showing when looking at sales per store numbers. Another interesting point is that Q2, Q3, and Q4 sales per store in FY22 were already higher than FY20, while the company was still facing restrictions.
So far, the data shows that the company has been doing very well on the revenue part, climbing back from the crisis hole faster than the industry. But what about the costs?
Lease Payments Cut Drastically
Part of Ernst & Young's job was to help the company disclaim and renegotiate its commercial leases. As a result of store closures and new leases being implemented, lease payments went from $69m in FY20 to $34m in LTM, a 51% cost cut for a store count reduction of only 12%. Combined with the increase in sales per store discussed previously, this initiative led to a drastic decrease of lease payments as a percentage of sales. While the company was paying 10% of its revenue to landlords in FY20, this number is down to 5% in FY23. That's 5% of revenues going straight to the bottom line.
Gross Margin Growing Steadily
Selling more is great only if you make a healthy margin on products sold. Historically, the company's annual gross margin has been as high as 64% in 2012 when CAD/USD was at parity, to as low as 52% in FY20 with CAD/USD at 0.75. A strengthening CAD toward 0.80 helped the company margin in FY22, but margins still kept improving in early FY23 with the CAD being stable. The gross margin was reduced to 57% in the last quarter with the USD pushing higher. Overall, gross profit margins printed this year are historically high for current exchange rate levels, showing that the company improved its marketing strategy and is not relying on aggressive discounts to increase sales.
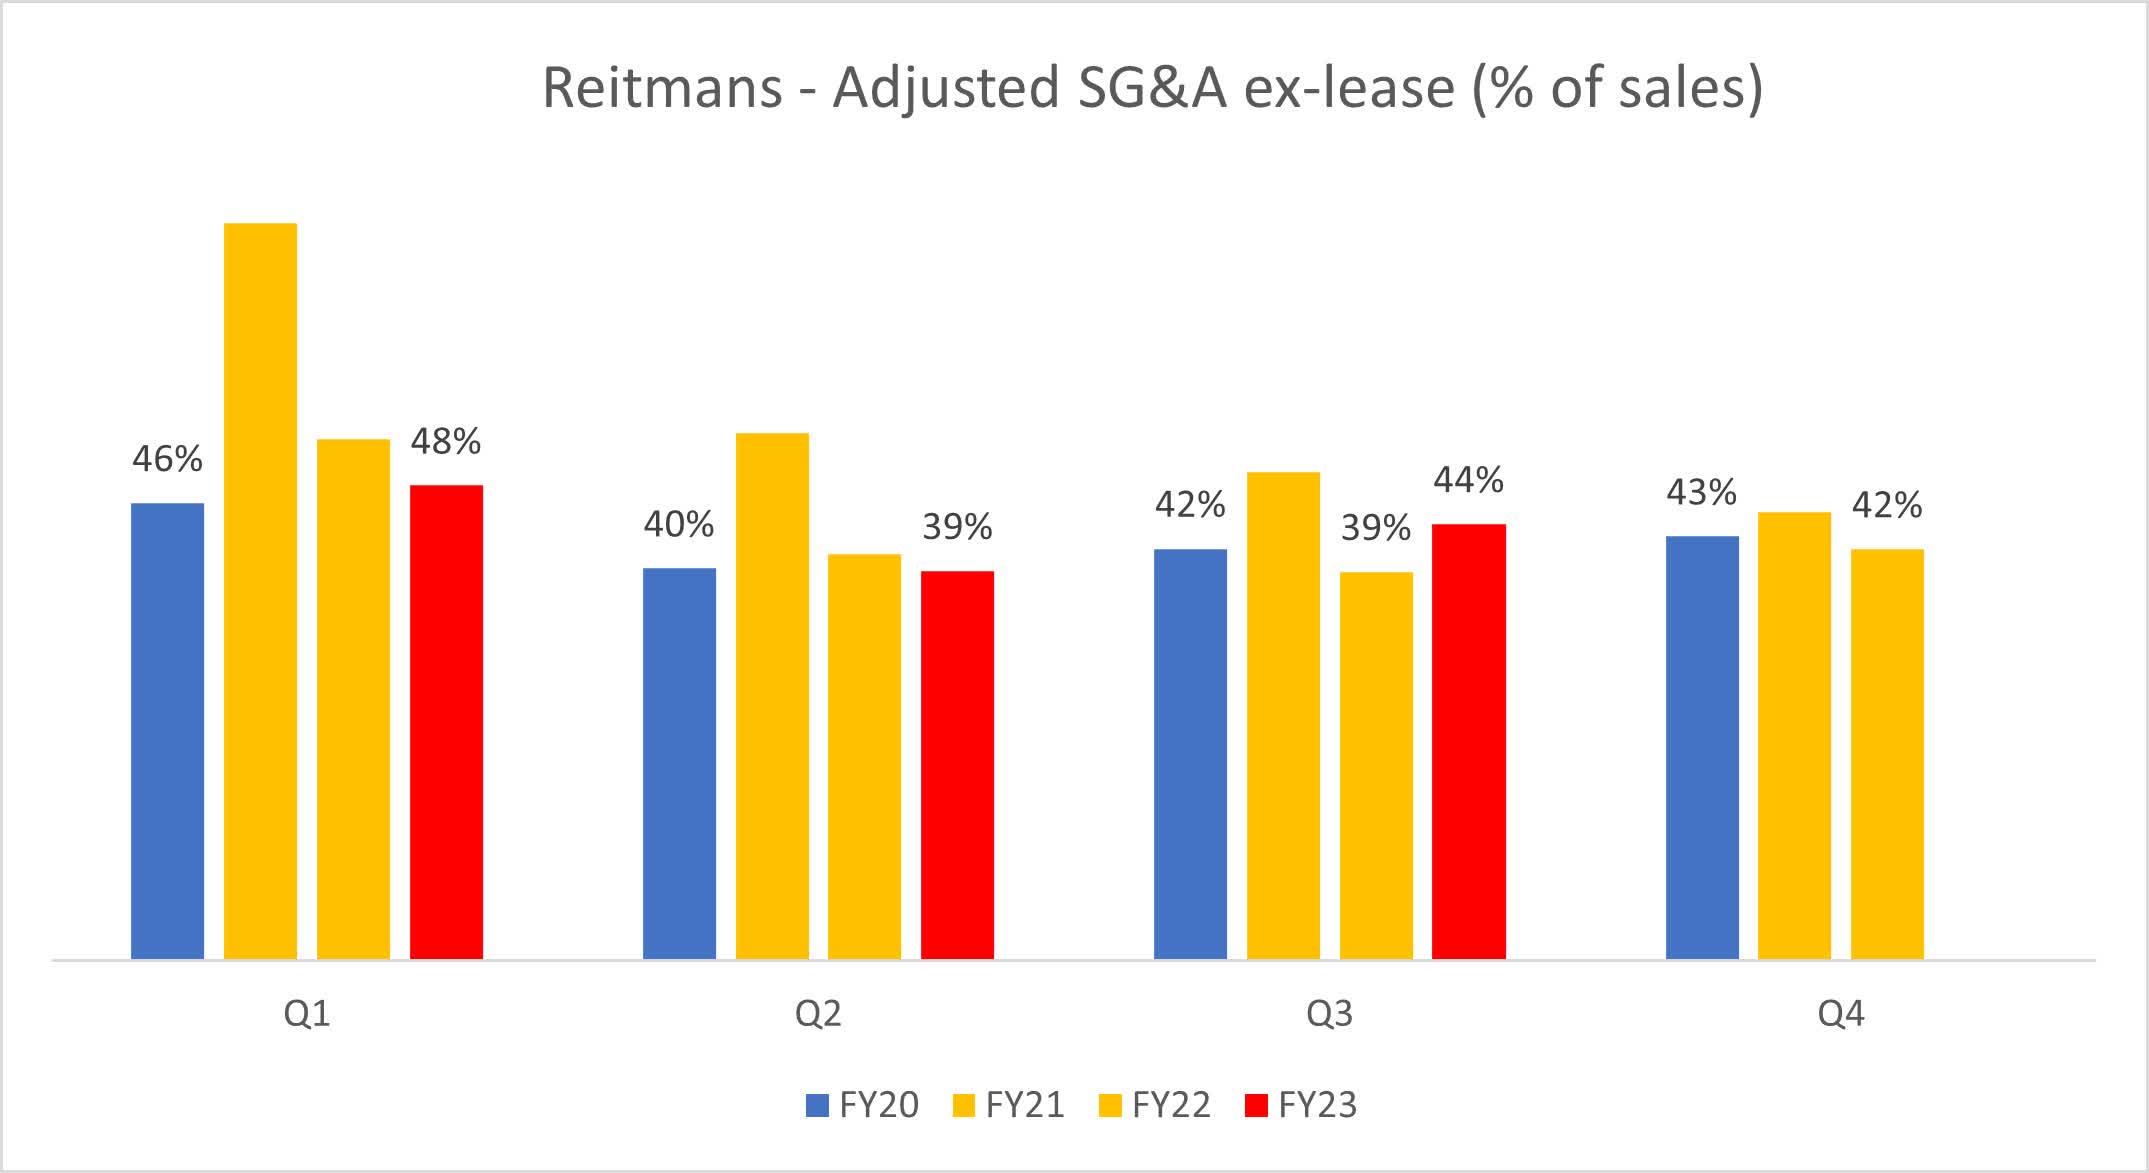
Selling, Distribution, and Admin Expenses Back to Normal Levels
Expressed as a percentage of sales, all other operating costs (wages, marketing, admin) are back to pre-crisis levels. Given the increase of sales per store, one could have expected to see an efficiency gain here, but the company has been facing the same inflationary pressures and talent shortage than experienced by the whole Canadian economy. The company also decided to reward its employees in FY23 for having successfully navigated the restructuring process. In addition, an extraordinary increase in performance incentive plan expense was triggered last Q3 "based upon the forecasted attainment of operating performance targets." This means that the management expects the positive trend in operating results to continue till the end of the year.
Financial statements Financial statements
The Restructuring Successfully Reinstates Profitability
Operating margin turned positive again as soon as Q2 of FY22, while the retail sector was still struggling and restrictions were being turned on and off.
Financial statements
Free Cash Flow at $1.07/Share the Last 12 Months
LTM FCF per share of $1.07 includes a quarter during which the industry was still slowed down by restrictions. The publication of next quarter results will complete the first 12-month period post-crisis and will probably push this number higher.
Financial statements
Valuation Analysis
Net Assets Valuation
GAAP book value per share was $4.57 at the end of October 2022. After adjusting the value of the real estate assets, the intangibles and the DTA to reflect market values, the net asset value stands at $7.84/share.
To estimate the actual fair market value of the company's assets, I made three adjustments to the GAAP numbers:
- Property and equipment: The company owns two very valuable properties - its headquarters and its distribution center. Both are on the Montreal Island, where a shortage of industrial properties has sent prices through the roof. In October 2021, Ernst & Young provided a liquidation analysis to the court where they valued the property and equipment around $115m. In January 2022, BMO provided a revolving facility of $115m, which was secured by the assets of the company. According to CBRE's last available report on the industrial real estate market in Montreal, average prices increased 20% over the last 12 months. I estimated the fair value of the real estate assets using the metrics provided in the CBRE report, using a conservative price of $170/s.f. for the existing buildings and $1.7m/acre for unused lands.
- Intangibles: In their liquidation, Ernst & Young provided a valuation of intangibles (software, system development costs, and trademarks), prepared by B. Riley. I reproduced the same numbers here.
- Unrecognized deferred tax assets: The company had $46.9m of unrecognized DTA at the end of FY22. Using the company's statutory tax rate of 26.5%, I estimate that $13.6m has been used YTD.
Financial Statements, EY's Monitor report, Author's calculations
FCF Valuation
With a positive working capital of over $150m and zero debt, the company's financial position is way above its historical standards in term of working cap per store. All the cash held could be considered a redundant asset at this point, but let's consider that the company needs to keep $10m to run the business.
That leaves us with $51m of redundant cash, or $1.00/share. Then, let's say that the company keeps generating the same level of FCF seen over the last 12 months, without any growth: $1.07/share. At the current price of 2.96, the FCF yield is 54.6% after removing the redundant cash.
Every investor will have their own opinion on the appropriate yield to ask from a business like this one. Given the recent performance, the rock-solid balance sheet, and the real value of the real estate, I will be happy to get a 16.7% annual yield on this investment, and thus a 6x FCF multiple. The implicit value for that stock would then be 6 x 1.07 + 1.00 = 7.42.
The average fair value stands at $7.52/share, if I use a 5x to 7x FCF multiple and the fair market NAV as reference points. This is a +150% upside from current stock price.
Author's calculations
Conclusion
Operational results proved that the turnaround was a success and the company looks stronger than ever. After a great run over the last six months, RET.CA and RET.A.CA still look incredibly cheap. The current price of RET.CA is the same as it was one year ago, while the company has generated over $1/share of FCF during this period. The publication of fiscal results in April will provide the market with the company's first annual results post-crisis. I expect the board to then approve the reinstatement of a dividend.
Another catalyst would be the return of the company to the TSX after its demotion caused by the CCAA process. Improved visibility and credibility should then attract long-term value investors and funds, happy to lock-in the dividend and the hefty FCF yield. I expect the price to rise quickly over $6/share under that scenario.
On a final note, an interesting qualitative article on the recent involvement of the Reitmans family's new generation can be found here .
For further details see:
Reitmans: A Minimum Increase Of 115% Needed To Approach Fair Value