RGP - Resources Connection: Shares Still Can't Catch A Bid (Technical Analysis)
2023-06-27 16:38:21 ET
Summary
- Resources Connection has consistently beaten earnings expectations and maintained strong gross margins, but struggles with negative growth and deteriorating EPS revisions.
- Technical charts indicate a bearish trend for the stock, with potential for further price drops.
- Investors are advised to be patient and wait for signs of improvement before buying into the stock.
Intro
We wrote about Resources Connection , Inc. ( RGP ) back in March of this year when we zoned in on the company's growth rates and the potential for the pipeline to start delivering quickly. Although the company remained healthily profitable at the time, market uncertainty was resulting in customers not pulling the trigger on projects promptly. This trend was beginning to put comparable growth metrics under pressure in RGP.
Ironically though, Resources Connection has not missed a quarterly earnings estimate for nine quarters, yet shares continue to struggle. In fact, in RGP's most recent Q3 results, the company's GAAP earnings of $0.21 per share or $7 million in net profit beat estimates by roughly $0.02 per share. Furthermore, the company's gross margin rose in the quarter to a level where RGP's trailing 12-month average of 40.47% now comes in well ahead of the company's 5-year average comparable of 38.88%.
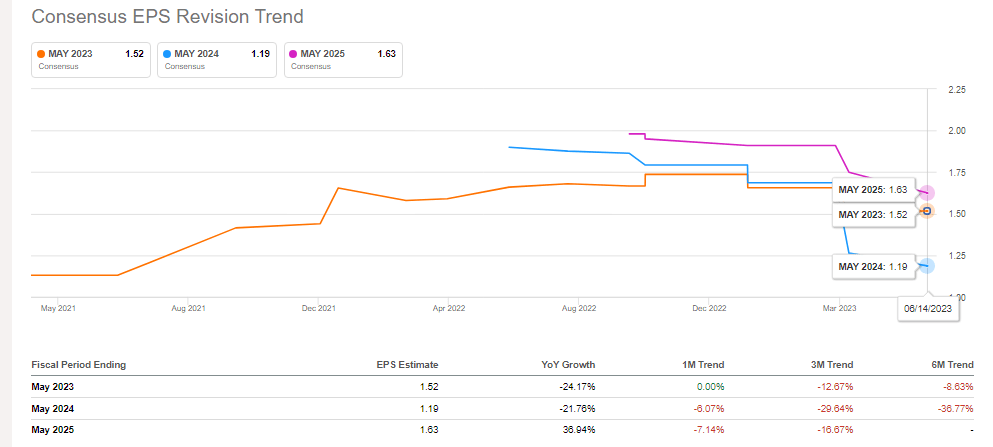
However, the market continues to price in the ramifications of RGP's growth woes, so we recommend investors not to buy into this present down-move. With inflation continuing to run in the mid-single digit percentages, forward top-line sales growth of under 6% for example will not attract enough participants especially when we see the growth rate of industrial stocks in general (12%+). Despite the fact that gross margins have remained buoyant in RGP, poor expected top-line growth rates along with sustained market uncertainty have resulted in negative EPS revisions which unfortunately continue to deteriorate.
Therefore, patience is warranted at present until this bearish momentum can ultimately come to a halt. RGP's technicals are also pointing to lower prices in RGP over the near term as we see below.
Long-Term Technicals
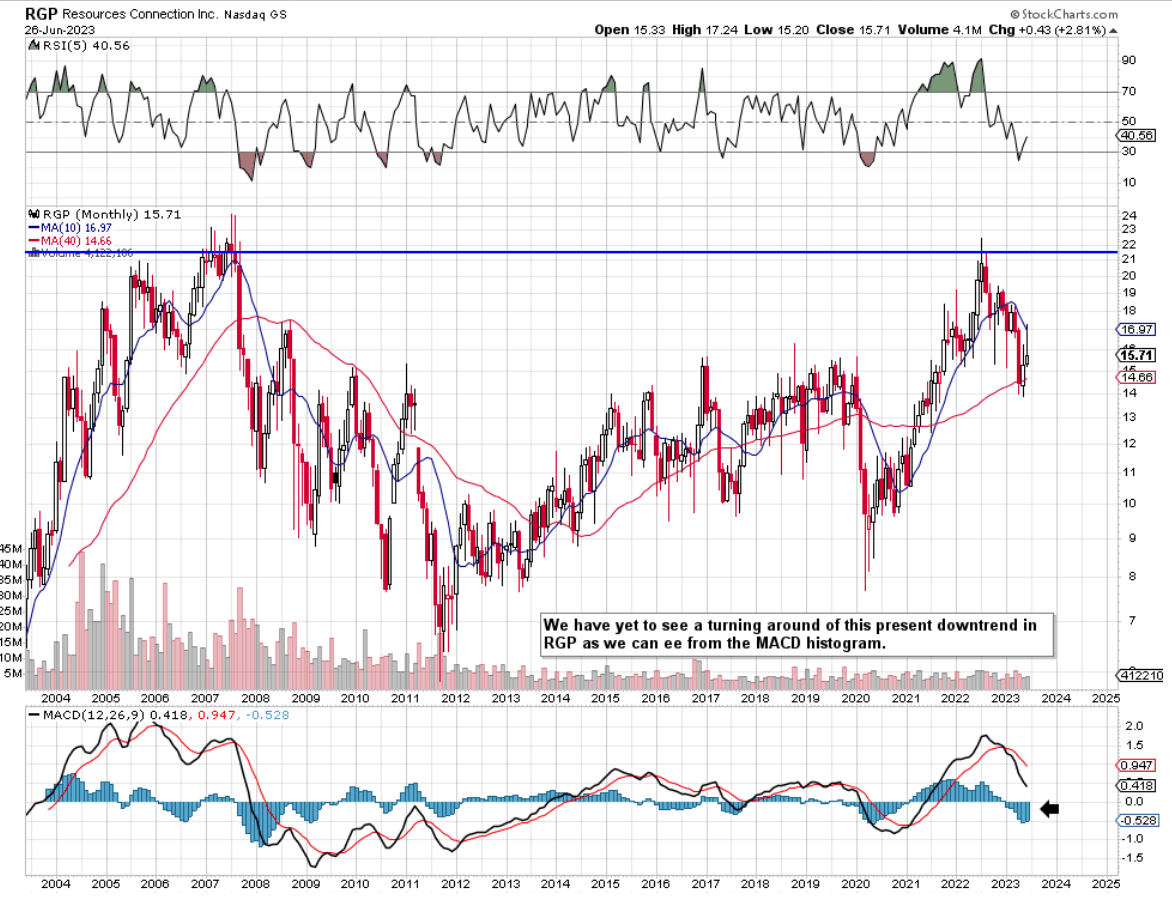
As we see on RGP's long-term chart, shares attempted to take out their all-time highs in mid-2022 but didn't have the required momentum to push through. The worrying development however is the trend of the long-term histogram due to the widening of the two MACD moving averages. Remember, the MACD indicator is especially pertinent on long-term charts due to it being both a momentum and trend indicator. Suffice it to say, when we combine the fact that the MACD crossover took place well above the 'zero-line' (overbought conditions) with an accelerating downtrend, this should not be taken lightly by long-term investors.
Intermediate Technicals
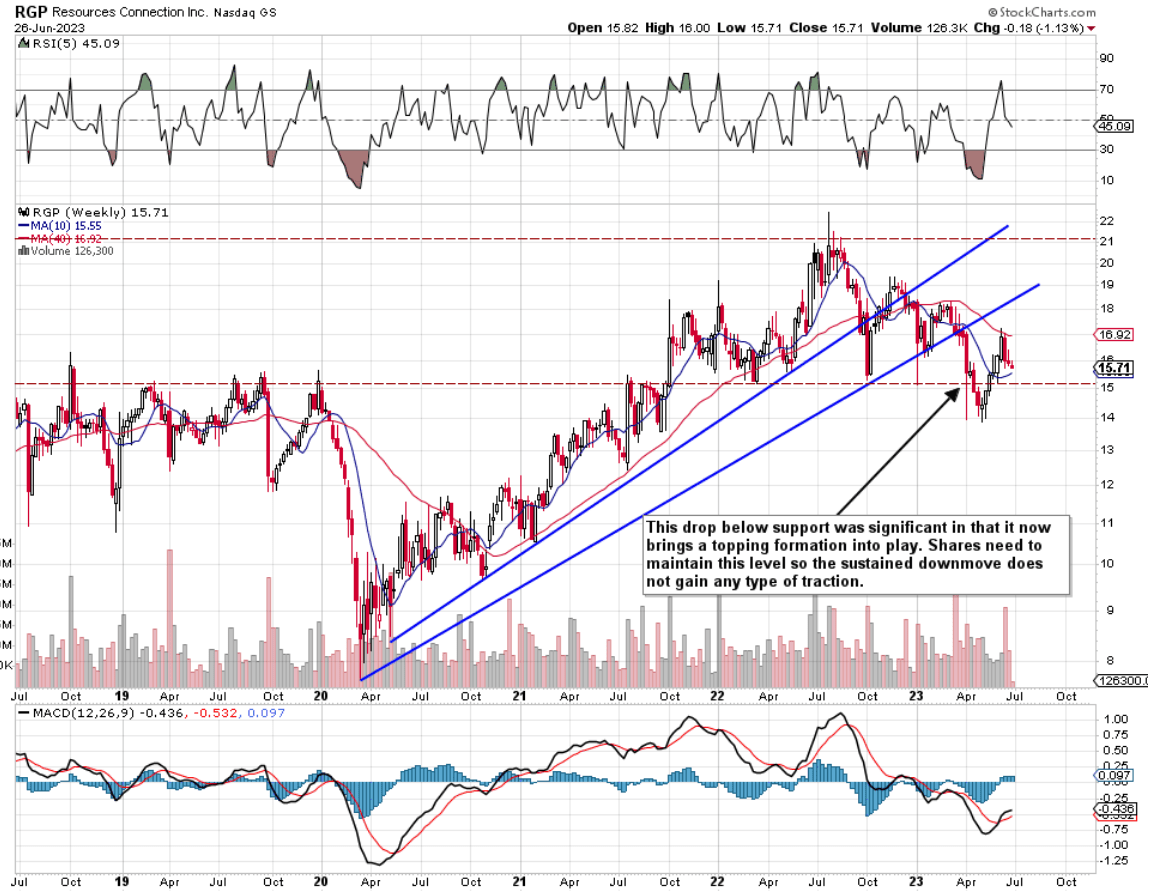
If we pull up an intermediate 5-year-long chart, we see that irrespective of what trend line we use since RGP's multi-year bottom in early 2020, shares have definitely broken below support which obviously has ramifications for RGP's forward-looking trajectory. In fact, if indeed we have a head and shoulders topping pattern playing itself out at present, the height of this formation is not far from $5 a share. This means that shares could potentially drop to close to $10 a share (36% below the prevailing share price) if indeed shares cannot return to a pattern of higher highs over the upcoming weeks.
12-Month Daily Chart
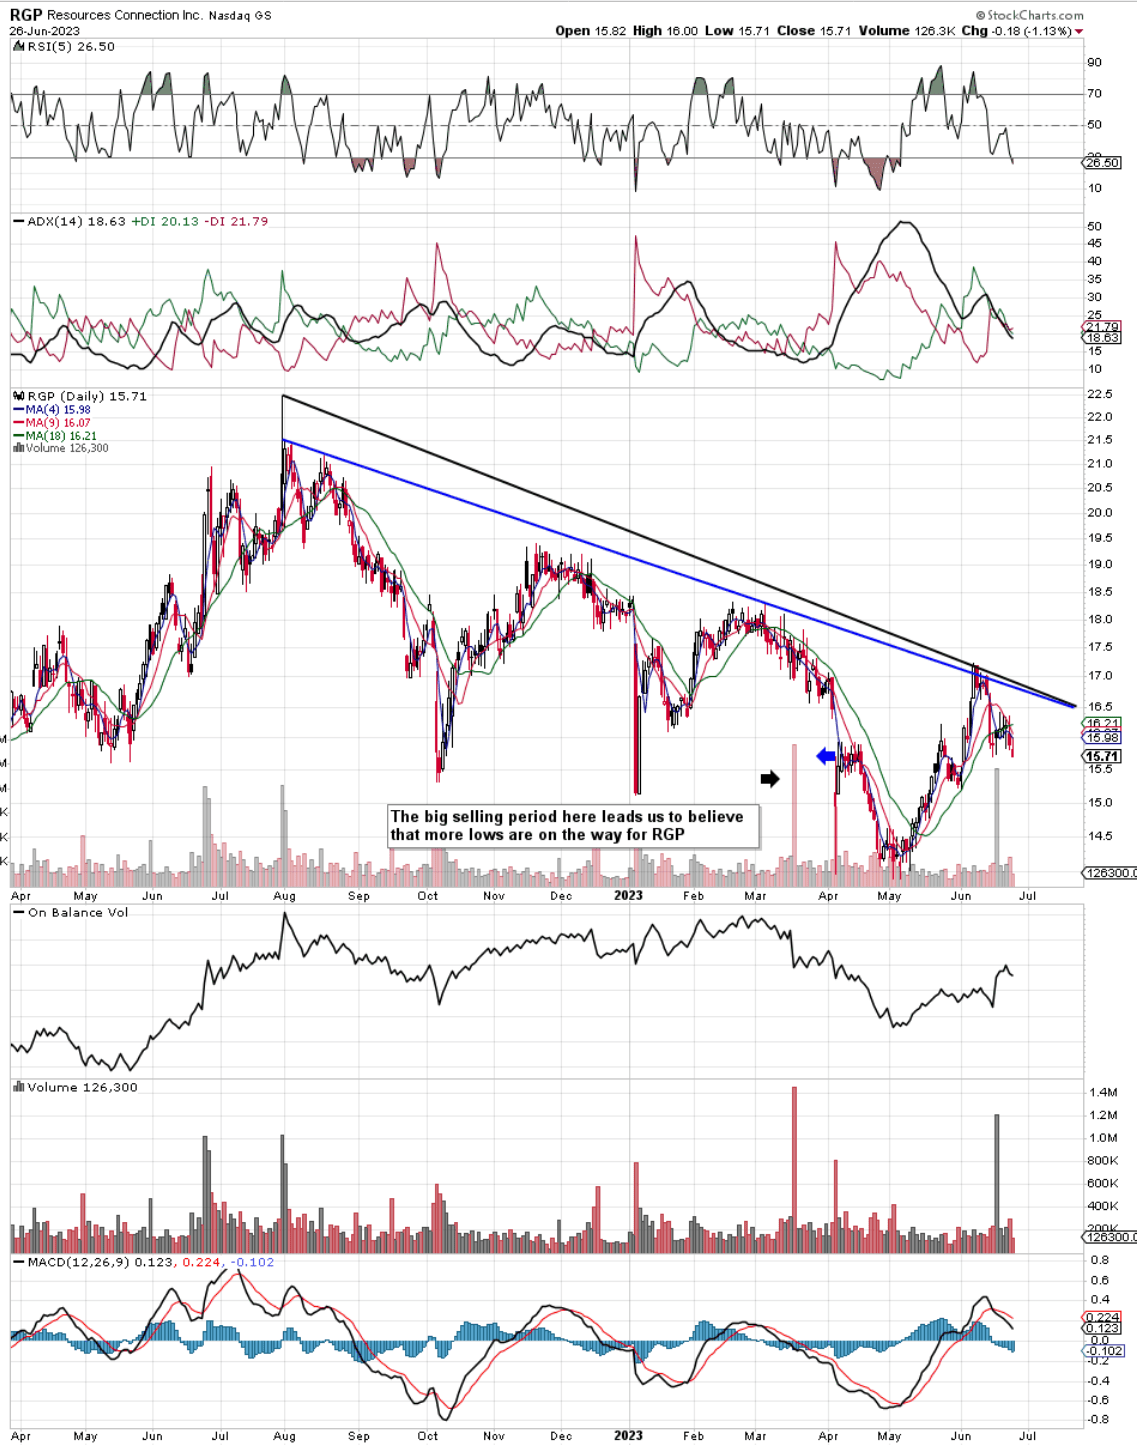
If we pull up a 12-month chart, we see that shares have been making lower highs & lower lows for almost 11 months now. Furthermore, confirmation of the stock's bearish trend was witnessed in mid-March this year when shares sold off aggressively on strong volume. This occurrence spiked the ADX trend indicator to the upside, thereby in fact re-accelerating RGP's bearish trend. Shares did try to stage a comeback throughout May of this year but RGP's momentum was not sufficient to print higher highs in earnest.
Furthermore, given how shares have fallen off their recent June highs pretty aggressively, RGP's 4-day moving average has now moved below its corresponding 9-day average with the 9-day also having moved the stock's 18-day moving average. This means we have a confirmed sell signal in progress here in RGP which is confirmed by the recent MACD daily crossover.
Conclusion
Although Resources Connection continues to beat earnings expectations with gross margins remaining elevated, the company's negative growth path and deteriorating EPS revisions are making themselves known in the stock's technical charts. Although value investors may look to buy into this down move, we believe further deterioration may be on the cards here for quite some time. Let's see what Q4 numbers bring. We look forward to continued coverage.
For further details see:
Resources Connection: Shares Still Can't Catch A Bid (Technical Analysis)