RFV - RFV: An Appealing Value Portfolio With Low Quality As A Disadvantage
Summary
- RFV is an index-based fund offering exposure to pure-value players selected from the S&P 400.
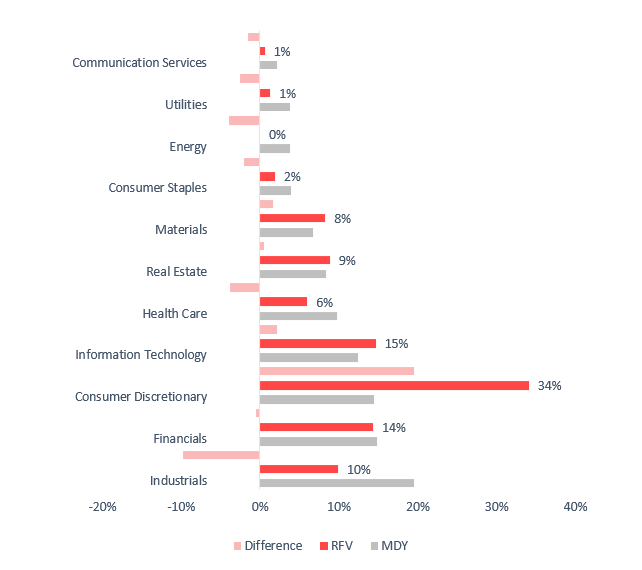
- In the current iteration, RFV favors the consumer discretionary, IT, and financial sectors while ignoring energy completely.
- RFV's portfolio has excellent valuation manifested in, among other things, a weighted-average earnings yield of 11%.
- On the negative side, its quality leaves a lot to be desired, with the medium-size factor more likely to blame.
- Mostly owing to the quality issue, RFV is a Hold at best.
With the growth style having a somewhat ebullient start to 2023, a hasty conclusion can be drawn that it is worth retiring both quality and value strategies, rotating back to the so-called pandemic winners. I would warn against this sophomoric view in my today's article on the Invesco S&P MidCap 400 Pure Value ETF ( RFV ).
I am of the opinion RFV is a solid choice for maximalist value investors seeking mid-cap exposure via simple but potent strategies. Yet the nuance is that the fund is likely a pass for investors preferring a balanced value & quality blend to reduce risks. In the note, I would like to provide essential facts to corroborate.
What principles are at the crux of RFV's strategy?
RFV does not use a panoply of multiples in its stock-selection process. Contrarily, the S&P MidCap 400 Pure Value Index which lies at the crux of its strategy pick underappreciated equities assessing just three metrics, namely Book/Price, Earnings/Price, and Sales/Price. The combination is far from ideal, to say the least, especially since the book value multiple (the ratio I believe could be misleading in many cases) is in this mix.
Yet, owing to the quality discount inherent to mid-caps, and also thanks to the rule that stocks demonstrating value and growth characteristics at the same time cannot join the pure-style indices, RFV does sport solid value characteristics as I will illustrate below.
How cheap is RFV's portfolio?
As of January 25, RFV had a portfolio of 77 stocks, with the top ten holdings having around 26.6% weight. It should be noted that these pure-value players are just a small portion of the S&P 400 index as they account for only 16.1% of the SPDR S&P MidCap 400 ETF's ( MDY ) net assets.
The weighted-average market capitalization of this portfolio is just around $4.98 billion, as per my calculations, as just 6.2% are allocated to three stocks with market values slightly above $10 billion while small caps (below $2 billion) are absent. MDY has a WA market cap meaningfully higher, around $7 billion .
Delving deeper, RFV's weighted-average earnings yield is impressive at 11%, which translates into a diminutive P/E of just 9x. A few of my dear readers might immediately note here that this yield is more likely driven by a large presence of financial and energy players, the two sectors with naturally modest valuations. For instance, financials have a reputation as a low-P/E haven, with the median multiple currently standing at about 11x.
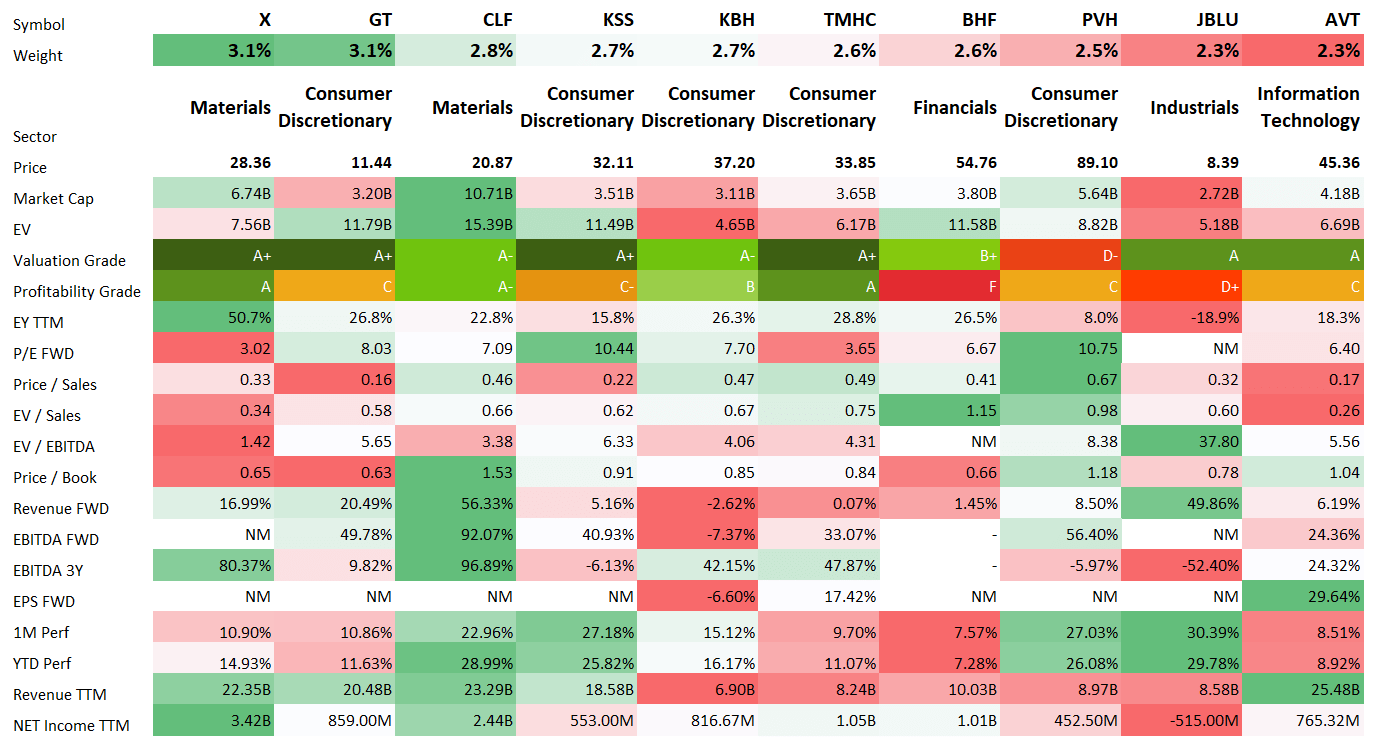
Alas, this hypothesis is only partly right. First, the fund has no energy exposure at the moment, at all, in contrast to MDY which has about 3.9%. It is worth noting this is the only GICS sector that is not represented in the RFV portfolio for now. Second, financials do not dominate this mix, being only the third-largest allocation with a 14.4% weight. So the sector that has the strongest influence on RFV's performance (being the largest contributor to the double-digit earnings yield) now is consumer discretionary, with Goodyear Tire & Rubber ( GT ) being the key example.
Created by the author using data from the funds
Most importantly, over 76% of the holdings have a Seeking Alpha Quant Valuation grade of B- or higher; this is an unquestionably telling result. In the meantime, overappreciated stocks (just D-rated, none is F-rated) did percolate into this mix but they account for only 9.5%.
Also, it is of note that the 11% EY as well as other low multiples are principally the direct consequence of the market pricing in only a single-digit weighted-average forward earnings growth rate; my calculations reveal that it stands at just 8.6%. When I analyzed the iShares Core S&P 500 ETF ( IVV ) a couple of weeks ago, its EPS growth rate was close to 16%. Regardless, there is another factor supportive of RFV's single-digit P/E, which I will elaborate on below.
Quality investors beware
A discount P/Es and other multiples reflect could be mostly the function of two issues, 1) a company has tepid, below-sector growth, 2) a company has lackluster profitability or/and is burdened by hefty debt, with a risk of going under.
One of the major downsides inherent to value strategies seeking underpriced equities in the small/mid-cap pool is that they are mainly exposed to the latter. And unfortunately, RFV's current version does have a few vulnerabilities here.
- First and foremost, only about 51.3% of the net assets are deployed to companies that have the strongest profitability composites in their respective sectors. This is a bleak result, to say the least, as I would prefer no less than 80%. To contextualize, a year ago , when I analyzed its larger peer Invesco S&P 500 Pure Value ETF ( RPV ), it had approximately 86% of the net assets parked in top-quality stocks.
- Second, over 15% of the holdings failed to turn a profit in the last twelve months; and though losses are not necessarily indicative of ineradicable quality issues, negative cash flows are much more serious, and 11.3% of RFV's holdings are net CFFO-negative.
- Besides, the median Return on Total Capital (excluding real estate and financials) is only marginally above 6%, a fairly lackluster result.
The table below combines the essential valuation, profitability, growth, and quality factors for the major ten holdings to bring slightly more color.
Created using data from Seeking Alpha and the fund
Performance discussion
RFV, RPV, as well as the Invesco S&P SmallCap 600 Pure Value ETF ( RZV ), were incepted in March 2006. During the April 2006 - December 2022 period, which includes two recessions, all these pure-value plays have underperformed IVV, with meaningfully higher standard deviations. Nevertheless, a bright spot is that RFV managed to deliver the second-strongest compound annual growth rate in this group, beating its small- and large-size-focused peers.
| Portfolio |
| RFV |
| IVV |
| RPV |
| RZV |
| Initial Balance |
| $10,000 |
| $10,000 |
| $10,000 |
| $10,000 |
| Final Balance |
| $38,295 |
| $41,155 |
| $36,925 |
| $26,898 |
| CAGR |
| 8.35% |
| 8.81% |
| 8.11% |
| 6.09% |
| Stdev |
| 24.81% |
| 15.63% |
| 23.11% |
| 30.27% |
| Best Year |
| 59.74% |
| 32.30% |
| 53.51% |
| 62.67% |
| Worst Year |
| -43.01% |
| -37.02% |
| -47.79% |
| -41.16% |
| Max. Drawdown |
| -63.58% |
| -50.78% |
| -69.71% |
| -72.27% |
| Sharpe Ratio |
| 0.41 |
| 0.55 |
| 0.41 |
| 0.31 |
| Sortino Ratio |
| 0.6 |
| 0.8 |
| 0.59 |
| 0.48 |
| Market Correlation |
| 0.89 |
| 1 |
| 0.88 |
| 0.82 |
Created using data from Portfolio Visualizer
However, it is not obvious from the table above that RFV is an excellent example of a capital shortage era outperformer. Thanks to its low-multiple portfolio, it delivered fairly strong results last year, outperforming the iShares Core S&P 500 ETF ( IVV ) by over 14% as well as RZV, thus notching its second alpha year in a row.
| Portfolio |
| RFV |
| IVV |
| RPV |
| RZV |
| Initial Balance |
| $10,000 |
| $10,000 |
| $10,000 |
| $10,000 |
| Final Balance |
| $9,600 |
| $8,184 |
| $9,872 |
| $9,319 |
| CAGR |
| -4.00% |
| -18.16% |
| -1.28% |
| -6.81% |
| Stdev |
| 26.63% |
| 23.13% |
| 23.76% |
| 29.17% |
| Max. Drawdown |
| -16.02% |
| -23.93% |
| -17.38% |
| -20.47% |
| Sharpe Ratio |
| -0.1 |
| -0.83 |
| -0.02 |
| -0.17 |
| Sortino Ratio |
| -0.15 |
| -1.06 |
| -0.03 |
| -0.26 |
| Market Correlation |
| 0.93 |
| 1 |
| 0.86 |
| 0.92 |
Created using data from Portfolio Visualizer
And even though there are signs that the narrative is changing, this pure-value fund is still performing strongly this year.
Final thoughts
In my opinion, despite recent bullish economic signs , maintaining a footprint in cheaper equities should still be considered to ensure adequate diversification in case the return to dovishness would not be as quick and decisive as some bulls might suggest.
That being said, I am somewhat disappointed with RFV's exposure to the quality factor, so assigning a Buy rating to this vehicle would contradict my current focus on robust profitability.
On a side note, its 35 bps expense ratio is not wafer-thin, though it is still below the 40 bps median ER for all other rated ETFs. Nevertheless, liquidity is rather strong .
Overall, assuming all discussed above, I would opt for a Hold rating.
For further details see:
RFV: An Appealing Value Portfolio With Low Quality As A Disadvantage