CA - Riley Exploration Permian: Strongest Relative Strength In U.S. Oil/Gas And Bargain Valuation
2023-03-27 08:51:18 ET
Summary
- Riley is sitting on the cusp of a big jump in revenues on smart acquisitions, and would be a real beneficiary of any uptick in oil/gas quotes during 2023.
- The valuation story looks like a bargain vs. peers and competitors operating in the Permian Basin.
- Outstanding share momentum and price relative strength over the last six months is noteworthy, and could indicate much better days ahead.
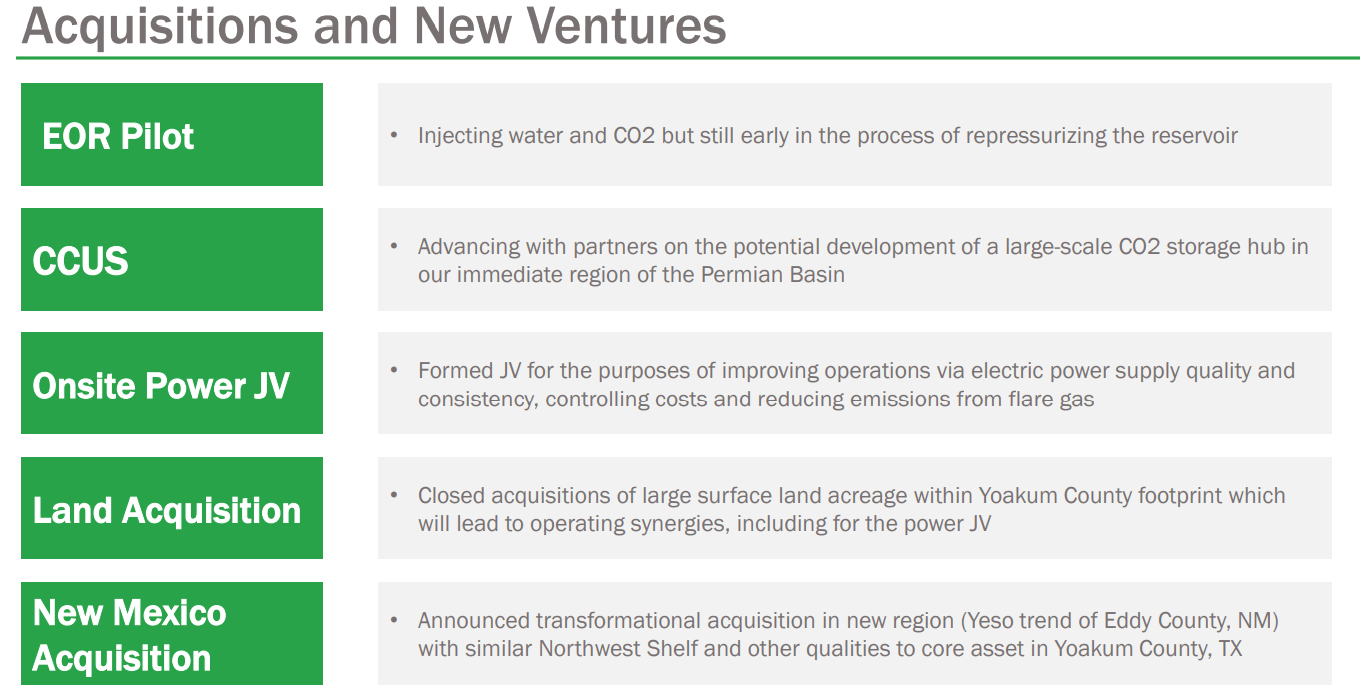
I wanted to mention a stock hitting the top of many of my momentum sorts during March 2023, Riley Exploration Permian ( REPX ). The stock has been a top performer in the U.S. Oil/Gas Exploration & Production sector over the last six months. A price hovering near a yearly high appears to be a function of excellent management and high profit margins from wells developed mostly in Texas. A super-low valuation vs. peers, the recent purchase of new producing and prospective drilling acreage in nearby New Mexico, alongside carbon capture initiatives could support a robust price rise the rest of 2023, especially if another spike in energy commodity pricing takes place.
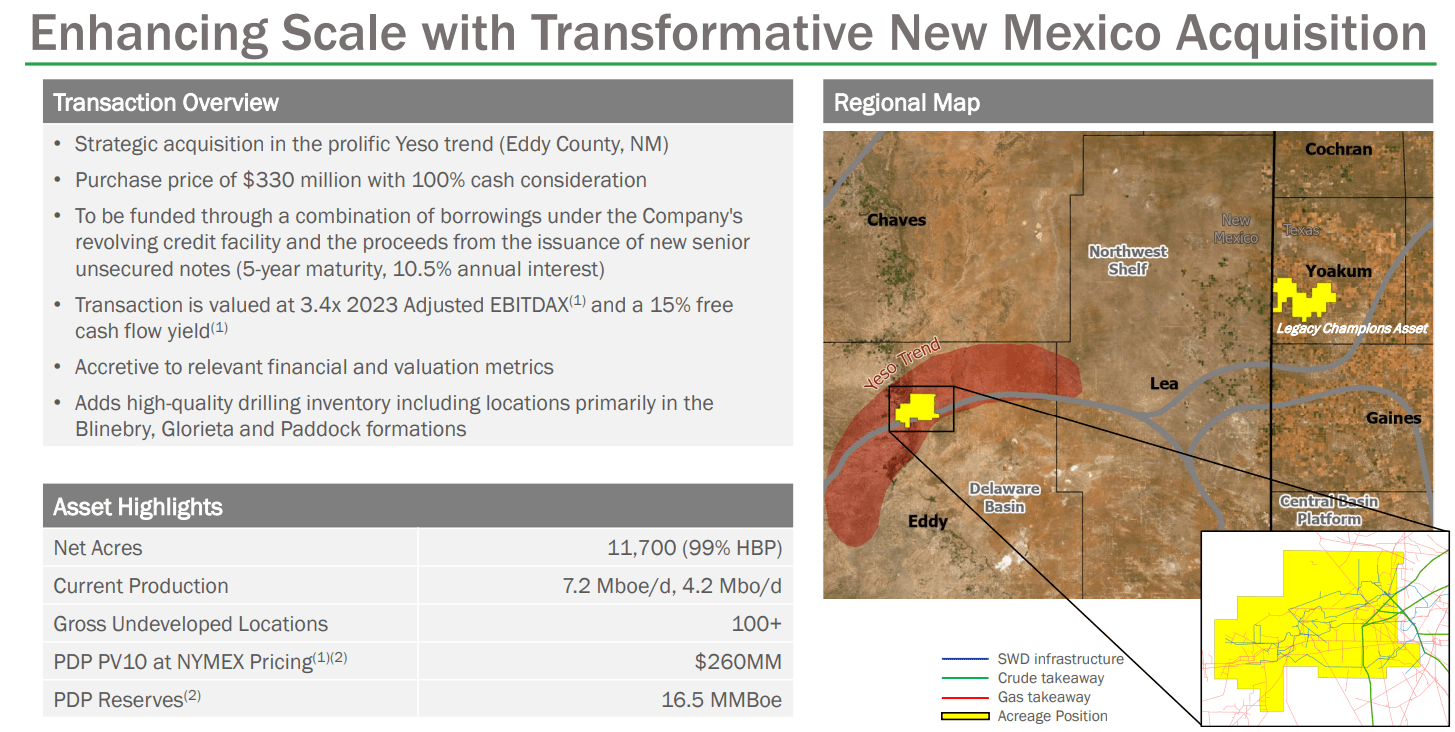
On February 28th, management announced the $330 million cash acquisition of properties in New Mexico held by Pecos Oil & Gas, LLC , an affiliate of Cibolo Energy Partners LLC , including $200 million of the purchase financed with newly issued debt . The good news is this acquisition is quite manageable for the company. It’s actually a natural progression for Riley with little net debt and monster cash flows coming in the door during 2022-23. At the end of December, the enterprise held $182 million in total liabilities vs. trailing cash flow from operations of $170 million.
Management was left with the choice of standing pat with its assets, moving to a net liability-free condition in 2023-24, or engaging in a more aggressive expansion with a bolt-on transaction. Since this firm has a history of adding assets and future growth (with revenues growing to a projected $486 million in 2024 from a predecessor company total of $4 million in 2016), the deal makes sense on a variety of levels. The best part of the argument is the deal is accretive to existing shareholders from the start. According to the Riley press release ,
Attractive Financial Accretion: The transaction is valued at 3.4x 2023 Adjusted EBITDAX and a 15% free cash flow yield, accretive relative to Riley Permian's 2023 stand-alone metrics. On a combined basis, the transaction is forecasted to increase Riley Permian's Adjusted EBITDAX by ~50% and Free Cash Flow by ~70% in 2023 (vs. Riley Permian standalone), with no increase in share count.
Company Presentation - New Mexico Asset Acquisition, Early 2023 Company Presentation - Operating Highlights, Late 2022 to Early 2023
Exceptional Valuation Before The Deal
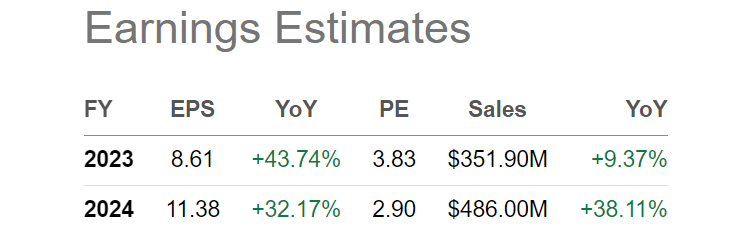
The primary reason to contemplate Riley as a purchase proposition is its conservative valuation on trailing and future expected operating results. How many other energy names or stocks anywhere on Wall Street are priced at 4x 2023 income forecasts or 3x 2024? Including the new accretive asset acquisition, this may be the bottom-line angle why the share quote is rising during a steep drop in other oil/gas producer names.
Seeking Alpha Table - Riley Exploration, Wall Street Analyst Estimates for 2023-24, Made on March 25th, 2023
After-tax profit margins are excellent at 37% of sales, when measured against peers in the U.S. oil/gas producer industry, and should remain in the top tier after the New Mexico assets are included. Below I have charted both large and small-cap producers on final trailing profit margins. This list includes ConocoPhillips ( COP ), EOG Resources ( EOG ), Pioneer Natural ( PXD ), Devon Energy ( DVN ), APA Corp ( APA ), Antero Resources ( AR ), Range Resources ( RRC ), Evolution Petroleum ( EPM ), Obsidian Energy ( OBE ), Berry ( BRY ), and Callon Petroleum ( CPE ). Riley is a smaller operation with a total equity value around $660 million at today's $33 quote per share.
YCharts - U.S. Oil/Gas Producers, Trailing Final Income Margins, 6 Months
With sizable growth in sales coming this year and next from current operations and the newly acquired assets, a price to forward 1-year estimate of income around 2.9x is incredibly low vs. the industry average of 5x and S&P 500 multiple a little under 20x.
YCharts - U.S. Oil/Gas Producers, Price to Forward 1-Year Estimated Earnings, 6 Months
When we include Riley’s stronger-than-typical balance sheet, with only minor debt almost equal to cash on hand (pre-takeover of the New Mexico properties), the enterprise value calculation vs. EBITDA or revenues was also at bargain-basement levels. 2.5x EBITDA on a forward-looking basis was quite inexpensive vs. peers and competitors. And, EV to sales of 2x fits nicely into the industry pack. Remember, the EV numbers will likely be higher once the latest deal has been completed.
YCharts - Riley Exploration, EV to Forward Estimated EBITDA & Revenues, 18 Months YCharts - U.S. Oil/Gas Producers, EV to Forward Estimated EBITDA, 6 Months YCharts - U.S. Oil/Gas Producers, EV to Forward Estimated Revenues, 6 Months
Rock-Star Relative Strength
Investors and financial institutions have also been motivated to buy shares in Riley during early 2023, even in the face of sliding energy prices overall. On a 6-month total return chart, the stock’s +96% jump is a real eye opener compared to peers in steep decline.
YCharts - U.S. Oil/Gas Producers, Total Returns, 6 Months
When we look at a 1-year chart, Riley has also been a top investment return choice, with a +32% total return gain vs. the -11% loss from the entire sector’s SPDR Oil & Gas E&P ETF ( XOP ).
YCharts - Riley Exploration vs. XOP ETF, Total Returns, 1 Year
Lastly, a 3-year chart drawn back to the panic selling lows of the COVID-related economic shutdown in March 2020 point to Riley as a wonder choice, assuming you have a goal of outsized gains in your portfolio. The +601% total return advance has more than DOUBLED the industry’s +274% rise!
YCharts - Riley Exploration vs. XOP ETF, Total Returns, 3 Years
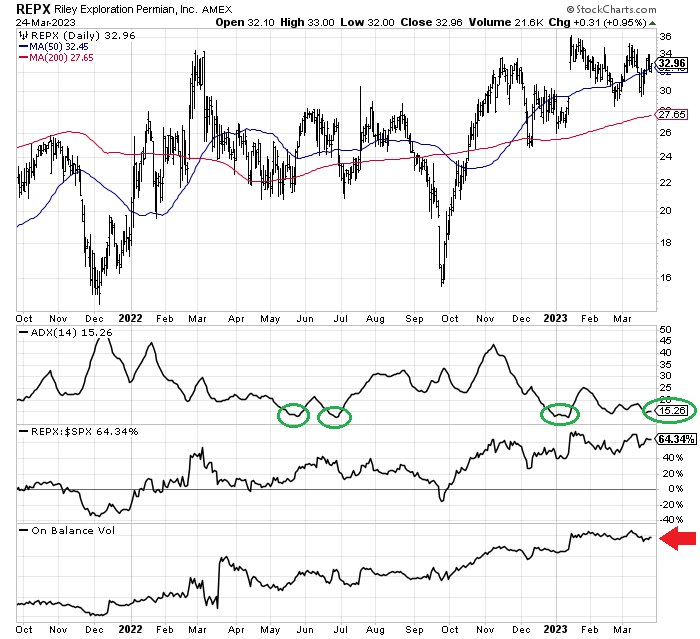
I have drawn an 18-month chart of daily price and volume changes below. Some highlights from Riley's momentum activity include "price" just beneath 52-week highs, and above both its important 50-day and 200-day moving averages.
A low 14-day Average Directional Index reading like today has existed at short-term price bottoms of late, circled in green. Riley has vastly outperformed the S&P 500 by +64% over a year and a half. Plus, On Balance Volume trend signals are excellent (marked with a red arrow).
StockCharts.com - Riley Exploration, 18 Months of Daily Price & Volume Changes, Author Reference Points
Final Thoughts
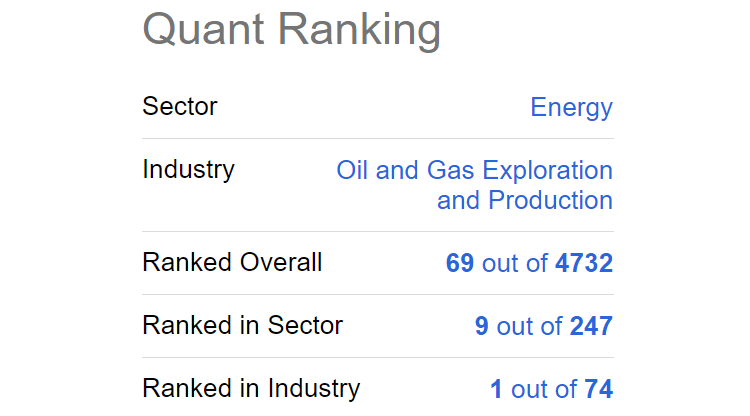
My bullish view is corroborated by Seeking Alpha’s Quant Ranking of Riley Exploration Permian. SA's computer sorts put a #1 readout for share momentum on Riley out of the U.S. oil/gas producer category and Top 2% overall score vs. the general stock market.
Seeking Alpha Table - Riley Exploration Quant Ranking, March 26th, 2023
For those wanting to add exposure to oil/gas assets, especially if supply constraints appear because of the still high odds the Russian war with Ukraine spreads or Israel decides to bomb Iran’s nuclear development program this year, Riley is a superb choice to consider. Factoring in the new assets being acquired, including the price paid and debt accumulated, Riley could be net liability free in as little as 3 years, and possibly more like 2 years on another big jump in energy selling prices (assuming all cash flow is guided toward debt reduction).
What are the risks? The biggest variable that could keep a lid on the share quote is a recession outlook for the global economy. Cracks are appearing in demand for goods/services, caused by 2022's extraordinary inflation jump and the modern-record spike in related interest costs on debt. The US$120 per barrel crude oil high outlined right after Russia invaded Ukraine has fallen all the way back to $70, roughly the same as late 2021. In addition, natural gas prices in the U.S. have tumbled back to the level existing in 2020.
Without a meaningful rise in energy prices later in the year, 2022 will likely mark the high-water point for the oil/gas E&P sector, with investor interest fading from today. Such could be argued as an excuse to price Riley at a low valuation on forward numbers. The good news is management has proven itself over the last decade, meaning I would sell other energy stocks first ahead of Riley. I believe the downside is probably limited to whatever the S&P 500 generates in a continued bear market (-15% to -25% as a possibility). Even assuming major earnings and sales misses vs. present forecasts at Riley Permian, the valuation seems to be discounting a severe recession already.
On the upside, if crude oil and natural gas prices bottom in the first half of 2023 on recession fears, then advance precipitously in the second half from renewed central bank money printing initiatives and supply troubles overseas, projecting a $50-$60 Riley share price is easy (around 5x EPS in 2024, with a slight income beat vs. current analyst expectations). That works out to +50% to +65% in total returns including dividends possible over the next 12-18 months. I rate shares a Buy .
For sure, the company now represents a sound value play other oil/gas majors may seriously consider for acquisition, consolidating operations under their umbrella.
Thanks for reading. Please consider this article a first step in your due diligence process. Consulting with a registered and experienced investment advisor is recommended before making any trade.
For further details see:
Riley Exploration Permian: Strongest Relative Strength In U.S. Oil/Gas And Bargain Valuation