BKR - RYE: The RSP ETF Of The Energy Sector
Summary
- The Invesco equal-weight RYE ETF attempts to mitigate concentration risks in the energy sector using the same strategy as sister fund - the RSP ETF - does in the S&P 500.
- The fund holds equal weight positions in 24 energy companies and rebalances on a quarterly basis. The TTM yield is an attractive 3.52%, 2x+ the income of the S&P 500.
- RYE has a 0.40% expense fee. That being the case, let's take a closer look at the ETF to see if its performance rationalizes its relatively high cost.
The strategy for the Invesco S&P Equal-Weight Energy ETF ( RYE ) is very similar to its sister fund, the Invesco S&P500 Equal-Weight ETF ( RSP ), but with a focus narrowed down to the energy sector. Both funds attempt to eliminate concentration risks by holding equal-weight positions throughout its investment universe. However, the RYE ETF's expense ratio (0.40%) is double that of the very popular RSP ETF. Today, I'll take a look at the RYE ETF to see if its performance is worth the relatively high cost of owning it.
Investment Thesis
By now, most investors are abundantly aware of the reasons to invest in the energy sector. Russia's conflict in Ukraine has effectively broke the global energy supply chain, causing a natural gas crisis in the EU which has been - so far - relatively effectively mitigated by increased LNG imports, primarily from the U.S.:
Reuters
Meantime, in the oil sector, OPEC+ has continued to hold millions of bpd of oil off the market while U.S. shale oil producers have been very disciplined in production growth despite the war-time environment and the high inflation that is punishing U.S. consumers. However, while oil prices have dropped considerably from the early days of Russia's invasion of Ukraine, WTI is still ~2x above the big shale oil producers' breakeven point (less than $40/bbl WTI) and significantly higher than the five-year average:
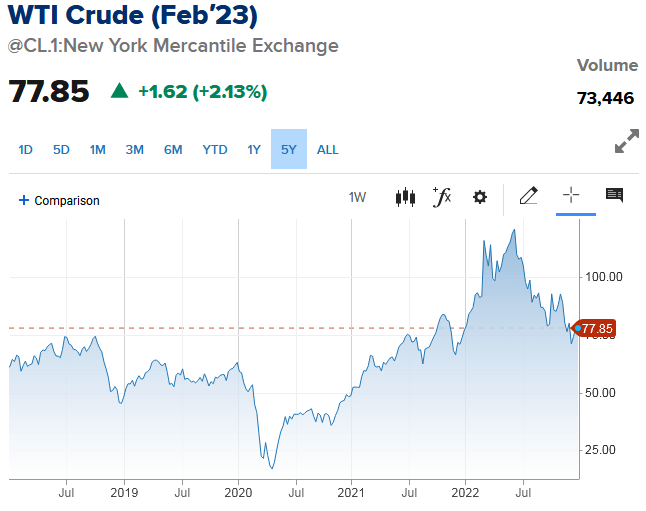
With the current fundamental and price factors being relatively bullish for the energy sector, let's take a closer look at the RYE ETF to see how it has positioned investors for success.
Top-10 Holdings
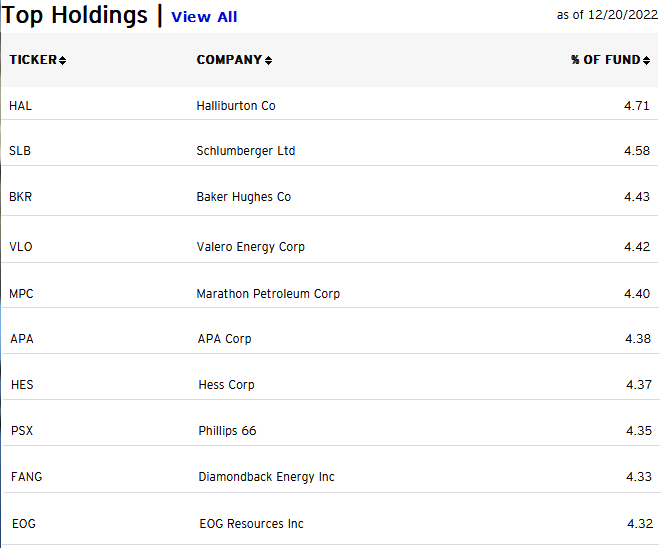
The top-10 holdings in the RYE ETF are shown below and were taken directly from the Invesco RYE ETF webpage . The top-10 holdings equate to a relatively diversified 44.3% of the entire 24-company portfolio.
Now, before investors get concerned because they don't see the typical leaders in an energy fund in the top-10 list - big companies like Exxon ( XOM ) and Chevron ( CVX ) - don't worry, they are in the fund (with weights of 4.28% and 4.27%, respectively).
What's important to understand with the RYE ETF is that given the 24 companies, an equal-weight distribution at rebalancing time would equate to a 4.167% weight in each of the holdings.
That being the case, what you see above in the current top-10 holdings are those companies that have outperformed since the last rebalancing point and therefore result in an overweight as compared to the 4.167% equal-weight benchmark. Clearly, energy services companies Halliburton ( HAL ), Schlumberger ( SLB ), and Baker Hughes ( BKR ) have led the energy sector since the end of Q3.
Also note that the refining sector, represented by Valero ( VLO ), Marathon Petroleum ( MPC ), and Phillips 66 ( PSX ) also have been strong of late. And, of course, the shale operators are nicely represented by natural gas focused APA Corp ( APA ), as well as Permian Basin producers Diamondback Energy ( FANG ) and EOG Resources ( EOG ).
These being the outperformers since the last rebalancing point, investors might think that the RYE ETF has likely outperformed the typical energy ETF that has been overweight Exxon and Chevron since the end of Q3. However, that has not been the case:
As can be seen by the graphic, the SPDR Energy ETF ( XLE ), the Vanguard Energy ETF ( VDE ), and the Fidelity Select Energy ETF ( FSENX ) have all outperformed the RYE ETF since Oct. 1.
Let's zoom out a bit and compare those same funds over the past year:
As can be seen, the RYE ETF is - once again - the laggard of the selected competitors. Generally, what this shows is that the larger market-cap energy companies have been out-performing an equal-weight energy portfolio.
Valuation Metrics
The following chart shows some valuation metrics for the entire RYE portfolio as compared to the S&P 500.
| RYE ETF |
| S&P500 |
| P/E Ratio |
| 8.24x |
| 19.88x |
| Fwd P/E Ratio |
| 7.31x |
| 19.12x |
| Price-to-Book |
| 2.58x |
| 3.82x |
| TTM Yield |
| 3.52% |
| 1.71% |
As you can clearly see, and likely expect if you follow the energy sector, the RYE ETF currently trades at a significant valuation discount as compared to the S&P 500 while delivering more than twice the income.
Risks
While the RYE portfolio might sell at a deep-discount to the overall market, there's a good reason: The O&G sector is cyclical and, as commodity price takers, these companies are directly affected by the prices of natural gas and oil, which exist in a global market that can be affected by a plethora of geopolitical factors - just as we saw this year with Russia's invasion of Ukraine, its weaponization of natural gas supply to the EU, and the sanctions placed on Russia by the U.S. and its democratic and NATO allies.
In the short term, high inflation and rising interest rates could cause a global economic slowdown and/or recession. That would put downward pressure on O&G prices due to significant demand destruction.
Longer term, the EV transition will likely result - and already is resulting - in significant gasoline demand destruction. As I reported in my recent Seeking Alpha article on the Fidelity MSCI Energy ETF ( FENY ), the global gasoline demand growth trend-line is heading toward zero, and, in my opinion, driven by the combination of high gasoline prices this year with the emergence of a plethora of new EV models to compete with Tesla (TSLA), EV adoption is only going to accelerate. Indeed, EVs are now expected to be more than 50% of U.S. new vehicle sales by 2030 . Globally, the IEA says EVs will equate to 60% of new vehicle sales by 2030.
However, even if gasoline demand growth peaks and heads down, the fact is the world is still consuming ~100 million bpd of oil. It will likely take at least a decade or two to reduce that amount by even 50%. The other side of the coin is that, as I pointed out in my recent Seeking Alpha article The Age of Energy Abundance , despite the false narratives being pushed by so many politicians in the U.S. today, the planet really does have an abundance of energy - and that includes oil and natural gas. That being the case, there are a lot of competitors than can produce them - in volume - and, as we saw in the idiotic "drill baby drill" years, that resulting in the "lost decade" for energy stocks when Exxon actually delivered a negative total return to investors for 10 years, there's always the possibility that producers will over-produce into an already over-supplied global market and cause commodity price declines.
Summary and Conclusion
The RYE ETF is using an interesting equal-weight investment strategy for the energy sector. However, its high expense (0.40%) combined with its relative under-performance as compared to its peers does not present a compelling investment opportunity for investors. For those wanting diversified exposure to the energy sector, I would suggest simply staying with the XLE and/or the FENY ETFs. So, if you own the RYE ETF I would suggest selling it and buying the XLE ETF instead. XLE has an expense fee of 0.10%, a full 40 basis points lower than the RYE ETF.
I'll end with a five-year total returns comparison of the RYE ETF vs. XLE and FENY and note that the XLE has outperformed RYE by 9.5% over the past five years:
For further details see:
RYE: The RSP ETF Of The Energy Sector