RTX - S&P 500 In 2024: Macros And Market Breadth Hinder 2023 Repeat
2023-12-14 12:34:50 ET
Summary
- While the S&P 500 has risen substantially this year and will likely close the year on a high note, overall inter-sector and intra-sector health is very poor.
- Tech and tech-adjacent sectors have had bull runs while other sectors show strong correlations with inflationary movements. Overall, "consumer-facing" sectors have seen value deflations.
- There's a clear champion among the Magnificent Seven: Nvidia. AI will dominate market narratives for a while and create long-term ripples in the American workforce.
- A widening gap between American generations has led to spending patterns creating tailwinds for massive outperformance, rivalling tech trajectories by two cruise ship companies.
- Rate cuts in the second half of 2024 will likely create sector rotation opportunities. However, the next year will be nowhere close in performance compared to 2023.
In the Year Till Date (YTD) as of the 11th of December, the S&P 500 ((SPX) in index form and (SPY) in ETF form) has risen to around 20.5%. For all intents and purposes, the index will close the year at a net positive albeit nowhere close to the highs seen in July. Since the S&P 500 (SP500) is widely considered to be the "U.S. market," there is an imputation in some quarters that inflation/affordability concerns - along with other issues - have been shrugged off by key participants. This isn't exactly true.
From Many Sectors to a Few
A historical analysis of the index - along with a consideration of the somewhat interrelated evolution of aggregated investor favor and the American economic engine - yields some fascinating insights:
Source: Created by Sandeep G. Rao using data from Bloomberg
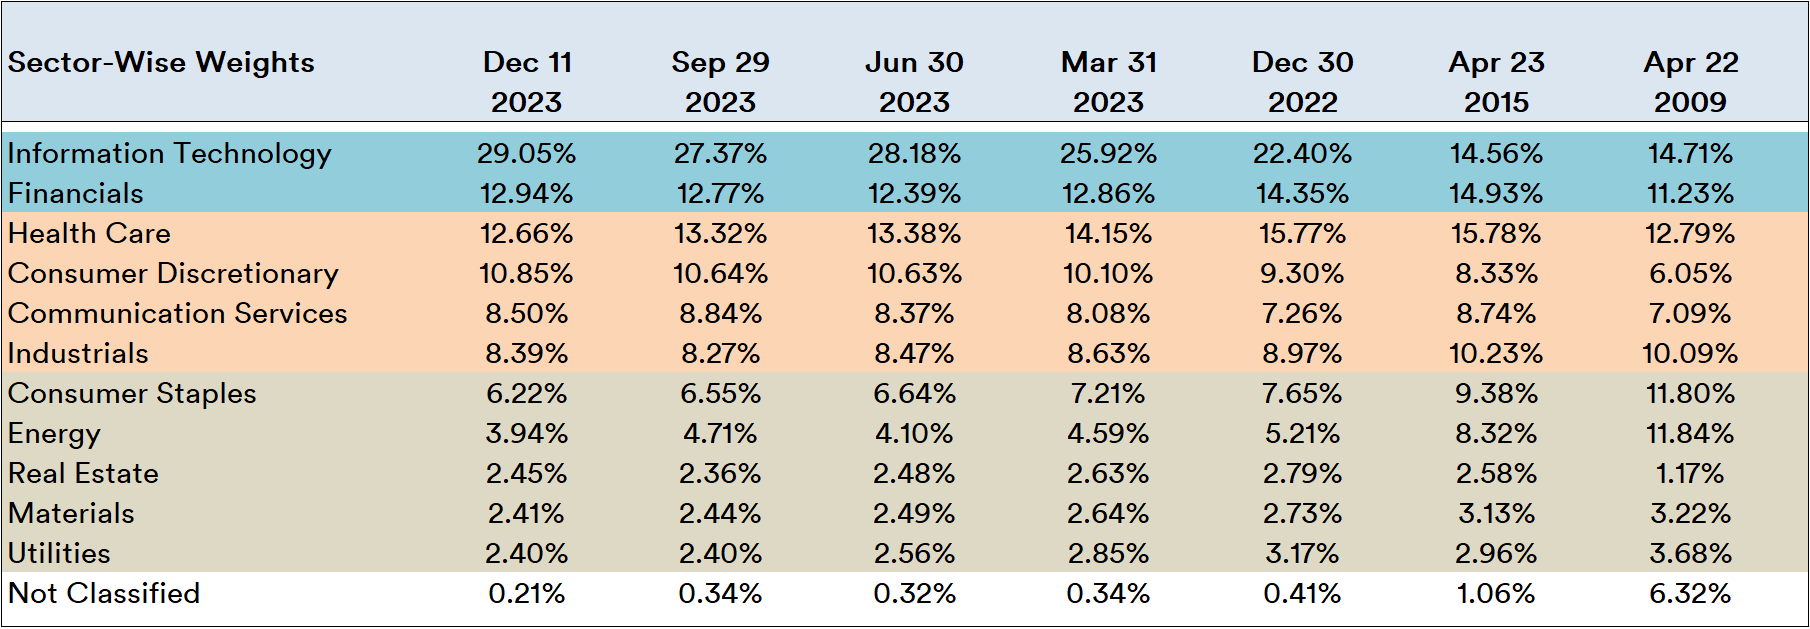
In the year after the levee broke on the subprime mortgage market (i.e., 2009), there was an overall "normalization" of the index's sectors, with the Real Estate sector remaining deflated but active. A couple of years after the effects of the Global Financial Crisis ((GFC)) were largely shrugged off (i.e., 2015), a degree of "realignment" is visible: while Energy and Consumer Staples retreated a little, nearly every other sector registered slight gains except for Information Technology (a particularly large subset of "tech" stocks).
Note: The tables are computed using the portfolio holdings of the ETF SPY. In 2009, "Not Classified" were largely "downstream" energy companies, Altaba (the now-extinct parent of Yahoo! and Dollar General). From 2015 onwards, it was U.S. Cash.
In the present year, nearly every sector outside of Information Technology and the "tech-adjacent" Consumer Discretionary (consisting of the likes of Tesla (TSLA), Amazon (AMZN) and Shopify (SHOP), among others) has shrunk in weight relative to 2015. Communication Services, which consists of the likes of Alphabet Inc (GOOG)(GOOGL) and The Walt Disney Company (DIS), has held steady.
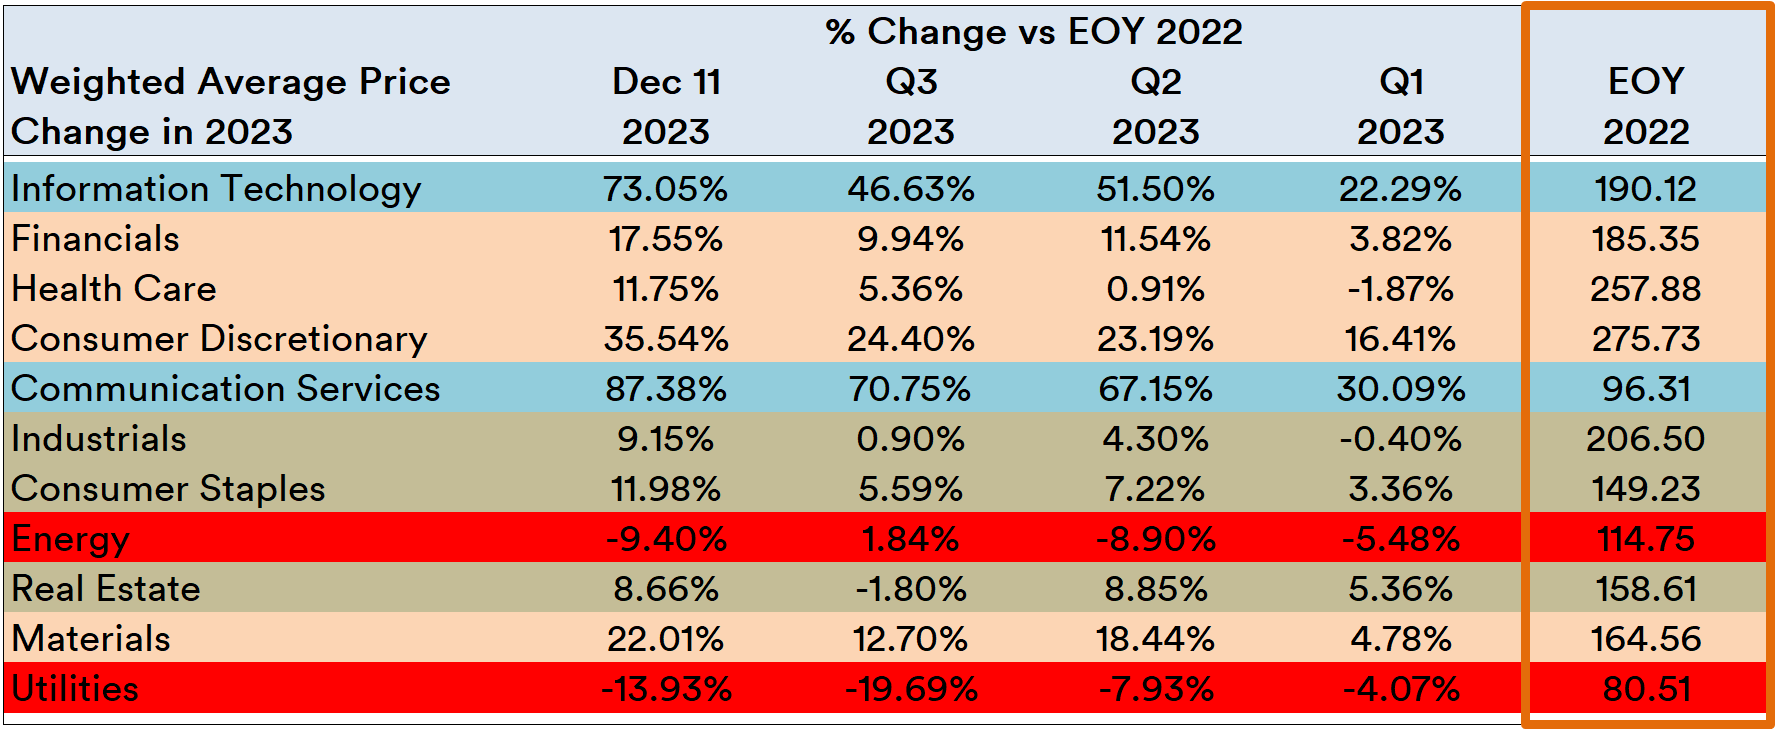
The weighted average price within each sector, however, shows that sector performance relative to the index is heavily skewed:
Source: Created by Sandeep G. Rao using data from Bloomberg
In terms of performance in each quarter (plus the 11th of December) relative to the 2022's End of Year (EOY) weighted average, Information Technology, Communication Services and Consumer Discretionary (i.e., "Tech" and then some) have shown the most extreme price swings upwards. Financials, all things considered, also remained somewhat resilient and registered strong and steady gains after Q1. The performance of nearly every other sector, however, is largely correlated with inflationary price increases throughout the year with no substantial overall forward outlook suggesting growth in unit consumption being imputed.
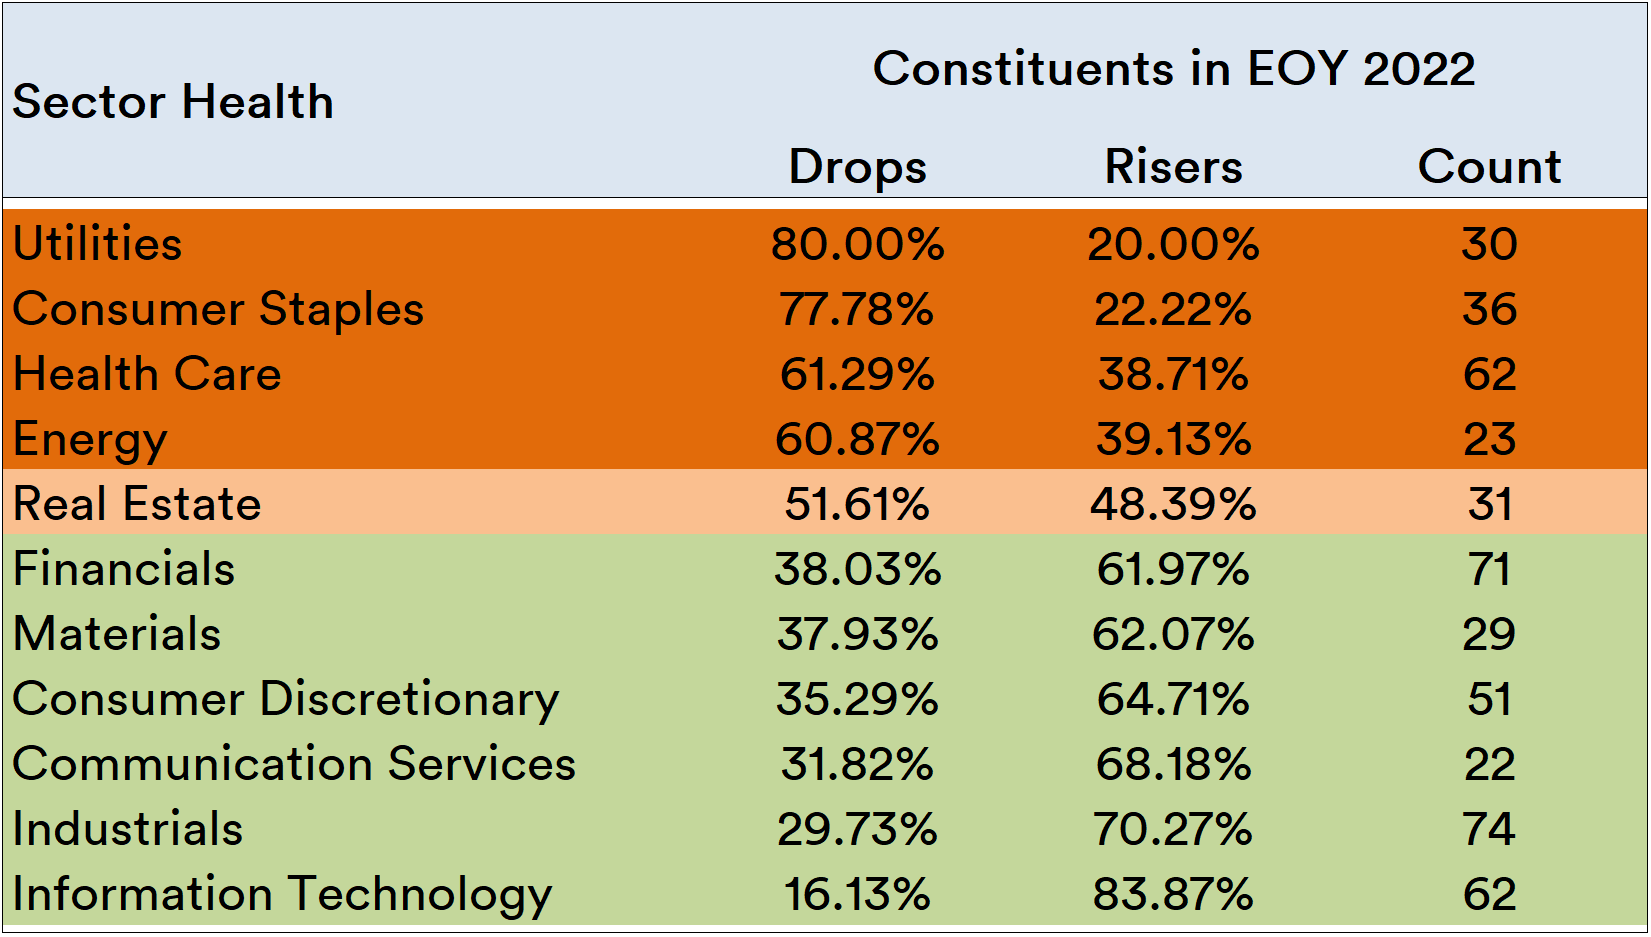
However, rising tides haven't raised all boats within each sector but not every sector has had a similar fate:
Source: Created by Sandeep G. Rao using data from Bloomberg
With respect to the constituents present at EOY 2022 (and not new entrants or re-entrants), "consumer-facing" sectors such as Utilities, Consumer Staples and Health Care have seen the highest percentages of value deflations - calculated as price seen in EOY 2022 versus the 11th of December. Geopolitical tensions lie heavy on the Energy sector, with crude oil doldrums likely to keep this sector running at neutral in 2024. Real Estate, meanwhile, has had a "fair" year with a nearly equal performance on both sides.
Stocks: Magnificent Seven Aren't Alone
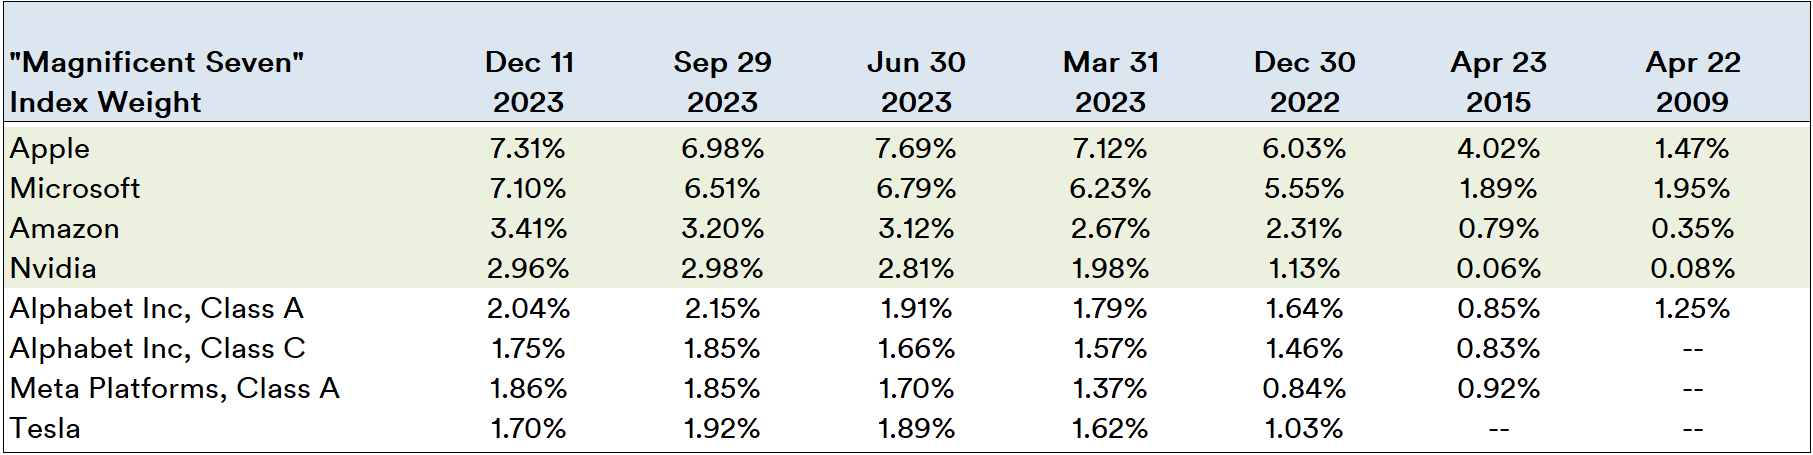
In 2023, much ado was made about the "Magnificent Seven" - a collection of seven "tech" companies that have been attributed to the greatest amount of movement. In historical terms, however, the story is a little more nuanced :
Source: Created by Sandeep G. Rao using data from Bloomberg
As of the 11th of December, Alphabet, Microsoft ( MSFT ) and Apple ( AAPL ) have had a 200-400% increase in index weight relative to 2009. In the YTD, these companies' weights have risen by 21-45%. Amazon's weight has grown by 874% since 2009 and 48% in the YTD. In the YTD, Tesla's 65% weight growth outpaced all about one of the Magnificent Seven: Nvidia (NVDA). Nvidia is the outright champion of the Magnificent Seven, registering a 3,600% growth since 2009 and 162% in the YTD.
Note: S&P had a rule change in 2014 to allow Google to have both its share classes present in its indices, which was later expanded to include all current constituents in 2015. It was then decided in 2017 that companies under consideration for inclusion must not have multiple share classes . This decision was reversed in April this year.
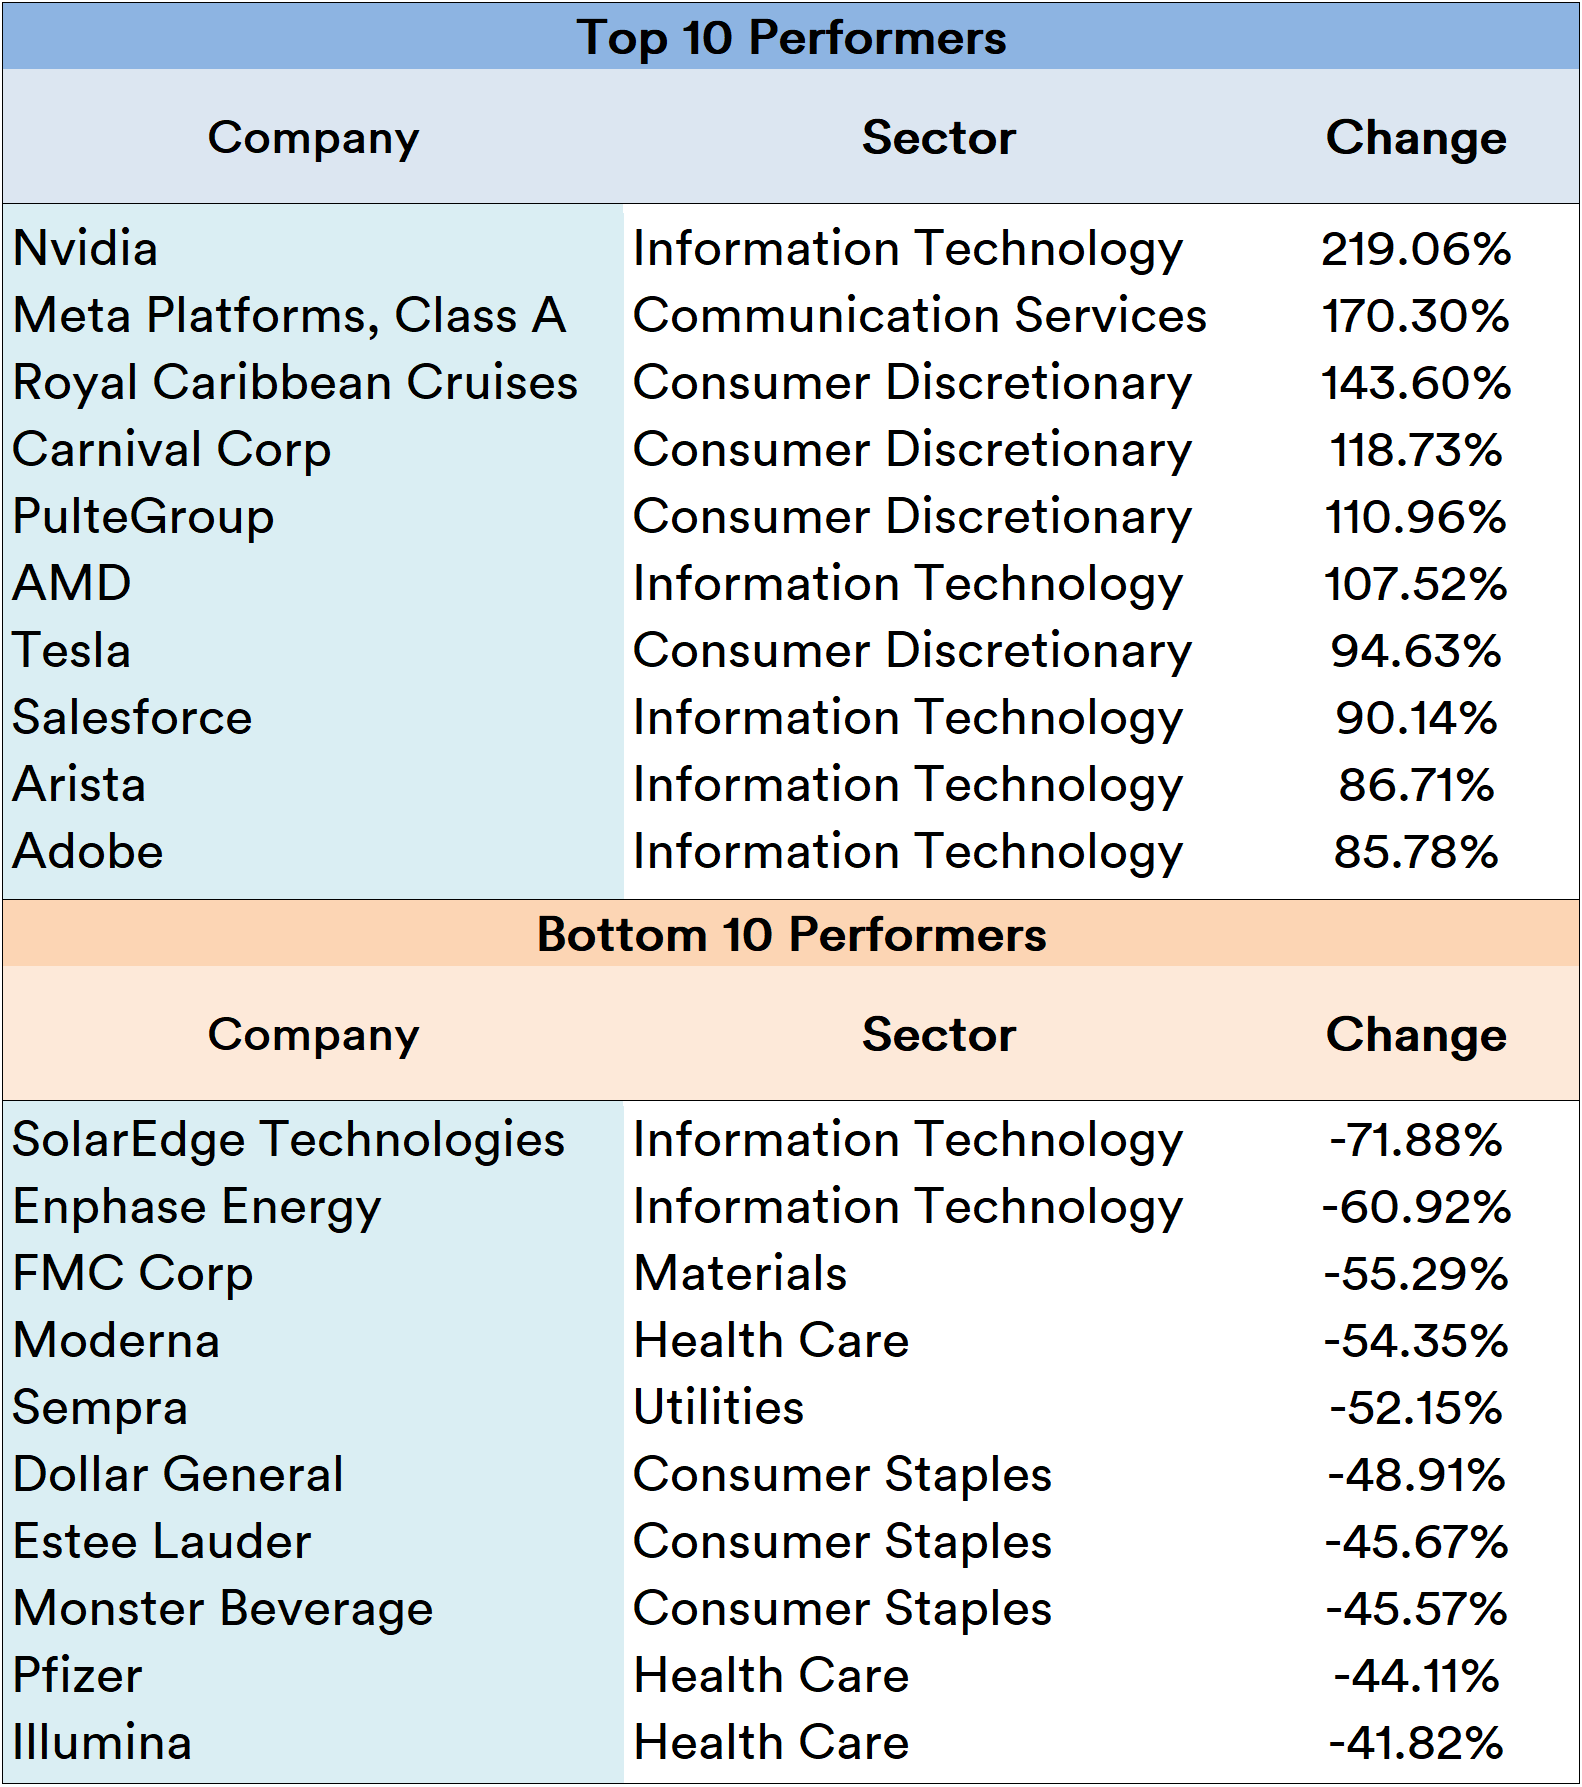
In terms of net performers, however, not all of the Magnificent Seven feature in the Top 10 Performers in the YTD. However, all of the performers were "Tech and then some" companies.
Source: Created by Sandeep G. Rao using data from Bloomberg
While the two biggest laggards this year were also "Tech" stocks, the other 8 were from "consumer-facing" sectors. On the other hand, cruise ship companies Royal Caribbean Cruises ( RCL ) and Carnival Corporation ( CCL ) have had their strongest showing in years.
Macro Stress
It bears noting that Real Estate, once a cornerstone of the American buyer, is steadily eroding in its consideration as a "consumer-facing" sector: as early as 2021, it was reported that around a quarter of all U.S. homes were purchased by private investors, thus leading to an increase in rents across the U.S. Earlier this month, a municipal agency in Boston determined that private investors - an active buyer segment since 2004 - bought a little under a quarter of all homes in the city and drove up rents by up to 70% in the past two years.
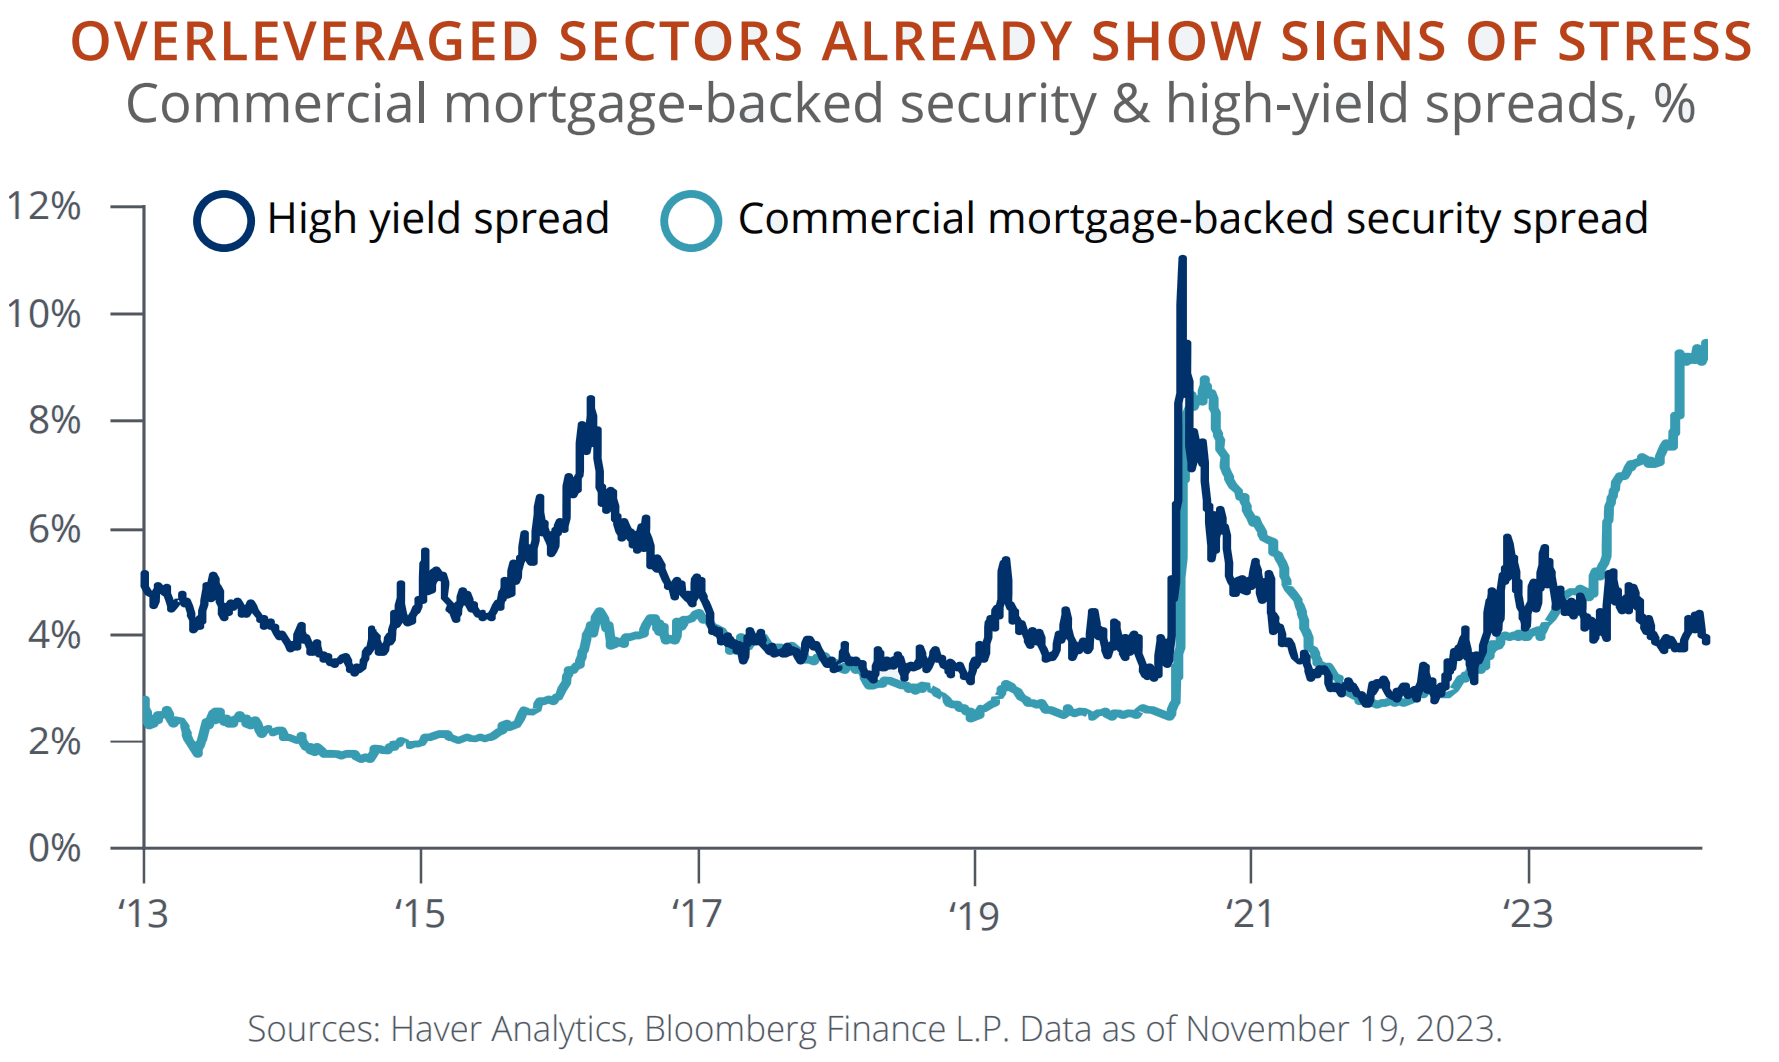
Mortgages and junk bonds are typically heavily overleveraged spaces which J.P. Morgan warns in its Outlook for 2024 are under increasing stress.
Source: J.P. Morgan Wealth Management
Given that this stress weighs less on the average private investor than on the American buyer, the argument for Real Estate being a bellwether for "average" consumer behavior grows ever weaker.
The cruise ship companies' performance is largely attributable to two reasons. Firstly, falling oil prices imply that "bunker" fuel is substantially cheaper and thus a significant operational cost saving for these companies. Second, they are the incidental beneficiaries of a looming gap between generations of Americans. As per a Bank of America report published in June , spending increased by 5.3% for Traditionalists (born 1928-1945) and 2.2% for Baby Boomers. In contrast, spending fell by about 1.5% for younger generations. Older generations splurged on the likes of travel, vacation and restaurants while the more numerous younger generations face looming (and growing) student debt.
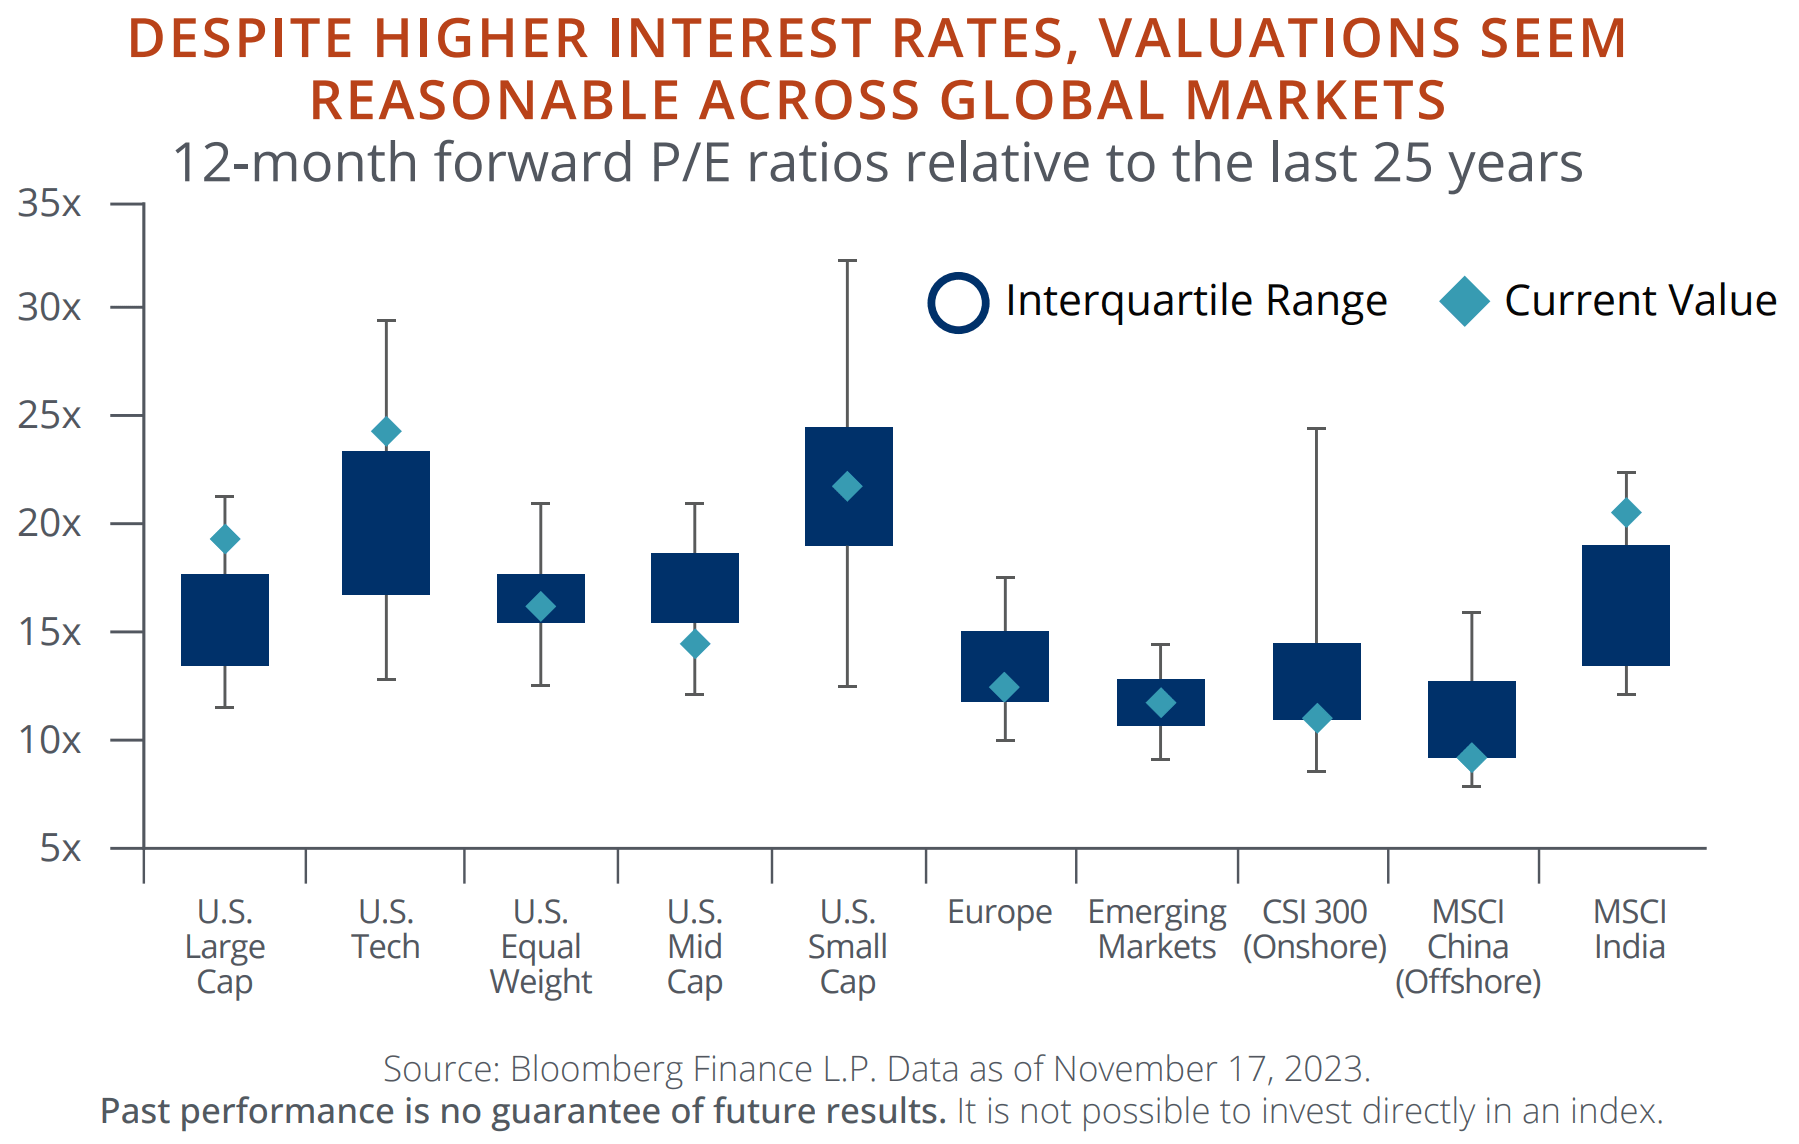
Neither the cruise ship companies nor home-building companies such as PulteGroup ( PHM ) could be considered the leading components of the S&P 500; they presently account for a total of 0.17% in weight. Overall, JP Morgan also states in its outlook that America's large-cap and "tech" stocks are valued over interquartile ranges. When considering the entirety of the globe's equities, the bank contends that U.S. valuations seem entirely reasonable, given that free cash flow margins are 30% higher than they were 10 years ago and an average 11x EBITDA to interest expense.
Source: J.P. Morgan Wealth Management
However, what is evident is that the typical overvaluation (relative to earnings) seen in almost every American stock is steadily eroded in both mid- and small-cap stocks. This ongoing rationalization will inevitably creep into more and more stocks in the "Large Cap" space. The bank's strategists contend that the U.S. economy could see a growth slowdown in the first half of 2024 but wouldn't fall into a recession (at least in the technical sense).
The ongoing crush on spending upon the more populous younger generations has not been commented upon in depth.
Charting Forward
On the 13th of December, the Federal Reserve announced that interest rates will be left steady (as expected) with a forward-looking projection indicating that the policy rate will be lower by the end of 2024. While Year-on-Year (YoY) Consumer Price Index ((CPI)) has been nowhere close to the Federal Reserve's target of 2%, the central bank seems disinclined to be more aggressive in mopping up excess money supply at the risks of upending markets even further in a year that is likely to be highly contentious (politically). If November's trajectory (which largely incorporated this status quo) is any indication, it is likely that the S&P 500 will close the year at the 4,800-4,830 range, i.e., 25-26% higher than EOY 2022.
The high growth seen in this year, however, and the increasing lack of breadth in corporate performance is a cause for pause with substantial empirical rationale. Since the GFC, no year like the present has been followed by a similar year of high performance.
Source: Created by Sandeep G. Rao using data from Yahoo! Finance
This assertion, of course, discounts pandemic-era trajectory patterns and the massive injection of U.S. dollars into the system. Upon considering other years, however, it can be expected that 2024 will have the index experiencing a single-digit percentage growth.
A growth rate of 6.5-7% is entirely feasible for the calendar year ahead. Combining this growth range with the estimate derived for the current year, the S&P 500 can be estimated to be entering the 5,110-5,170 range by the end of 2024.
Key factors behind the reasoning are:
- The onset of growth slowdown in the first half (H1) of 2024 due to current rates creating a strong pipeline of demand for the likes of Treasury Bills and high-quality corporate paper over small- and mid-cap companies as well as those in the early-stage growth while also limiting further overvaluation of top-of-the-line companies.
- The second half (H2) will likely witness eased financing for consumers, small- and mid-cap companies in the second half (H2) due to rate cuts, thus creating decent tailwinds for sector rotation away from "tech" and towards "consumer-facing" sectors. This will, of course, deflate top-of-the-line "tech" stock valuations to an extent.
- Artificial Intelligence ((AI)) will continue to be the cornerstone of investor focus in the near- to mid-term and operating cost efficiency in the mid- to long-term. AI will likely begin to affect a variety of low- to mid-level "white collar" job functions across industries quite soon. The inherent cost savings are palpable; the resulting effect on college-educated younger generations (and their consumption patterns) cannot be modelled yet but can be assumed to have consequences over the mid- to long-term horizons.
- Passive investment vehicles tracking broad-market ETFs have been losing flavor in the current year due to widespread inefficiencies (as portrayed) within sectors. For instance, in Europe - where nearly 80% of the ETF market is institutional - actively managed strategies within an ETF wrapper have been gaining steam throughout 2023. The U.S. also has a number of actively managed strategy providers: the likes of "active" ETFs, et al might divert inflows away from broad-market ETFs in 2024, thus providing another damper on overvaluations.
Editor's Note : This article was submitted as part of Seeking Alpha's 2024 Market Prediction competition , which runs through December 20. With cash prizes, this competition -- open to all contributors -- is one you don't want to miss. If you are interested in becoming a contributor and taking part in the competition, click here to find out more and submit your article today!
For further details see:
S&P 500 In 2024: Macros And Market Breadth Hinder 2023 Repeat