ET - SCD: Deep Discount 8.8% Distribution Yield
2023-03-22 21:06:02 ET
Summary
- SCD is a fund I've provided coverage on quite regularly as it's a unique fund.
- The fund carries a portfolio of MLPs and tech as its largest weightings though it is somewhat diversified overall, too, after those weightings.
- The fund's distribution yield of 8.79% is quite attractive, but it will rely on capital gains to fund the payout.
Written by Nick Ackerman, co-produced by Stanford Chemist. This article was originally published to members of the CEF/ETF Income Laboratory on March 21st, 2023.
LMP Capital and Income Fund ( SCD ) is a fairly unique fund with the largest weightings in the fund dedicated to MLPs. Following the MLP weighting is a weighting to tech. Beyond those two weightings are small allocations to most other sectors. So while it can be seen as a fairly diversified fund, for the most part, the largest allocations make it a rather uniquely positioned fund.
The fund continues to trade at a deep discount, below its longer-term average discount. The fund has been hit with the latest market volatility due to the bank failures. The fund was otherwise following along with the market as measured by SPY .
A hit to energy/MLPs and the fund's financial exposure were likely culprits, but the actual total NAV return also didn't drop as much as the fund's total share price. Therefore, the discount has increased slightly in the last week. Here's a look at the fund's performance since our prior update .
YCharts
The fund's distribution yield is quite attractive at around 8.8%, but as an equity fund it will require capital gains to continue funding its payout.
The Basics
- 1-Year Z-score: -1.84
- Discount: 14.71%
- Distribution Yield: 8.79%
- Expense Ratio: 1.19%
- Leverage: 19.78%
- Managed Assets: $308.36 million
- Structure: Perpetual
SCD provides "a broad-based portfolio that can invest in a range of equity, and fixed-income securities of both U.S. and foreign issuers, including MLPs, stocks, REITs and fixed income." The fund will seek "total return, emphasizing income."
With this flexible approach, that is how we end up with a unique portfolio spread across various asset classes, which is precisely what we have got with this fund. They also mention that it "invests using a rigorous, research process to identify companies with strong fundamentals, skilled and committed management teams and a clear market advantage."
The fund's leverage is fairly mild compared to other closed-end funds. That being said, any leverage increases volatility and the risks of investing. Moves in the underlying portfolio are going to be made sharper in either direction, up or down.
Additionally, with increasing interest rates, the fund's borrowings would continue to rise as they pay at SOFR plus a spread. At the end of their last fiscal year , they had $61 million outstanding at an average interest rate of 2.87%. That was up from the 1.49% the fund was paying for its borrowings at the end of May 31st, 2022 .
Performance - Attractive, Deep Discount
We touched on the performance above and that the fund's energy exposure and financial exposure were likely the cause for the latest weaker results. Historically, energy was a big loser through basically all of 2015 and 2020, where the big finale was. The big finale was COVID that caused prices of oil to go negative.
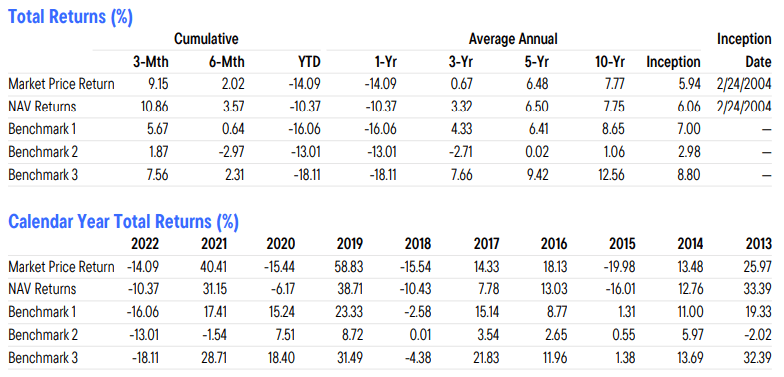
With that, they present performances against three different benchmarks . One is the S&P 500 Index (benchmark 3) which basically smoked the results over the long term that SCD has been able to produce. Again, heavy energy exposure meant much weaker results through most of the last decade. However, more recent results had SCD outperforming as energy was the big beneficiary from rebounding from those sharp losses in 2020.
The other benchmarks here are benchmark 1 being 65% S&P 500, 35% Bloomberg US Aggregate and benchmark 2 being Bloomberg U.S. Aggregate Index. For the most part, SCD is labeled as a multi-asset fund, but it is heavily invested in equities regularly, making these 'benchmarks' rather...interesting.
I think the bigger takeaway is how one feels about MLPs going forward, as they're the largest exposure. We know energy is volatile, which can make SCD much more volatile, along with the added volatility of its leverage. Should one anticipate that energy can rise again despite being weaker once again this year, possibly heading into a recession, then SCD could be a more diversified approach but still get energy exposure. If your energy outlook isn't as favorable and you believe that we go much lower, then SCD would be a fund to avoid.
The energy bulls or SCD bulls may get a boost in results because the fund's discount is quite deep and attractive. The fund is trading at a wider discount than in the last decade.
YCharts
A fund can always go to a wider discount, but we are close to the bottom of the historical range. The only time it dropped significantly lower was in 2016 and 2020. In 2020, it was a short-lived spike, but 2016 hung around for a bit longer.
Distribution - Attractive And Reasonable, But Not Outlook Matters
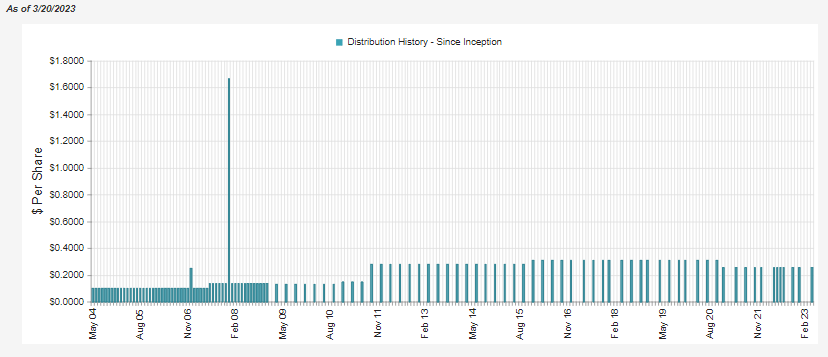
No distributions or dividends are guaranteed, but the future might be a bit more uncertain for SCD. They carry an attractive distribution rate of 8.79% and a quite reasonable NAV rate of 7.50%. The fund has paid a fairly steady distribution, cutting in the GFC as it went from a monthly distribution to a quarterly one. They also trimmed in 2020. These are periods when one would expect cuts to occur for an equity fund. Suffice it to say that another recession causing an energy crash or market drop could lower SCD's distribution.
Going back again to the volatile performance of energy/MLPs brings in more uncertainty for SCD's distribution going forward. While we are at a reasonable level now, and I wouldn't anticipate a cut, it's all quite reliant on capital gains going forward.
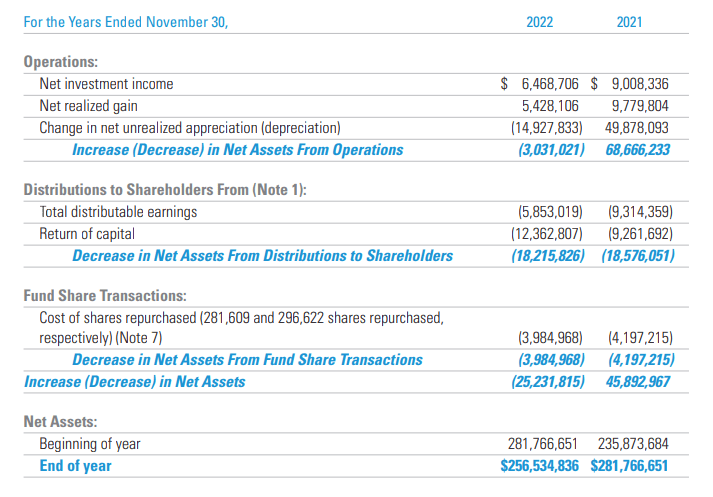
Net investment income coverage for the last year came to only 35.51%. That was above the 27% they showed in their last semi-annual report but still falling quite sharply from last year's coverage level.
Total investment income was $10.873 million for fiscal 2022, with an interest expense of $1.254 million. Last year TII was $12.341 million, and interest expenses were $463k. With both the TII decrease and expenses increasing, the NII was squeezed on both sides of the equation.
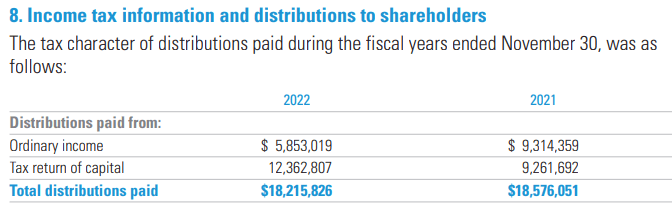
For tax purposes, the fund has paid out primarily ordinary income and return of capital.
ROC isn't overly unexpected in this fund since it holds MLPs. MLPs generally pay the majority of their distributions that are also classified as ROC. Therefore, this designation can get passed on to the shareholders of SCD. Of course, losses or a lack of capital gains in the underlying portfolio can also drive this.
A portion of the distributions identified as ordinary dividends has been qualified dividends when looking at a further breakdown of the distribution in 2022.
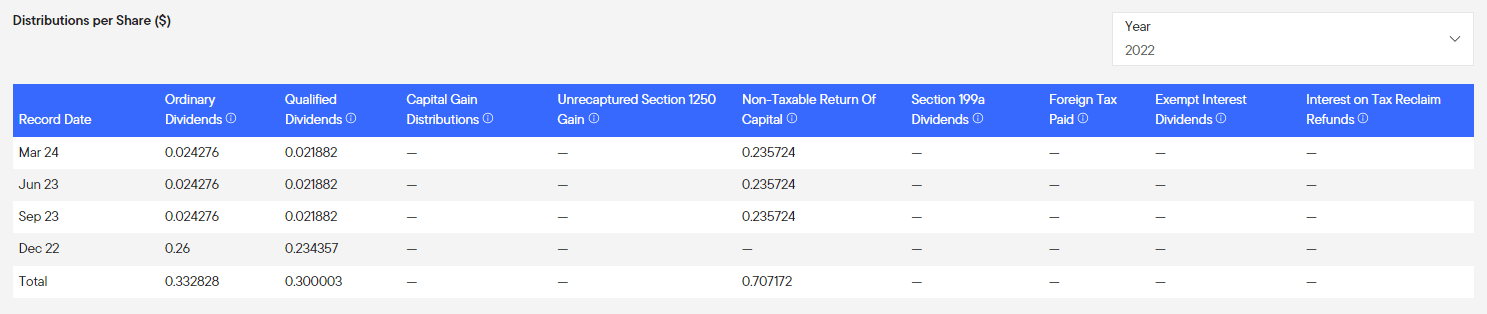
SCD's Portfolio
The managers in the last year were less busy, relatively speaking. The turnover for 2022 came in at 16%, down from the 33% of turnover the fund experienced in 2021. It was also well below the 2020 portfolio turnover rate of 52%. So they were seemingly more content to continue holding onto the positions they had already. With total NAV returns of around -10.3% in 2022, sitting tight was a fairly strong strategy as most of the other equity indexes were down materially further.
They list themselves as an "income & preferred stock fund" under the Lipper Classification. Under the Morningstar category, they are an "allocation-70% to 85% equity." In actuality, the fund carries quite a small amount of preferred or bond exposure. The bulk of the fund is allocated to common stocks at around 60%. Then another ~22% to equity MLP positions and nearly 5% in common shares of equity REITs. So the categorization of this fund might not line up as the designations would suggest.
The current weightings are also fairly consistent with what we saw in our prior update. That's consistent with the fund's relatively low turnover rate in the last year.
SCD Asset Exposure (Franklin Templeton)
When looking at the fund further, we see that MLPs represent more than 21% of the fund's sector allocation. That's followed by tech and a fairly meaningful allocation to financials.
SCD Sector Exposure (Franklin Templeton)
Since our last update, MLP and tech exposure has come down a touch. Previously they were 22.50% and 17.08% allocations, respectively. At the same time, financial exposure was 14.7% previously, meaning we've seen a small decline there as well.
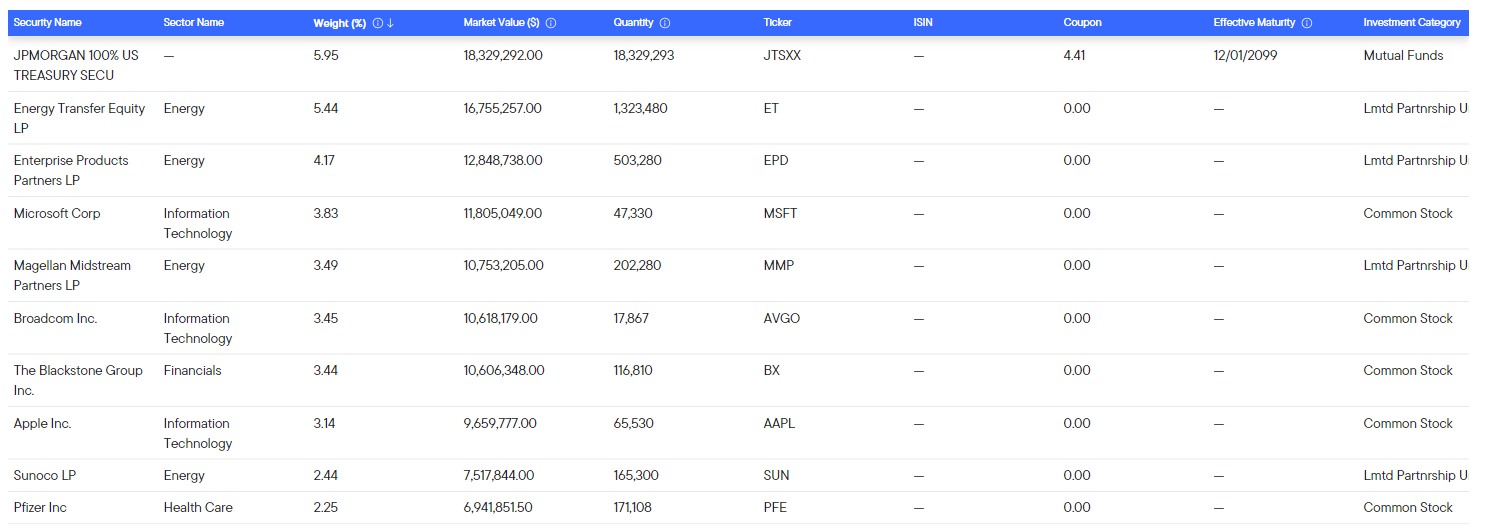
Also consistent with the turnover rate we saw for 2022 was a lack of some material changes in the top allocations of the fund. The above were holdings at the end of February 28th, 2023.
Besides the JPMorgan Money Market Fund ( JTSXX ), Energy Transfer ( ET ) remains the fund's largest position. It's also representative of one of the fund's MLP holdings. With only 81 total positions in the fund, these allocations make up a fairly large amount of the fund. The top ten make up 35.6% of the fund. ET having a 5.44% alone represents a healthy portion of the overall MLP exposure.
Having a narrowly focused portfolio can provide a better chance of outperforming a relative benchmark if you select the right positions. However, the opposite also then becomes true. Being less diversified means having a few positions go against you can have a material impact on the overall performance to the downside.
Conclusion
SCD remains a uniquely positioned fund with MLPs as the largest exposure. Tech also represents a healthy portion of the fund. Those are two sectors that you don't often see side by side within a fund. That being said, after those two largest sector exposures, the fund is fairly diversified with a bit of exposure to most other sectors available. With the largest focus being MLPs, one would have to anticipate that energy can reverse the declines we've seen more recently. To help compensate for these risks, the fund's discount is quite deep now. It is trading near the lowest levels in the last decade. That makes it fairly attractive if you believe energy can perform well.
Overall, the portfolio is relatively narrowly focused on the number of holdings, too, meaning they'll have to be pretty successful in choosing their positions. The top ten represent around a third of the overall investments for the fund.
For further details see:
SCD: Deep Discount, 8.8% Distribution Yield