BKR - Schlumberger: A Good Company In An Uninspiring Business
2023-05-29 07:48:15 ET
Summary
- Schlumberger announced revenue of $7.736 billion in Q1'23, or a 29.8% increase YoY, down 1.8% over 4Q22.
- Schlumberger's board of directors approved a quarterly cash dividend of $0.25 per share or a dividend yield of 2.25%, which I consider too low.
- I recommend buying SLB between $44 and $43.5, with lower support possible at $40.
Introduction
Houston-based Schlumberger Limited ( SLB ) released its first-quarter 2023 results on April 21, 2023.
Note: I have followed SLB quarterly since December 2018. This article updates my article published on October 25, 2022.
1 - 1Q23 Results Snapshot
SLB reported first-quarter 2023 adjusted earnings of $0.63 per share, beating once again analysts' expectations. It significantly increased from the $0.41 per share a year ago.
Also, Schlumberger posted total quarterly revenues of $7,879 million, up from the year-ago quarter's $6,225 million.
It was a solid quarterly result, reflecting vigorous business activities in land and offshore resources in North America and Latin America.
Schlumberger's board of directors approved a quarterly cash dividend of $0.25 per share, up from $0.175 the previous quarter.
CEO Olivier Le Peuch said in the conference call :
As the cycle unfolds, the characteristics I have described continue to align with major strengths in our Core. This will support additional activity intensity for Well Construction; accelerated growth opportunities in Reservoir Performance through the return of Exploration & Appraisal activity; and further long-term growth potential for Production Systems.
2 - Investment Thesis
SLB is my preferred company in the oilfield services segment due to its solid reputation and Worldwide expertise.
The stock looks attractive as a long-term investment but presents a few weaknesses that make it a second choice in the oil industry.
The oilfield-services sector is less rewarding than the E&P industry. It offers an unattractive dividend compared to the risk attached to the industry, even if CEO Olivier Le Peuch seems bullish for the remainder of 2023.
Looking at the macro, we maintain our very constructive multiyear outlook as the upcycle attributes and key activity drivers continue to evolve very positively. The international and offshore markets continue to experience a strong resurgence of activity driven by resilient long-cycle development and capacity expansion projects. In contrast, the North American land market, which has led this upcycle in the early innings, could potentially result in an activity plateau in 2023 due to lower gas prices and capital restraint by private E&P operators. (press release)
This highly volatile segment can quickly shift from a successful investment to a more non-inspiring one without sufficient time to adapt to the new paradigm.
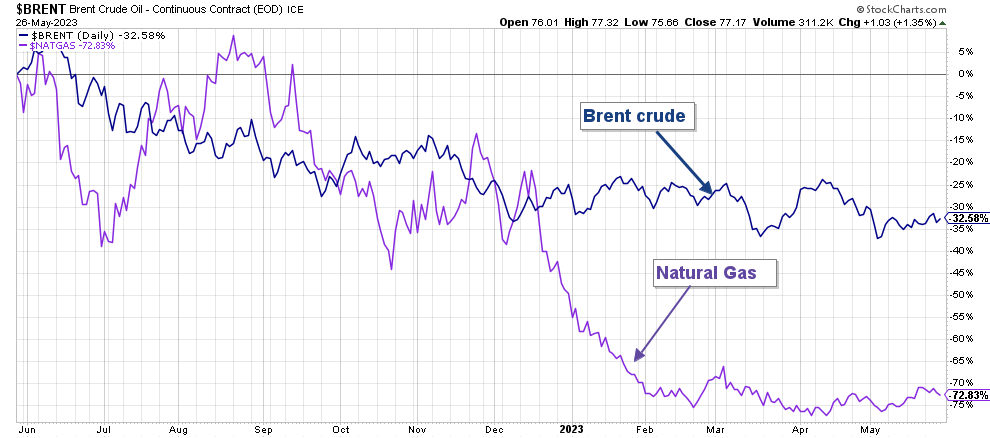
The chart below shows that oil and gas prices dropped significantly YoY.
SLB 1-Year Chart Brent and NG (Fun Trading StockCharts)
Thus, the strategy for such a volatile environment is trading LIFO around a long-term position. I think trading 60% entire position is the most adapted strategy with cyclical stocks. It protects you from excessive ups and sector and provides an extra-gain non-negligible while waiting for a new rebound.
3 - Stock Performance
As shown below, Schlumberger has outperformed the VanEck Vectors Oil Services ETF ( OIH ), Baker Hughes ( BKR ), and Halliburton ( HAL ) quite significantly. However, SLB is down 8% on a one-year basis.
Schlumberger Financials History Ending 4Q22 Trend And Raw Numbers
| Schlumberger |
| 1Q22 |
| 2Q22 |
| 3Q22 |
| 4Q22 |
| 1Q23 |
| Total Revenues in $ Billion |
| 5.96 |
| 6.77 |
| 7.48 |
| 7.88 |
| 7.74 |
| Net income in $ Million |
| 510 |
| 959 |
| 907 |
| 1,064 |
| 934 |
| EBITDA $ Million |
| 1,294 |
| 1,808 |
| 1,256 |
| 1,539 |
| 1,841 |
| EPS diluted in $/share |
| 0.34 |
| 0.67 |
| 0.63 |
| 0.74 |
| 0.65 |
| Cash flow from operating activities in $ Million |
| 131 |
| 408 |
| 1,567 |
| 1,614 |
| 330 |
| CapEx in $ Million |
| 344 |
| 320 |
| 382 |
| 669 |
| 410 |
| Free cash flow in $ Million |
| -213 |
| 88 |
| 1,185 |
| 945 |
| -80 |
| Total cash $ Billion |
| 2.65 |
| 2.82 |
| 3.61 |
| 2.89 |
| 2.50 |
| Total LT Debt in $ Billion |
| 14.09 |
| 13.85 |
| 13.35 |
| 13.23 |
| 12.84 |
| Dividend per share in $ |
| 0.175 |
| 0.175 |
| 0.175 |
| 0.25 |
| 0.25 |
| Shares Outstanding (Diluted) in Million |
| 1,434 |
| 1,436 |
| 1,414 |
| 1,440 |
| 1,446 |
Source: Company release.
Revenues, Free Cash Flow, And Debt Analysis
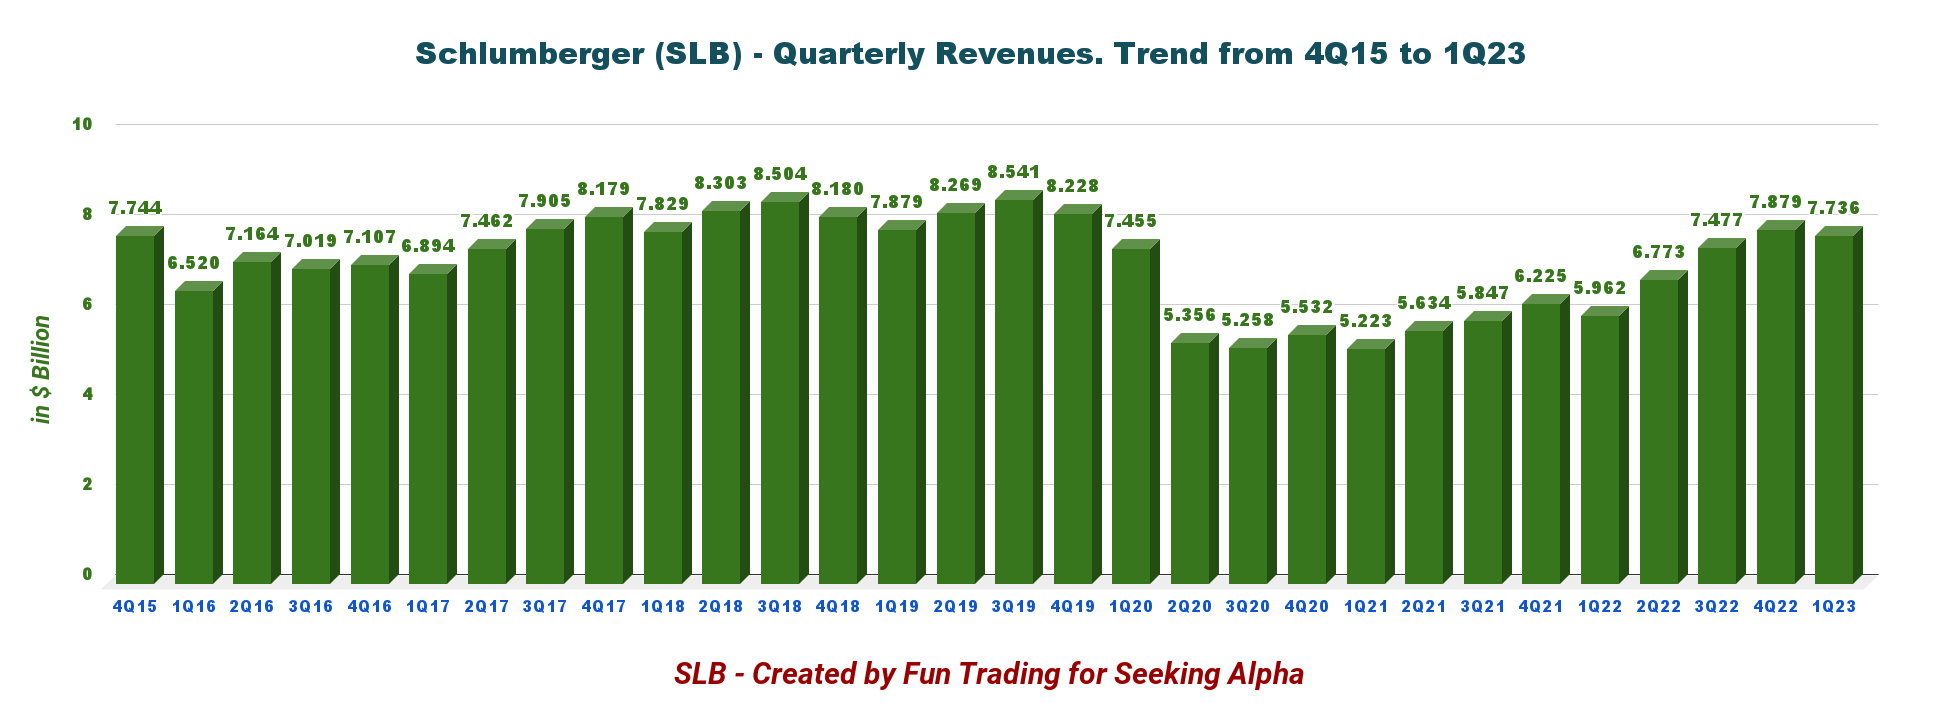
1 - Quarterly Revenues were $7.736 billion at the end of March 2023
SLB Quarterly Revenue History (Fun Trading)
Schlumberger announced revenue of $7.736 billion in 1Q23, or a 29.8% increase YoY, down 1.8% over 4Q22. Net income was $934 million or $0.65 per diluted share, compared with $510 million or $0.36 in 1Q22.
Adjusted earnings were $0.63 per share, which beat analysts' expectations, and Adjusted EBITDA was $1,788 million.
CFO Stephane Biguet said in the conference call:
During the quarter, we monetized our remaining investment in Liberty, which resulted in net proceeds of $137 million. We also spent $244 million, net of cash acquired, on acquisitions and investments in other businesses, the majority of which relates to the Gyrodata acquisition.
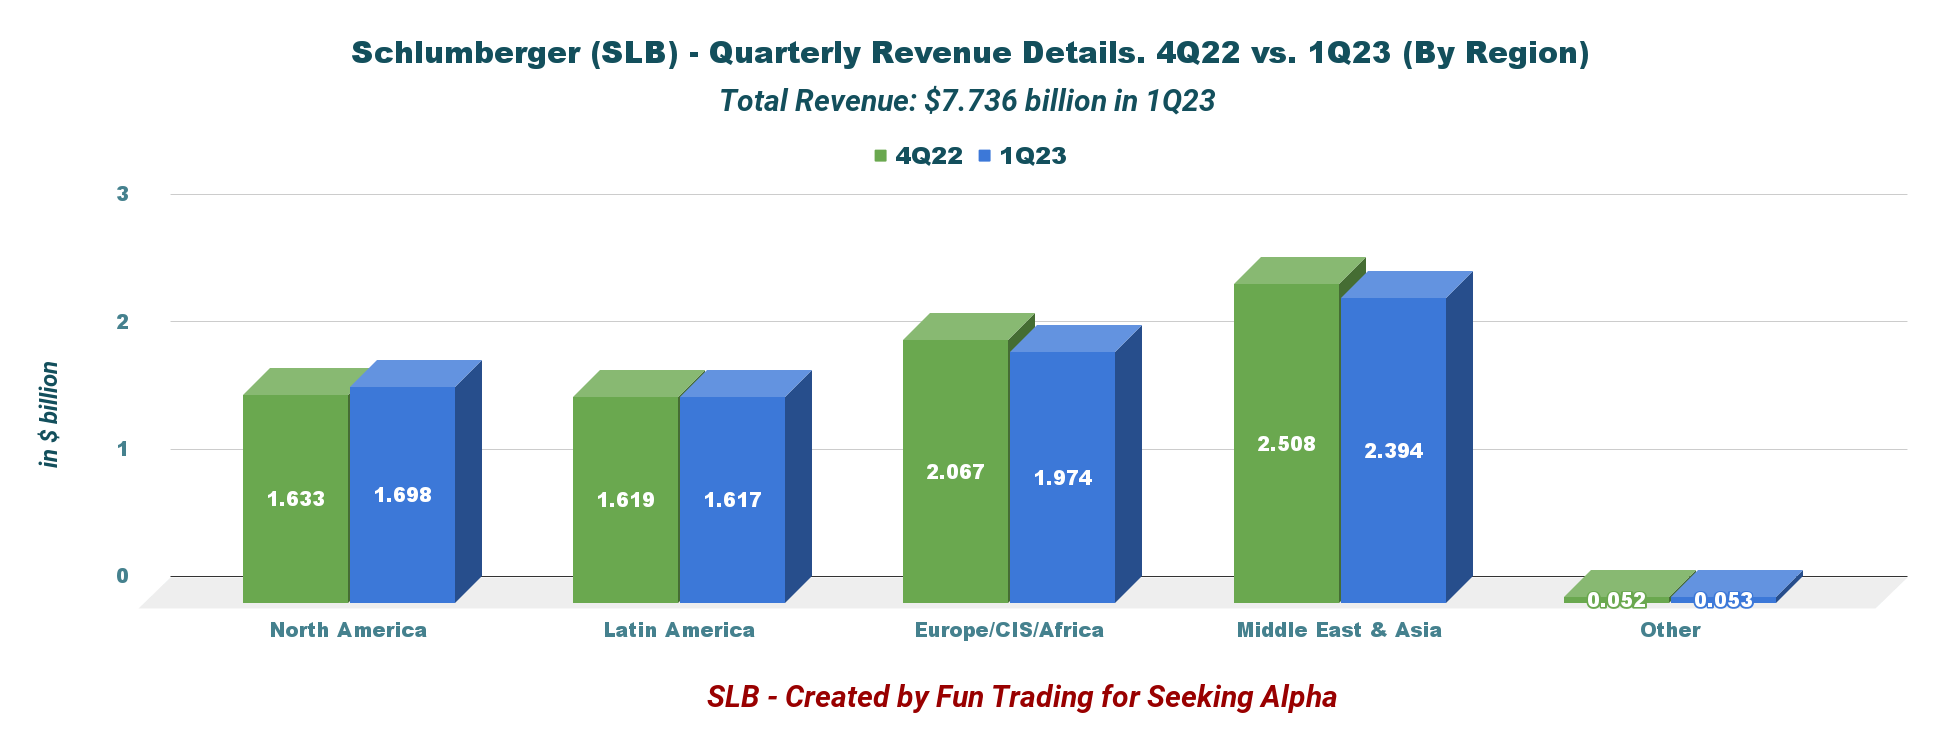
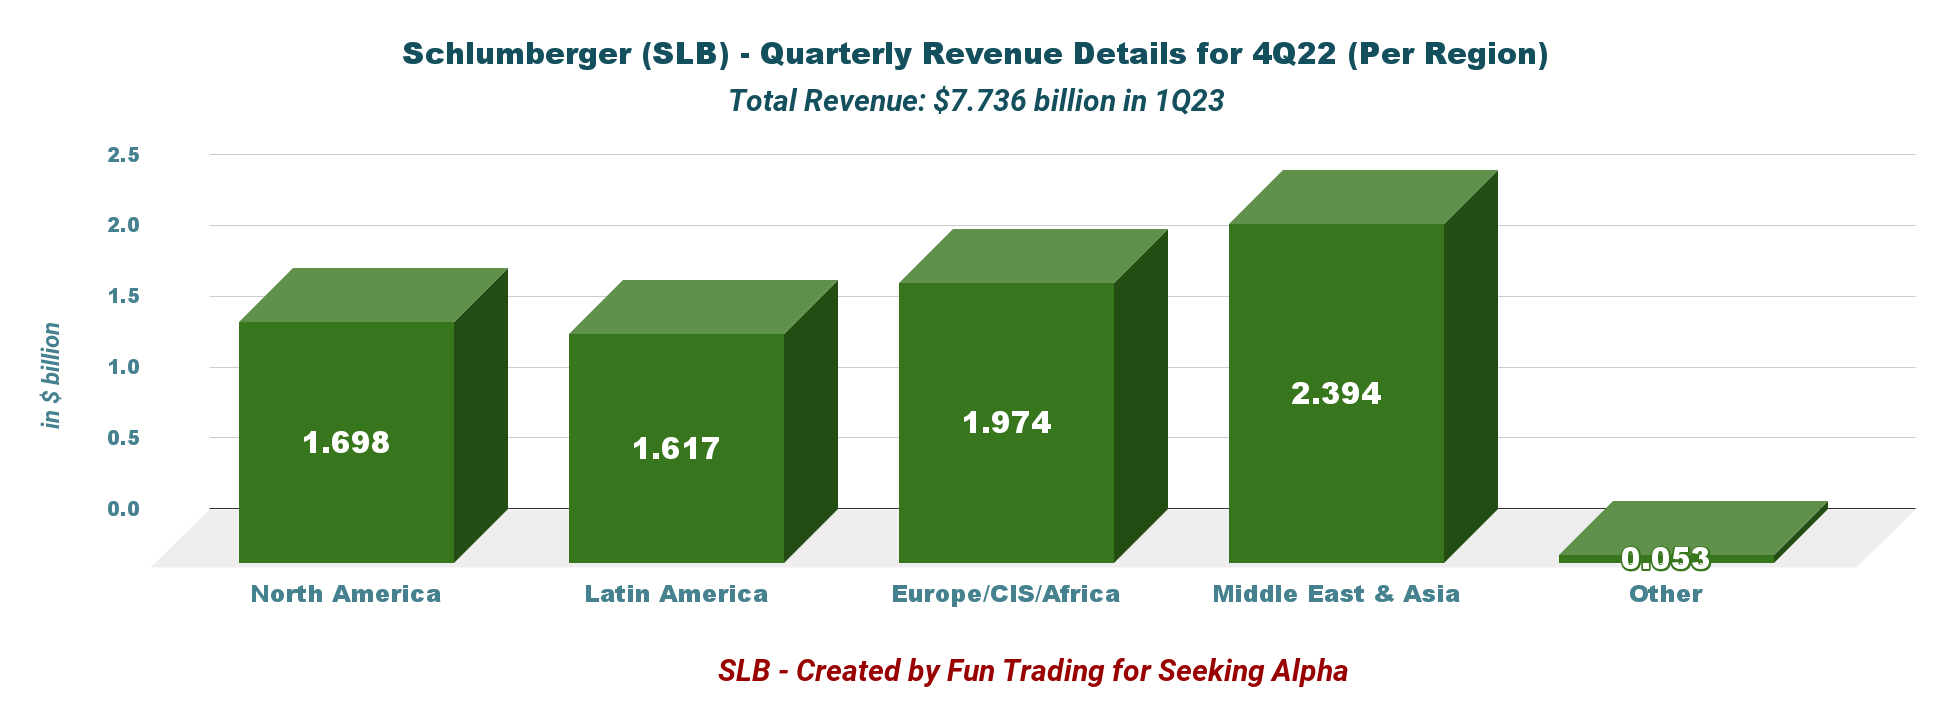
1.1 Revenues per Region
Revenues were significantly higher sequentially, especially for the International business. However, all regions delivered a lower revenue QoQ excluding North America, as shown below:
SLB Revenue detail 4Q22 versus 1Q23 (Fun Trading) SLB Revenue per Region in 1Q23 (Fun Trading)
1.2 - Revenue per segment
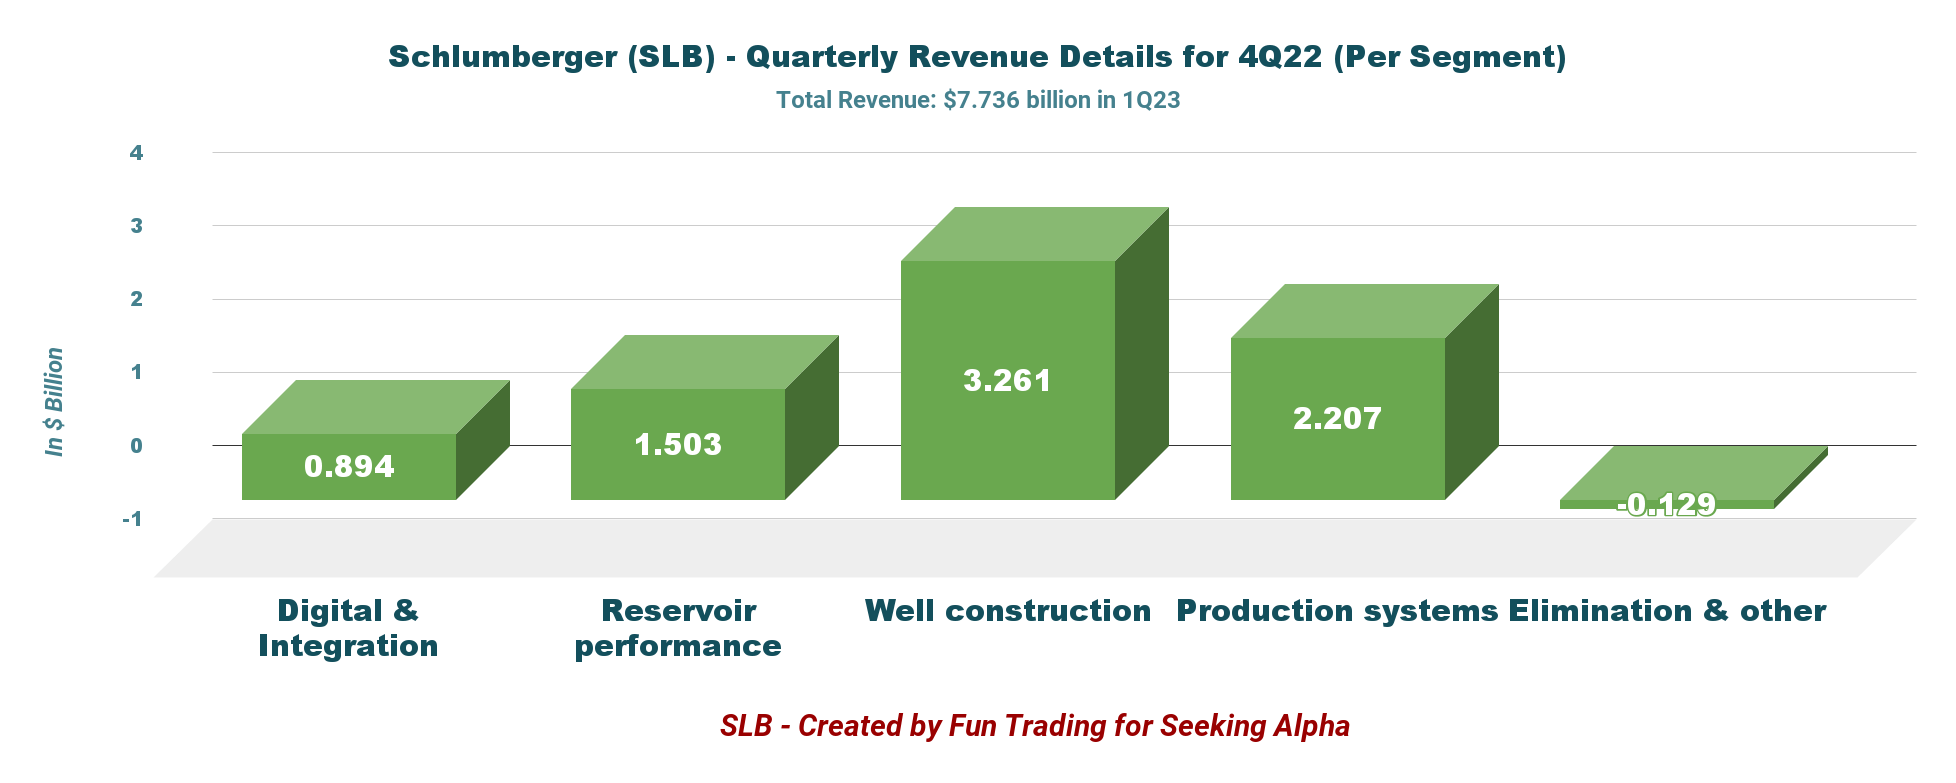
SLB 1Q23 Revenue per Segment (Fun Trading) As we can see, the Well construction segment is the most influential for the company and represents 42.2% of the company's revenue.
1.2.1 - Digital & Integration
Revenues totaled $894 million, up 43% from last year. The increase is due to continued growth in digital sales and increased exploration data license sales in the US Gulf of Mexico, partially offset by lower revenue from APS projects.
1.2.2 - Reservoir Performance
Revenues rose 24.2% year over year to $1,503 million. The increase was due to increased intervention, evaluation, and stimulation services across all areas on land and offshore and from both exploration and production activity. More than 30% revenue growth was recorded in Latin America, Europe & Africa, mainly from new evaluation and stimulation project construction.
1.2.3 - Well Construction
Revenues increased 36% from last year's quarter to $3,261 million, up from 2,398 million last year. The increase was due to strong activity and solid pricing improvements, led by North America and Latin America, both of which grew more than 45%. Europe & Africa revenue increased by 38%, and the Middle East & Asia revenue grew 24% YoY.
Double-digit revenue growth was realized on land and offshore in fluids, measurements, Construction, well Construction, drilling, and equipment sales.
1.2.4 - Production Systems
Revenues were $2,207 million, up 37.6% from last year. The increase was due to strong activity across all areas, led by Europe & Africa and Latin America, which grew 63% and 50%, respectively.
North American revenue increased 32%, while the Middle East & Asia revenue grew 11% YoY. Midstream, subsea, artificial lift sales, and completions recorded double-digit growth across North America and internationally.
1.2.5 - 2023 Outlook
In 2023, Schlumberger expects a $2.5-$2.6 billion for the full-year CapEx, up from the $2.3 billion indicated in 2022. CEO Olivier Le Peuch was bullish for 2023 and said in the press release:
We continue to see positive pricing as our performance differentiates, technology adoption increases, contract terms are adjusted to offset inflation, and service capacity continues to tighten in key international markets. In this environment, our customers are more actively collaborating with us to improve their operational performance, attain decarbonization objectives, and lower overall costs through the increased use of our differentiated technologies.
2 - The Free Cash Flow was a loss of $80 million in 1Q23
SLB Quarterly Free Cash Flow History (Fun Trading)
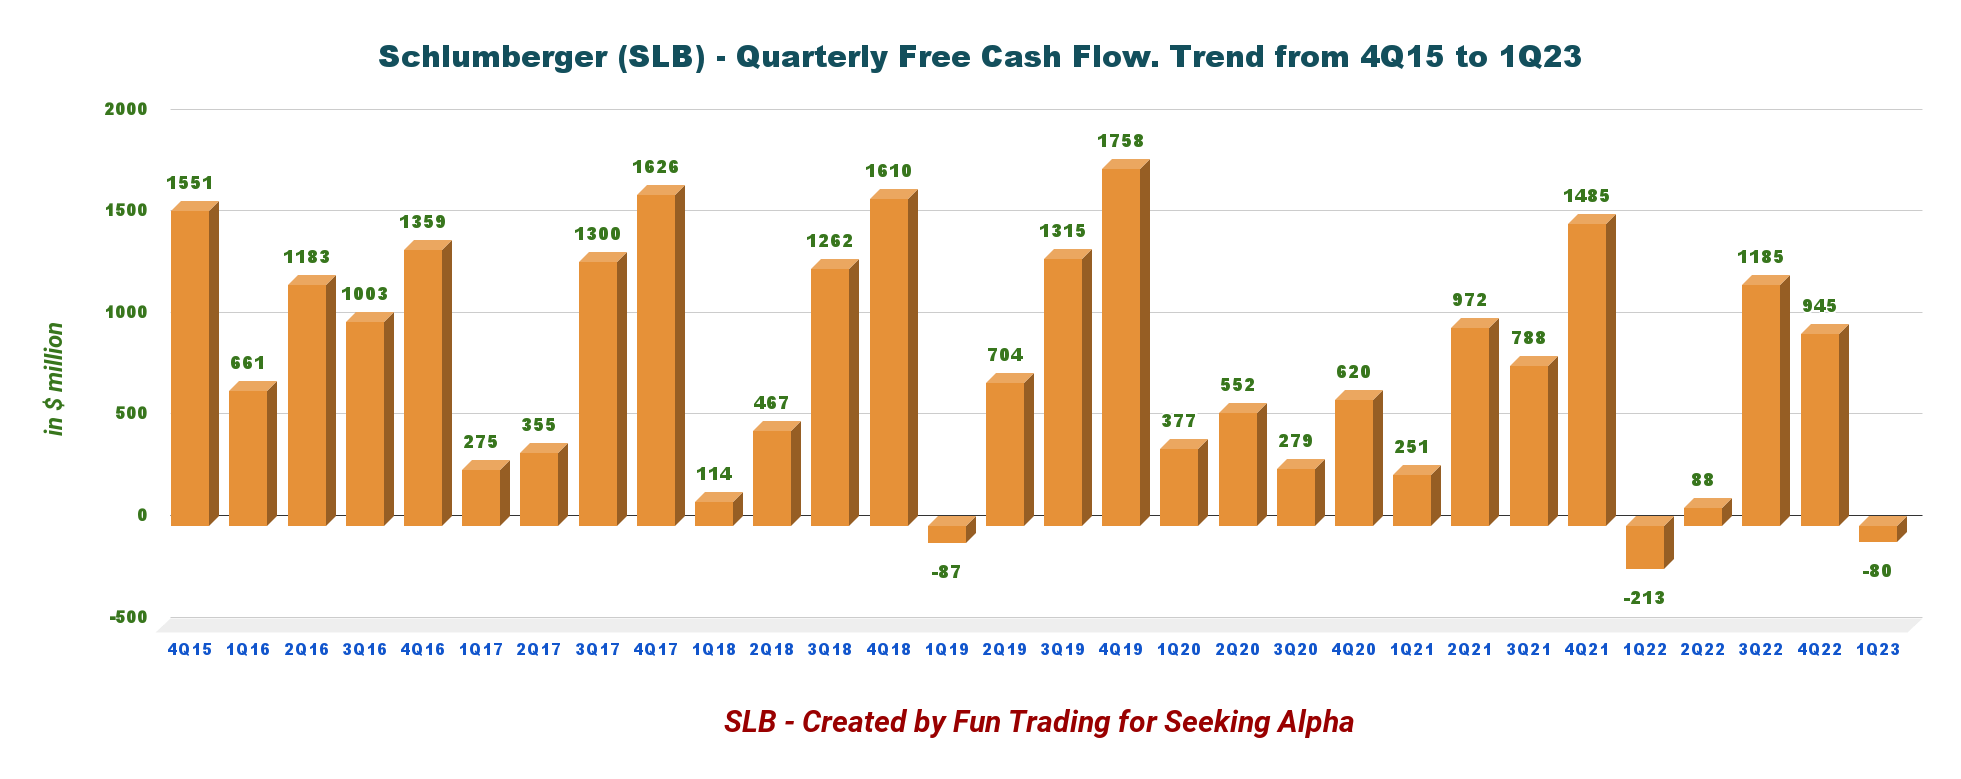
Note: The generic free cash flow is the cash from operating activities minus CapEx. Schlumberger calculated the FCF differently and indicated a loss of $260 million. Schlumberger used a CapEx, including investments in APS projects and multi-client. I used a CapEx of $410 million.
Trailing 12-month free cash flow was $2,098 million, and 1Q23 free cash flow was a loss of $80 million from a loss of $173 million in 1Q22. In general, 1Q FCF is relatively quite weak.
Schlumberger's board of directors approved a quarterly cash dividend of $0.25 per share or a dividend yield of 2.25%, which I consider too low. It hardly justifies a long-term investment without some trading.
Also, during the quarter, SLB repurchased approximately 4.4 million shares of its common stock at an average price of $52.65 per share for a total purchase price of $230 million. Looking at the stock price now, we can see that a share buyback program is not working, and the company should increase the dividend instead.
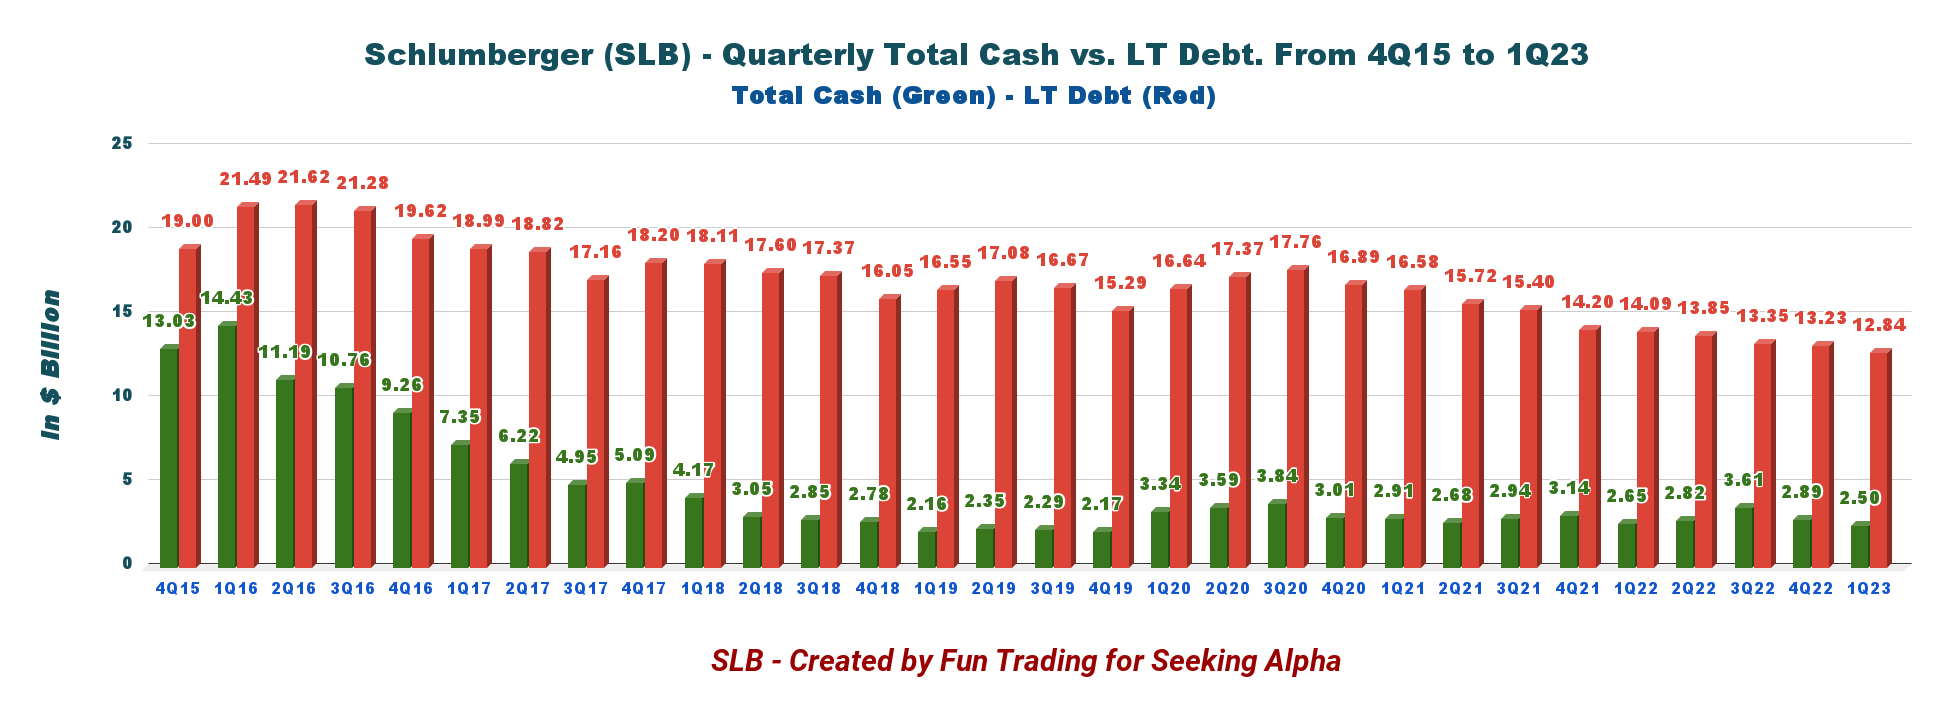
3 - Net Debt increased sequentially to $10.33 billion at the end of March 2023
SLB Quarterly Cash versus Debt History (Fun Trading)
CFO Stephane Biguet said in the conference call:
Our net debt increased approximately $1 billion sequentially to $10.3 billion. During the quarter, we generated $330 million of cash flow from operations and negative free cash flow of $265 million reflecting the seasonal increase in working capital we typically experience in the first quarter. This largely reflects the payout of our annual employee incentives and the buildup of working capital that will support our anticipated growth throughout the year.
Technical Analysis and Commentary
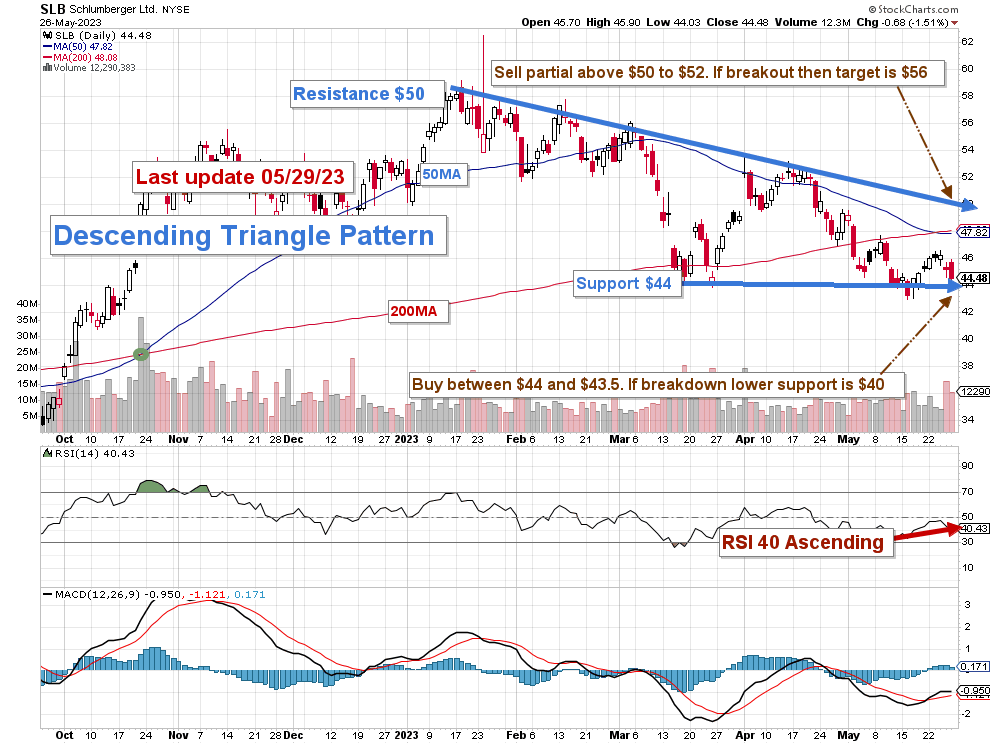
SLB TA Chart Short-Term (Fun Trading StockCharts) Note: the chart has been adjusted for dividends.
SLB forms a descending triangle pattern, with resistance at $50 and support at $44. RSI is 40 and suggests more downside.
The descending triangle is a bearish formation that usually forms during a downtrend as a continuation pattern. There are instances when descending triangles form as reversal patterns at the end of an uptrend, but they are typically continuation patterns. Regardless of where they form, descending triangles are bearish patterns that indicate distribution.
As I said in my investment thesis, I suggest trading short-term LIFO for about 50% of your position. I recommend selling partially between $50 and $52 with possible higher resistance at $56 in case of solid momentum to sell another portion.
Conversely, it is reasonable to accumulate when the stock experiences weakness between $44 and $43.5, with lower support possible at $40.
Trading LIFO is an excellent way of trading your long core position. It means that you are selling first your recent purchases and keeping your older position for a higher level. It will reward you with a much higher profit while reducing risk significantly.
Warning: The TA chart must be updated frequently to be relevant. It is what I am doing in my stock tracker. The chart above has a possible validity of about a week. Remember, the TA chart is a tool only to help you adopt the right strategy. It is not a way to foresee the future. No one and nothing can.
For further details see:
Schlumberger: A Good Company In An Uninspiring Business