BKR - Schlumberger: A Positive Quarter
- Schlumberger recorded a 13.6% increase in revenue sequentially, the most significant growth in over a decade.
- On June 3, 2022, the company had approximately $2,816 million in cash and short-term investments, up from $2,682 million in 2Q21.
- I recommend buying SLB between $30 and $31 with potential lower support at $28.
Introduction
Houston-based Schlumberger Limited ( SLB ) released its Second-Quarter 2022 Results on July 22, 2022.
Note: I have followed SLB quarterly since December 2018 with 15 articles and counting. This new article is a quarterly update of my article published on April 26, 2022.
1 - 2Q22 results Snapshot
The world's top oilfield services provider came out with second-quarter 2022 earnings of $959 million or $0.67 per share, beating analysts' expectations.
Revenue was up 20.2%, from $5.634 billion last year to $6.773 billion. Cash from operations was $408 million, down significantly from $1.22 billion in 2Q21. The adjusted earnings were $0.50 per share, or an increase of 67% from 2Q21.
The better-than-expected quarterly results were due to higher sales of exploration data licensing and substantial drilling activities onshore and offshore in North America and the international market.
CEO Olivier Le Peuch said in the conference call :
The second quarter was a defining moment in the overall trajectory of the year, with significant growth in revenue, margin expansion and earnings per share. Our execution was solid, and directionally, all trends were positively in our favor. Strong international activity growth and steady drilling momentum in North America, sustained offshore recovery and the broadening impact of improved pricing.
2 - Investment Thesis
Schlumberger is my favorite company in this segment. I consider the stock a great option from a long-term perspective. However, the oilfield service sector is not my first choice in the oil industry, and I find it very volatile and sensitive to any oil price fluctuation.
The basic principle is that the company generates revenues by increasing drilling contracts and services that could be quickly affected by a turnaround.
It is often the case that when oil and gas prices turn bearish, the oilfield service sector drops proportionally more and tends to recover slowly. Thus it is vital to trade LIFO around a long-term position.
However, oil prices are high, and the FED's action has not yet affected oil demand. But, this situation may not last forever, and already a few analysts expect a recession by 4Q22 , which may put pressure on stocks like SLB if demand for oil starts to drop.
I believe trading 50% of your entire position is the most adapted strategy with such cyclical stocks. It shields you against the excessive ups and downs in this sector.
Note: On April 22, 2022, SLB now owns 27% of Liberty Oilfield Services Inc.
3 - Stock Performance
As shown below, Schlumberger and its main rival Halliburton ( HAL ) have outperformed the VanEck Vectors Oil Services ETF ( OIH ). Baker Hughes ( BKR ) went up a bit lower than the two. SLB is up 62% on a one-year basis.
Schlumberger Financials: 2Q22 Trend And Raw numbers
| Schlumberger |
| 2Q21 |
| 3Q21 |
| 4Q21 |
| 1Q22 |
| 2Q22 |
| Total Revenues in $ Billion |
| 5.63 |
| 5.85 |
| 6.23 |
| 5.96 |
| 6.77 |
| Net income in $ Million |
| 431 |
| 550 |
| 601 |
| 510 |
| 959 |
| EBITDA $ Million |
| 678 |
| 1,351 |
| 1,425 |
| 1,294 |
| 1,808 |
| EPS diluted in $/share |
| 0.30 |
| 0.39 |
| 0.42 |
| 0.34 |
| 0.67 |
| Cash flow from operating activities in $ Million |
| 1,220 |
| 1,070 |
| 1,932 |
| 131 |
| 408 |
| CapEx in $ Million |
| 243 |
| 282 |
| 465 |
| 344 |
| 320 |
| Free cash flow in $ Million |
| 977 |
| 788 |
| 1,467 |
| -213 |
| 88 |
| Total cash $ Billion |
| 2.68 |
| 2.94 |
| 3.14 |
| 2.65 |
| 2.82 |
| Total LT Debt in $ Billion |
| 15.72 |
| 15.40 |
| 14.20 |
| 14.09 |
| 13.85 |
| Dividend per share in $ |
| 0.125 |
| 0.125 |
| 0.125 |
| 0.175 |
| 0.175 |
| Shares Outstanding (Diluted) in Million |
| 1,421 |
| 1,424 |
| 1,442 |
| 1,434 |
| 1,436 |
Source: Company release
* Estimated by Fun Trading
Revenues, Free Cash Flow, And Debt Analysis
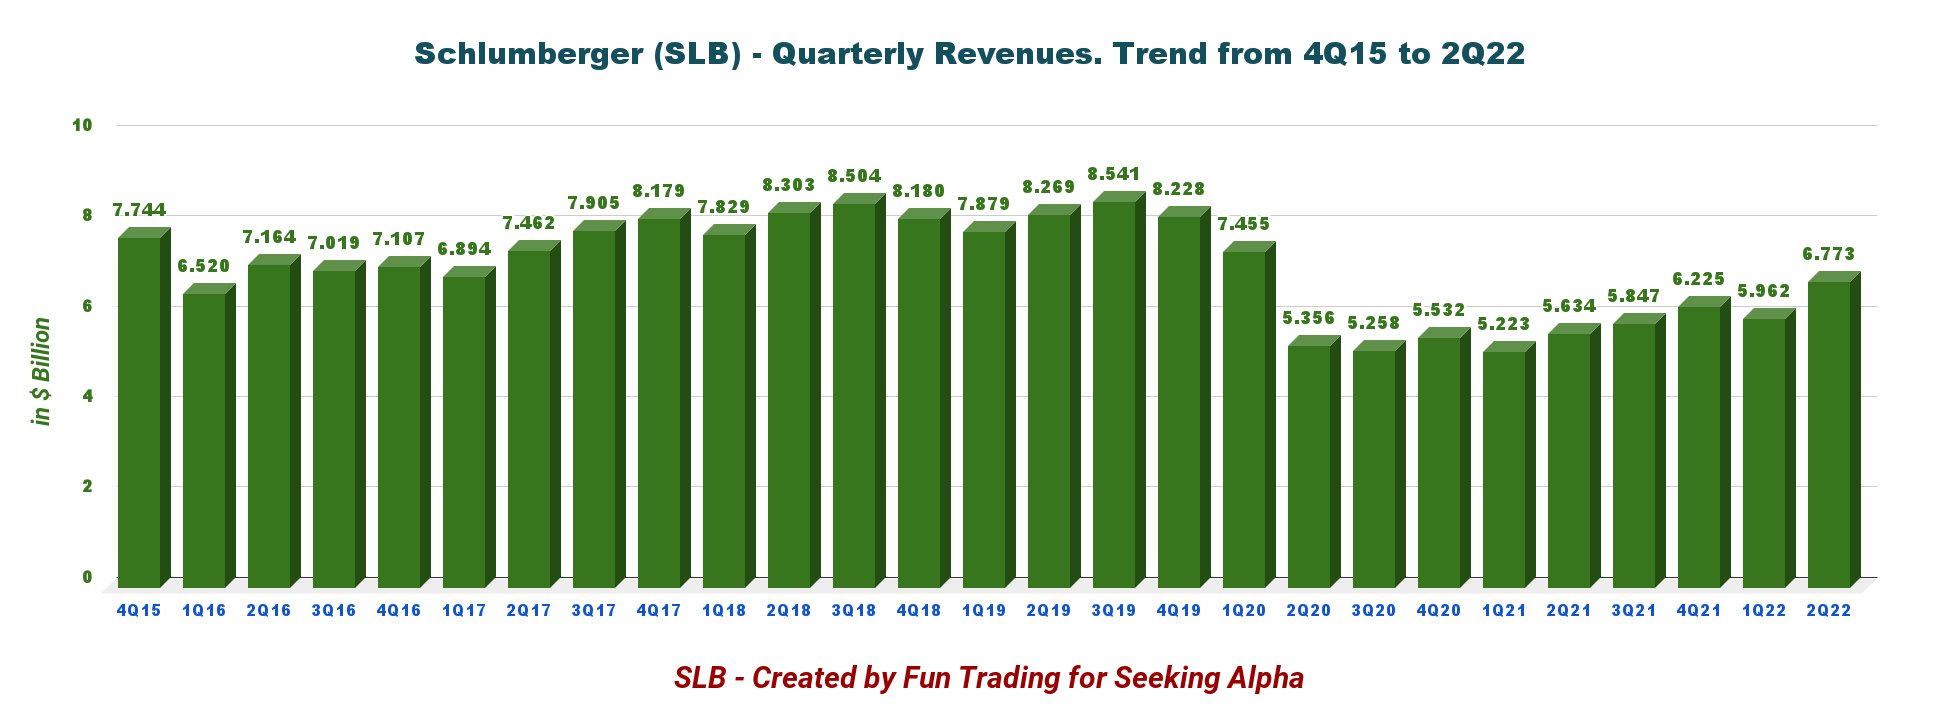
1 - Quarterly Revenues were $6.773 billion at the end of June 2022
1.1 - Quarterly Revenue was $6.773 billion in 2Q22
SLB Quarterly Revenues history (Fun Trading)
Schlumberger recorded a 13.6% increase in revenue sequentially, the most significant growth in over a decade. The increase was felt in the International and North American segments. As we can see in the chart above, revenue was up 20.2% from last year.
The revenue growth was general across all segments, increasing spending across all customer types. ECA growth spread across Europe, Scandinavia, and West Africa. Internationally, sequential growth was registered in the Middle East, Asia, and Latin America.
1.2 - Revenue detail per segment and region
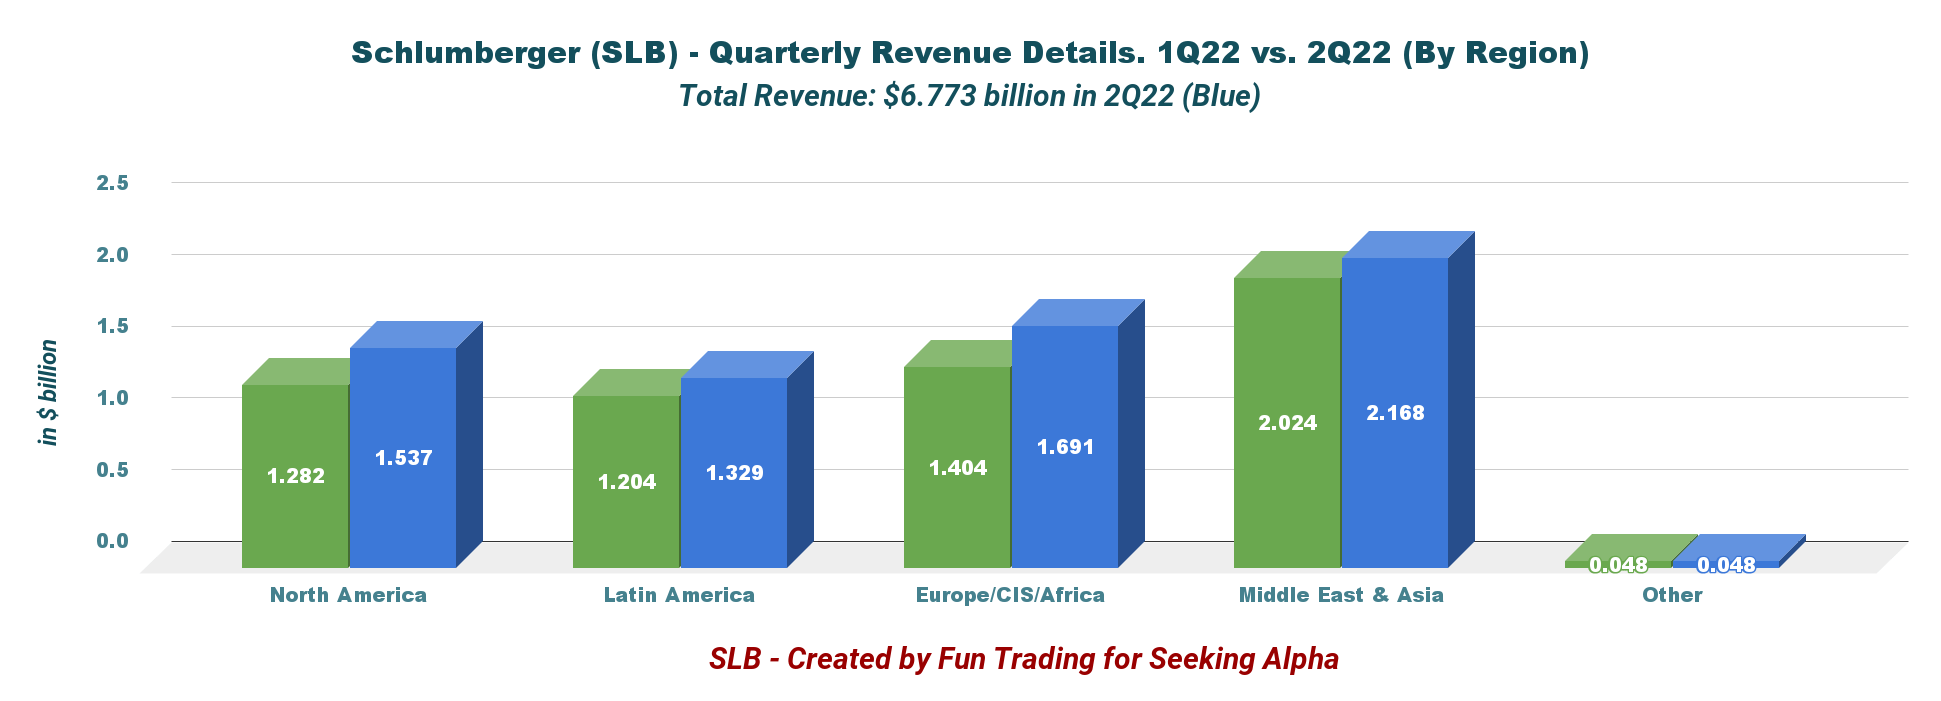
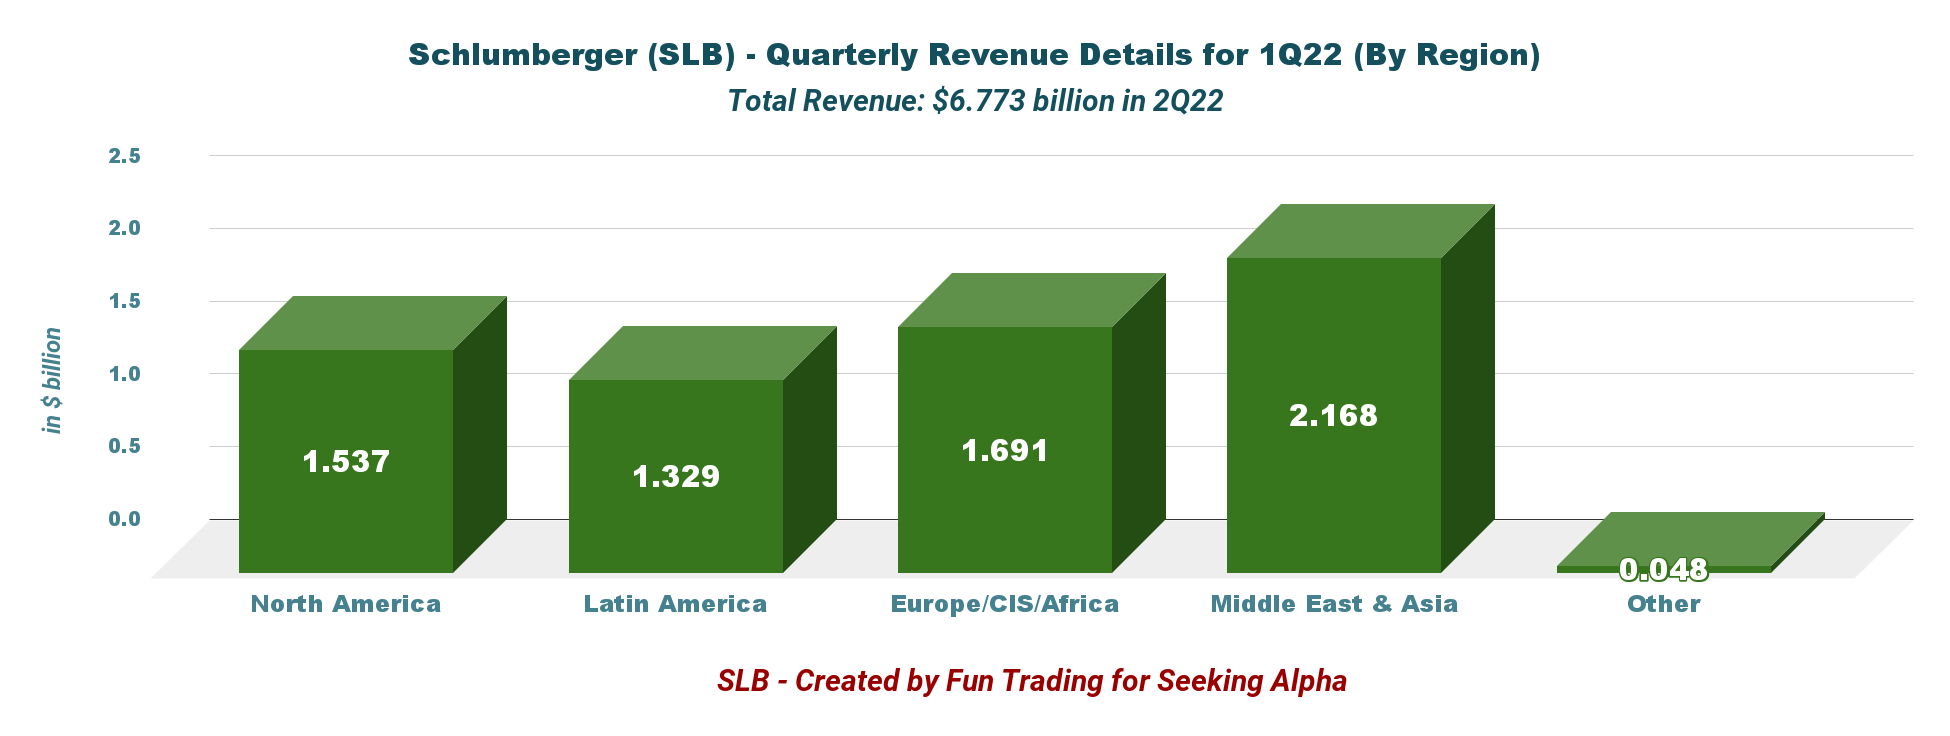
1.2.1 Revenue per Region
Revenues were significantly higher sequentially, especially for the North American segment.
SLB Quarterly revenue per region 1Q22 versus 2Q22 (Fun Trading) SLB Quarterly revenues by region 2Q22 (Fun Trading)
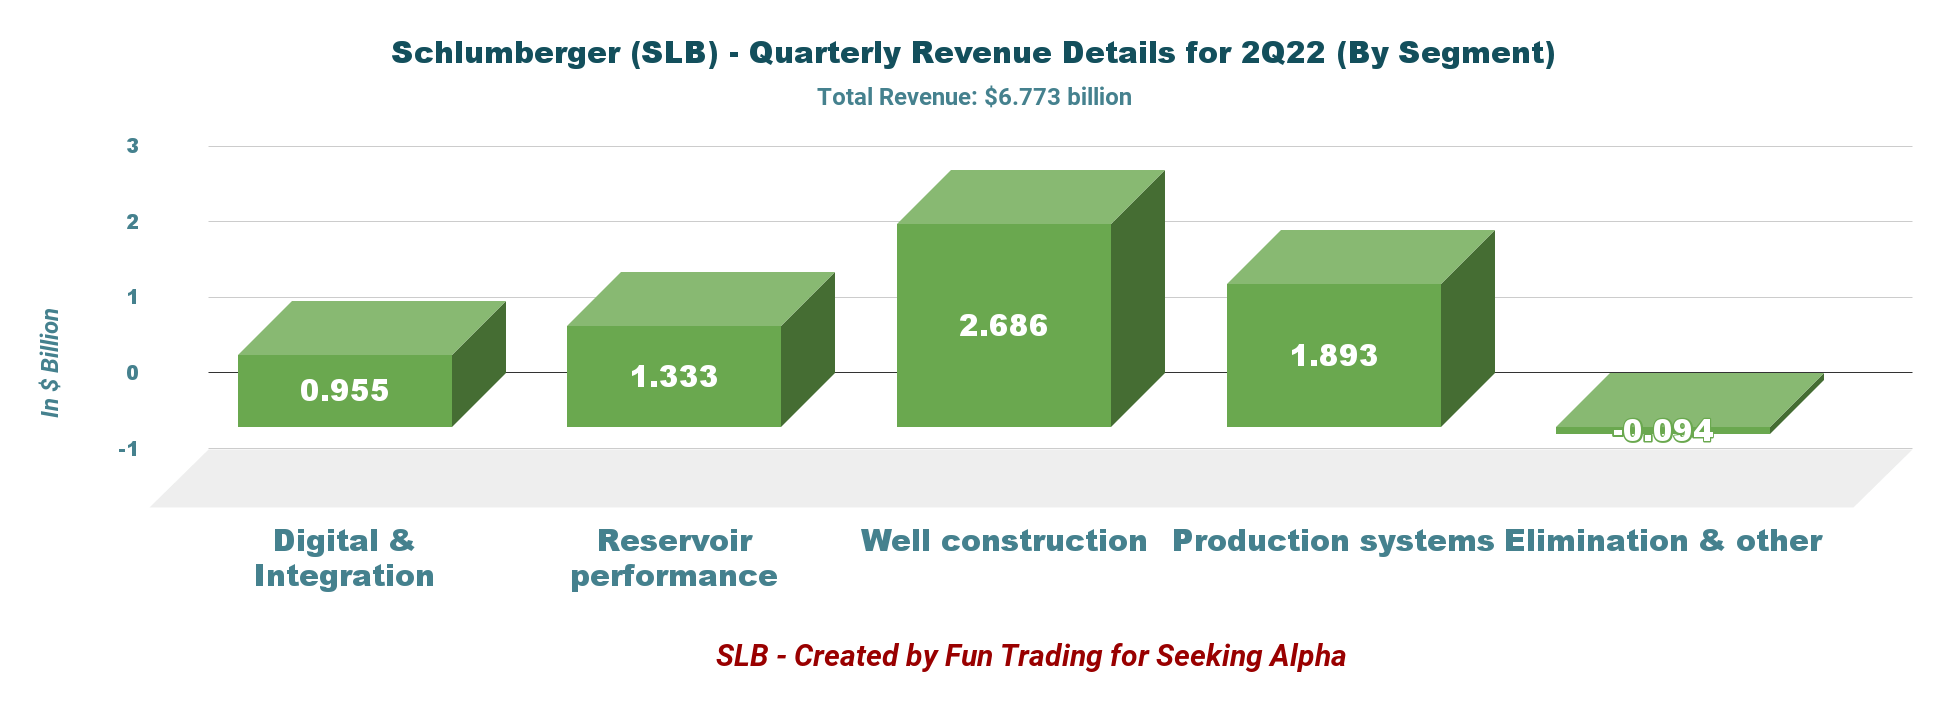
1.2.2 - Revenue per segment
SLB Quarterly revenues by segment 2Q22 (Fun Trading) As we can see, the Well construction segment is the most important for the company.
1.2.2.1 - Digital & Integration
Revenues totaled $955 million, up 17% from last year. The higher contributions came from higher sales of exploration data licensing. Pre-tax operating income was $379 million, up 39% yearly.
1.2.2.2 - Reservoir Performance
Revenues increased 19% year over year to $1,333 million. Pre-tax operating income was $195 million, up 25% yearly. The solid profit was due to higher land and offshore activities.
1.2.2.3 - Well Construction
Revenues increased 27% from last year's quarter's levels to $2,686 million. Pre-tax operating income jumped 73% year over year to $470 million. The increase was due to robust offshore drilling activities in North America and the international market.
1.2.2.4 - Production Systems
Revenues were $1,893 million, up 13% from last year. Pre-tax operating income was flat from the prior-year quarter's levels. Production systems recorded increased sales of well, surface, and subsea production systems.
1.2.3 - 2022 outlook revised upward
2022 revenue outlook has been increased to $27 billion.
The company is increasing revenue growth to the high-teens year-over-year compared with the prior mid-teens projection.
The company sees more robust growth for drilling and completion activities worldwide, which is very encouraging and matches what was said by Halliburton.
In 2022, Schlumberger expects a $1.9-$2 billion CapEx or about 15% up from 2021.
CEO Olivier Le Peuch said in the conference call:
the quarter also marked a number of new contract wins and an increase in backlog for production systems and our re-equipment business, another leading indicator of the strength of activity pipeline ahead of us. Notably, price improvement is also being reflected in production system backlog, which is significant for its later cycle implication for sustained margins expansion on an overall portfolio basis.
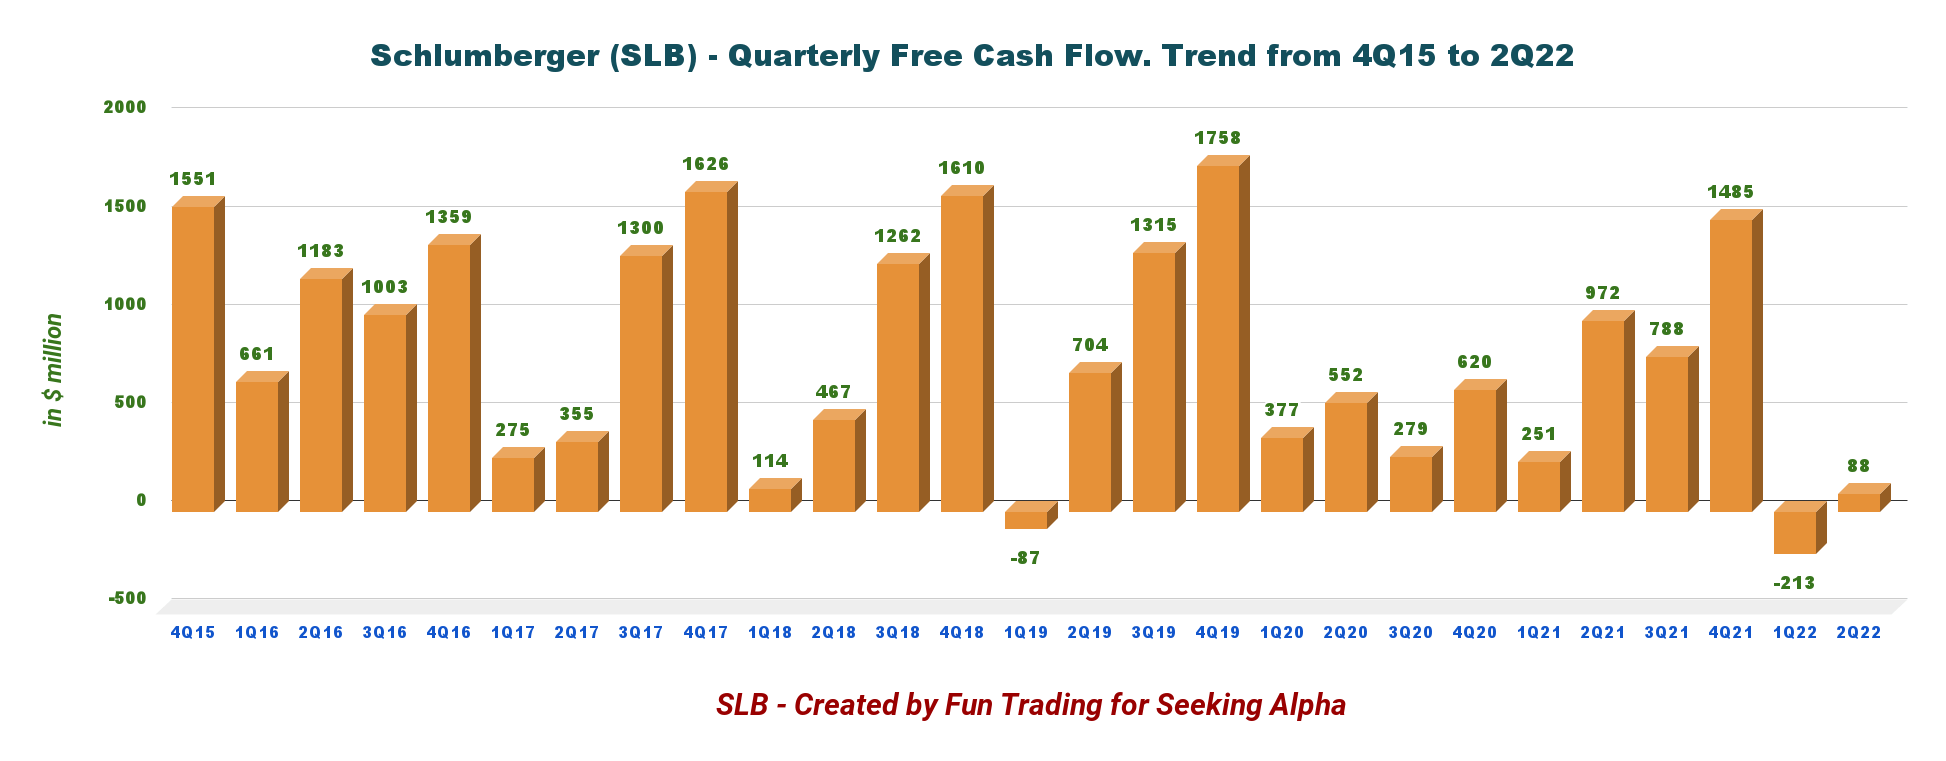
2 - The Free Cash Flow was a loss of $88 million in 2Q22
SLB Quarterly Free cash flow history (Fun Trading)
Note: The generic free cash flow is the cash from operating activities minus CapEx. The difference is how the CapEx is calculated. Schlumberger used a CapEx, including investments in APS projects and multi-client. I used a CapEx of $320 million.
Trailing 12-month free cash flow was $2,118 million ttm, and 2Q22 free cash flow was $88 million.
Schlumberger's board of directors approved a quarterly cash dividend of $0.175 per share.
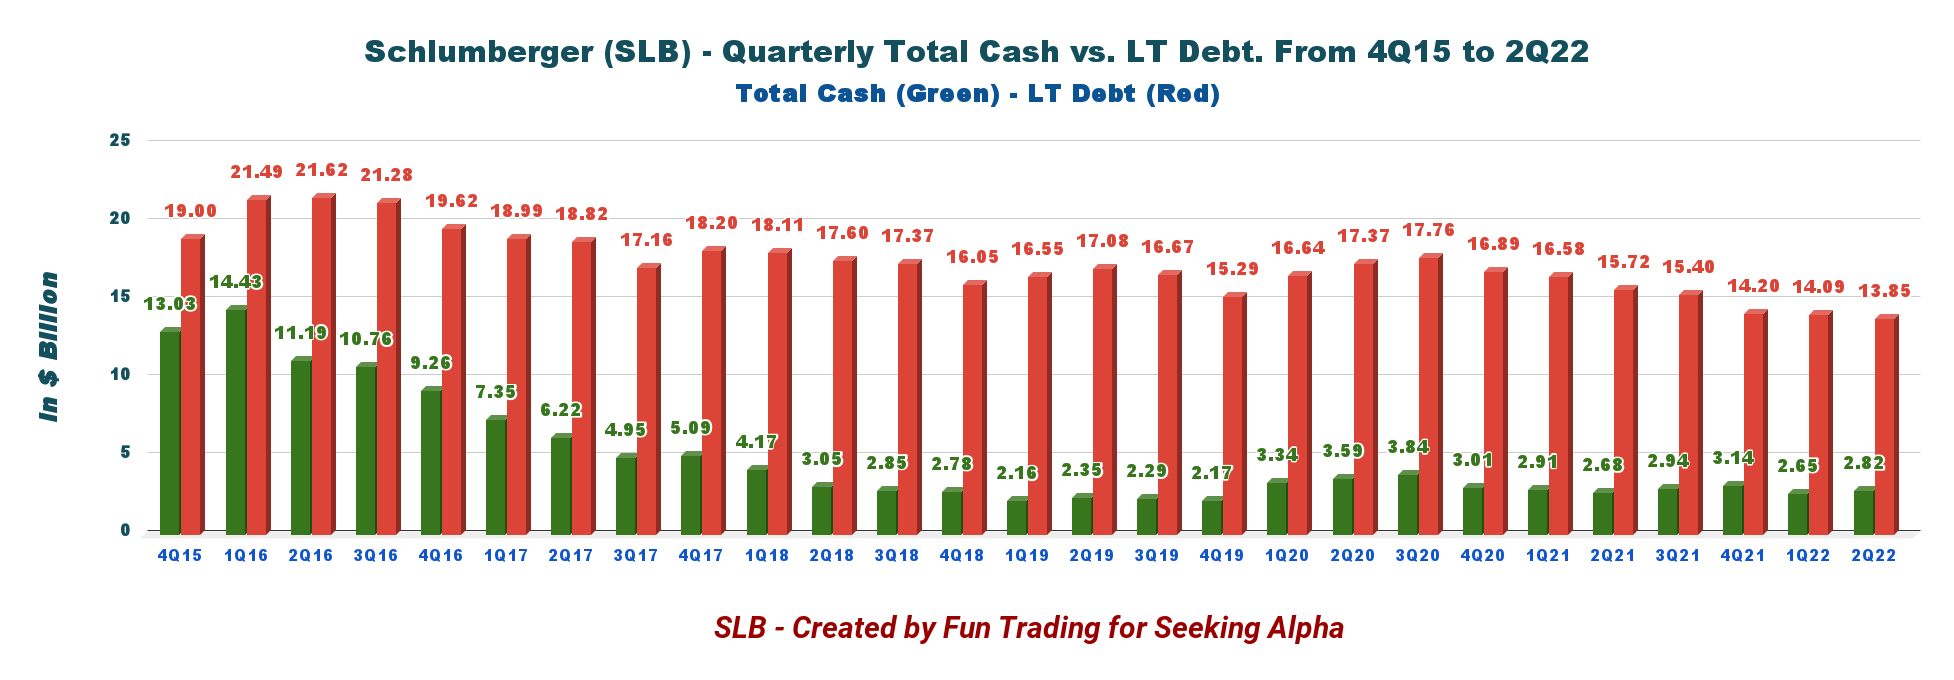
3 - Net Debt is $11.03 billion at the end of June 2022
SLB Quarterly Cash versus Debt history (Fun Trading)
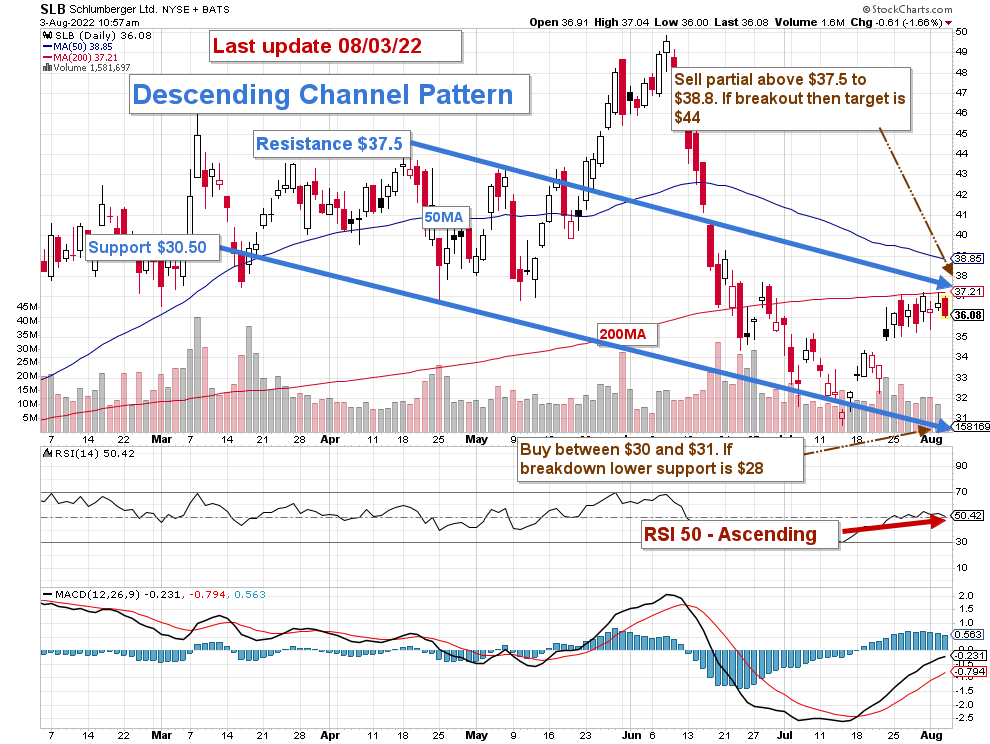
Technical Analysis and commentary
SLB TA Chart short-term (Fun Trading StockCharts ) Note: the chart has been adjusted for dividends.
The trading strategy is simple here. SLB forms a descending channel pattern with resistance at $37.5 and support at $30.50.
As I said in my investment thesis, I suggest trading short-term LIFO for about 50% of your position. I recommend selling partially between $37.5 and $38 and potentially waiting for a test at $44 in case of solid momentum later and selling another part.
Conversely, it is reasonable to accumulate when the stock experiences weakness between $40 and $39. If SLB crosses the support, the next lower support is between $30 and $31, with potential lower support at $28.
Trading LIFO is an excellent way of trading your long core position. It means that you are selling first your recent purchases and keeping your older position for a higher level. It will reward you with a much higher profit while reducing your risk significantly.
Note: The LIFO method is prohibited under International Financial Reporting Standards (IFRS), though it is permitted in the United States by Generally Accepted Accounting Principles (GAAP). Therefore, only US traders can apply this method. Those who cannot trade LIFO can use an alternative by setting two different accounts for the same stock, one for the long term and one for short-term trading.
Warning: The TA chart must be updated frequently to be relevant. It is what I am doing in my stock tracker. The chart above has a possible validity of about a week. Remember, the TA chart is a tool only to help you adopt the right strategy. It is not a way to foresee the future. No one and nothing can.
Author's note: If you find value in this article and would like to encourage such continued efforts, please click the "Like" button below to vote for support. Thanks.
For further details see:
Schlumberger: A Positive Quarter