SLB - Schlumberger: Attractive Multiples And Positive Technical Outlooks (Technical Analysis)
2023-07-10 05:47:34 ET
Summary
- Schlumberger Limited is identified as an undervalued stock with potential for mid-term and long-term uptrend, based on regression models and technical analysis.
- SLB stock's current trading multiples are lower than predicted, indicating undervaluation; Schlumberger is missing over 85% of the predicted price-earnings to growth value.
- While the overall mood of technical indicators is positive, there is some indecision in momentum development; the stock price may need to stabilize around $53-54 before kicking off a stronger uptrend.
Investment Thesis
I have identified Schlumberger Limited ( SLB ) as a technically attractive stock that might be on the cusp of the mid-term and long-term uptrend if an investor is willing to wait out possible indecision of the next weeks or months. Based on multiples resulting from a regression model, the stock seems to be undervalued as well, presenting an upside. The result recommendation is a Buy based on a high potential of both upsides aligning in the coming months.
Predicting Multiples from Regression Models
The analysis uses the January 2023 regression models provided by Professor Aswath Damodaran on his site. The models are calculated each January for the key global markets, with the US market as a separate one.
According to this approach, a company's current trading multiples are compared to the same company's predicted multiples based on regressions calculated from the state of the whole market in which it operates. Therefore, we are not seeking to draw conclusions from comparing the current trading multiples between a company in question and its sector peers or other companies with similar risk, growth, and cash flow (which is Professor Aswath Damodaran's definition of the "comparable" firms). Instead, we are looking for the relative difference in the form of the ratio between the current value and predicted value (i.e. difference of current minus predicted, divided by predicted). As a result, a company that trades currently in the market at a multiple lower (higher) than the one predicted from the market regressions based on the aggregate market data of all the companies in this market, is undervalued (overvalued). If we compare two companies and more, the one which has the biggest negative ratio is the most undervalued, while the one that has the biggest positive ratio is the most overvalued by the market. If you want to read more about this approach, check my article on Adobe , where I present in more detail the regression equations and explain how I use them.
The multiples I will analyze here are for Price-Earnings to Growth ((PEG)), Price to Book Value (PBV), Enterprise Value to Invested Capital (EV/IC), Enterprise Value to Sales (EV/Sales), and Price to Earnings (P/E). In the tables below they are presented in the descending order of a statistical value of R-squared, that is to say, by their explanatory power. I am skipping the EV to EBITDA multiple due to its insignificant R-squared.
Is Schlumberger relatively under- or overvalued?
To perform this analysis, I collected the inputs for the fundamental values of Schlumberger. Find them in the tables below. A modification I made is using an analysts' consensus growth rate prediction of EPS for the next 5 years in place of the prediction of Sales growth due to the uncertain availability of information for the latter. This replacement is allowed in Damodaran's model so I am using the EPS forward growth rate prediction numbers taken from the same source (Finviz) for consistency for Schlumberger and for all companies in the future articles.
Find below the values required as inputs to Damodaran's regressions.
| Inputs |
| Value for SLB, July 9, 2023 |
| Source |
| Payout ratio or "1- g/ROE" |
| 0.2892 |
| gEPS - 5 years forward growth prediction by analysts/ to use also as a proxy for g of Sales on EV/IC |
| 0.3270 |
| LN of gEPS for the PEG calculation |
| -1.118 |
| own calculation |
| B - beta of the company |
| 1.79 |
| Morningstar |
| ROE = NI/ BV Equity TTM |
| 0.2313 |
| Morningstar |
| ROIC - Return on invested capital = ROC = EBIT (1-t) / (BV of Debt + BV of Equity-Cash) TTM |
| 0.1385 |
| Morningstar |
| DFR = Debt to capital ratio = Total Debt/(Total Debt + Market value of equity) Q1 2023 |
| 0.1444621709 |
| own calculation data from Morningstar (in $ B: Market Cap 76.0414 ; Total Debt Q1 2023 12.84) |
| Tax rate = Effective tax rate = Taxes paid/ Taxable Income FY 2022 |
| 0.1960 |
| Operating Margin = Pre-tax Operating Income/ Sales TTM |
| 0.1549 |
| Morningstar |
If we apply these financial data to the regression equations provided by Damodaran, we receive the predicted values of the multiples. See the results below.
| Regression equations for year 2022 |
| R-squared |
| Predicted multiples |
| EV/Invested Capital= 3.53 + 1.30 g + 7.30 ROIC - 4.20 DFR |
| 0.567 |
| 4.359408882 |
| PEG = 6.71 + 1.20 Payout - 1.57 ln(gEPS) -0.77 Beta |
| 0.566 |
| 7.434 |
| PBV= 2.32 + 4.60 gEPS - 1.33 Beta + 8.90 ROE + 0.80 Payout Ratio |
| 0.369 |
| 3.73343 |
| EV/Sales = 2.32 + 2.60 g + 10.60 Oper Margin -1.40 DFR- 3.50 Tax rate |
| 0.306 |
| 3.923892961 |
| PE = 8.63 + 2.23 Beta + 46.20 gEPS + 19.30 Payout |
| 0.25 |
| 33.24526 |
We can compare now the predicted values of multiples to the values that are actual and based on stock price and raw financial data as of the day of writing. As I mentioned above, the comparison of the predicted vs actual values indicates the theoretical over- or undervaluation in the context of the aggregate data of all companies in the US market.
| Multiple |
| Predicted multiples |
| Currently trading at |
| Source of current multiple |
| Undervalued or overvalued by the US market values |
| EV/IC |
| 4.359408882 |
| n/a |
| own calculation |
| n/a |
| PEG |
| 7.434 |
| 1.05 |
| Morningstar |
| -85.88% |
| PBV |
| 3.73343 |
| 4.21 |
| Morningstar |
| 12.76% |
| EV/Sales |
| 3.923892961 |
| 2.89 |
| -26.35% |
| P/E |
| 33.24526 |
| 19.91 |
| Morningstar |
| -40.11% |
Based on the ratios between current valuation multiples and regressions we can appreciate the scale of differences and try to establish a predominant inefficiency of the market. If we follow the theory of regressions, we can say that Schlumberger trades currently at a low PEG (contrary to the popular opinion that a value of 1 is a fair value), with an implicit undervaluation of over 85% of the predicted PEG value of 7.4. This scale of undervaluation is predominantly driven by the expected very high (Finviz indicates analysts' consensus of around 32.7% ) growth in the next 5 years. Its current P/E is falling short by 40% of its "fair" P/E (in other words, the current P/E is as low as 60% of what is predicted), while the EV/Sales is just slightly less undervalued - missing a chunk of nearly 27% of its "fair" EV/Sales. On the topic of multiples based on balance sheet data, that is to say, PBV multiple, Schlumberger is overvalued by nearly 13%. Overall, the comparison of the values predicted by the regression and the current multiples indicate that Schlumberger is undervalued by today's market and the stock should trade at higher multiples.
The current value of EV/IC is not readily available in public and free sources, so I only calculate it on the basis of the regression equation for the merit of its highest statistical explanatory value (from all the equations presented by Damodaran). It may be used by the reader to compare separately the companies analyzed in my individual articles amongst themselves.
Technical analysis
I will analyze Schlumberger from a perspective of a number of technical analysis tools and show the screenshots on the monthly and weekly Heikin Ashi candles charts - each timeframe presented through two separate sets of indicators - which I will complement with a simplified daily Renko chart to reflect the short-term price momentum. The details of my methodology can be found in my previous articles as those on Salesforce or Adobe .
The Long-Term Trend
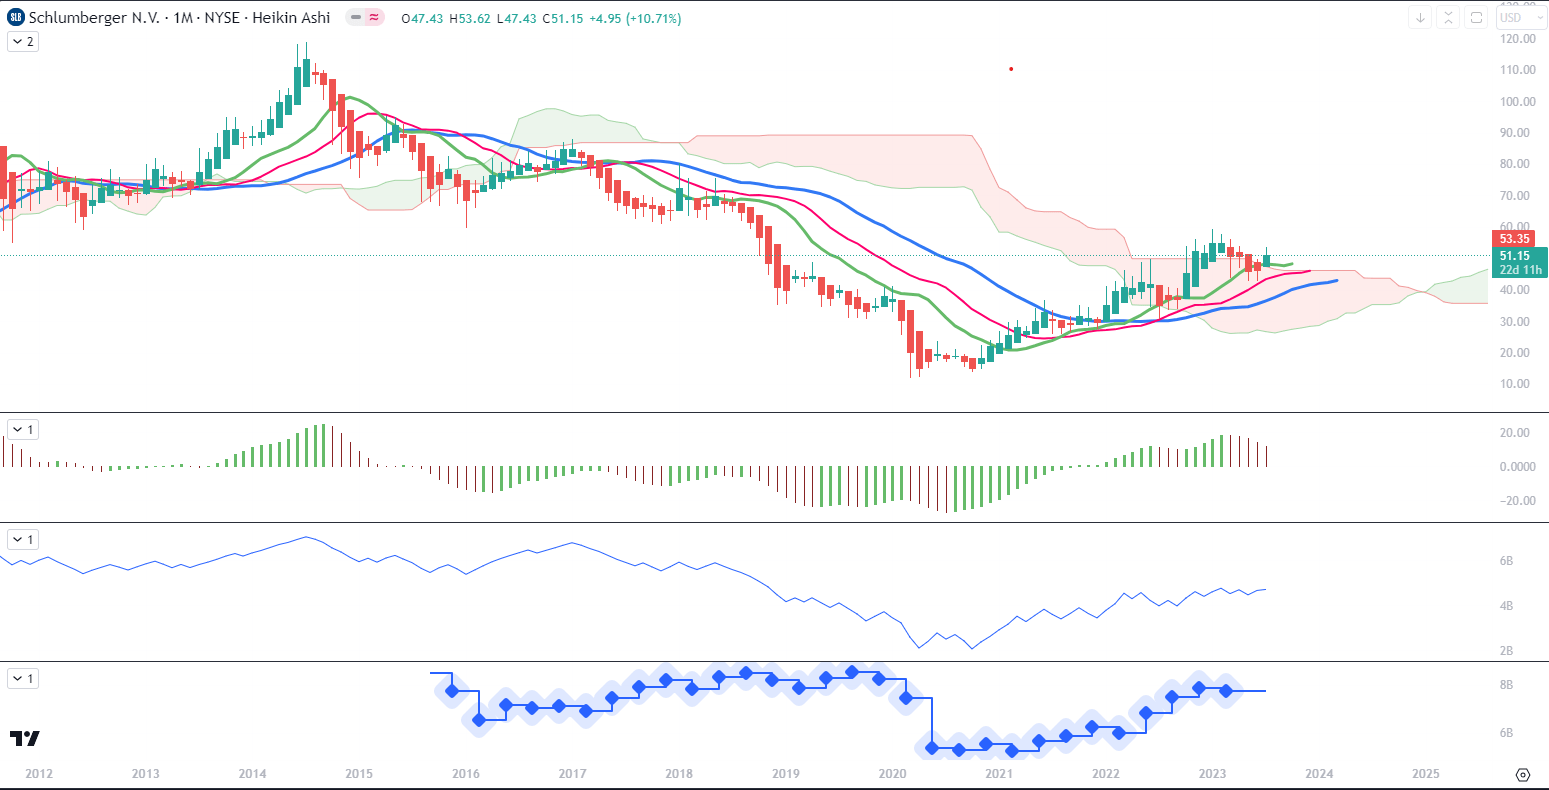
For long-term trend analysis, I use monthly charts. In Chart 1 setup, Schlumberger stock has started a green monthly Heikin Ashi candle for July after a 4-month correction. However, the stock has been in an uptrend since November 2020 and the technical indicators are showing a continuation. Ichimoku Cloud has developed a decent green size. Alligator's lines are in a positive setup (Lips over Teeth and Teeth over Jaw), while the On Balance Volume (OBV) line is trending up. The only divergent indicator is the Awesome Oscillator (AO) which is in a falling trend, even though it is still in the positive territory. The bottom pane indicates Revenues.
Chart 1 - Monthly (TradingView)
In Chart 2 setup, we can see that the 10-month Moving Average is in a strong slope above the 50-month MA. The latter seems also to have bottomed and made a slow U-turn. The July candle's wick has reached above the 10-MA. The remaining indicators are showing the pick-up of momentum, however with some caveats. Although Composite Index Divergence Indicator (CIDI) is making a U-turn, its fast-moving average (green line) is still below the slow (orange) average. Moving Average Convergence Divergence (MACD) is resting on top of its signal and needs to bounce off it to show a return to an uptrend. The Positive Direction Indicator (DI+) line, remaining above the Negative Direction Indicator (DI-) line, is widening the space between both lines and it is the most stable indicator of a trend on this chart.
Chart 2 - Monthly (TradingView)
Overall, from the slopes of indicators on the monthly timeframe, we can see that the uptrend started some time ago but it is not explosive. Rather, we can expect a period of accumulation.
The Mid-Term Trend
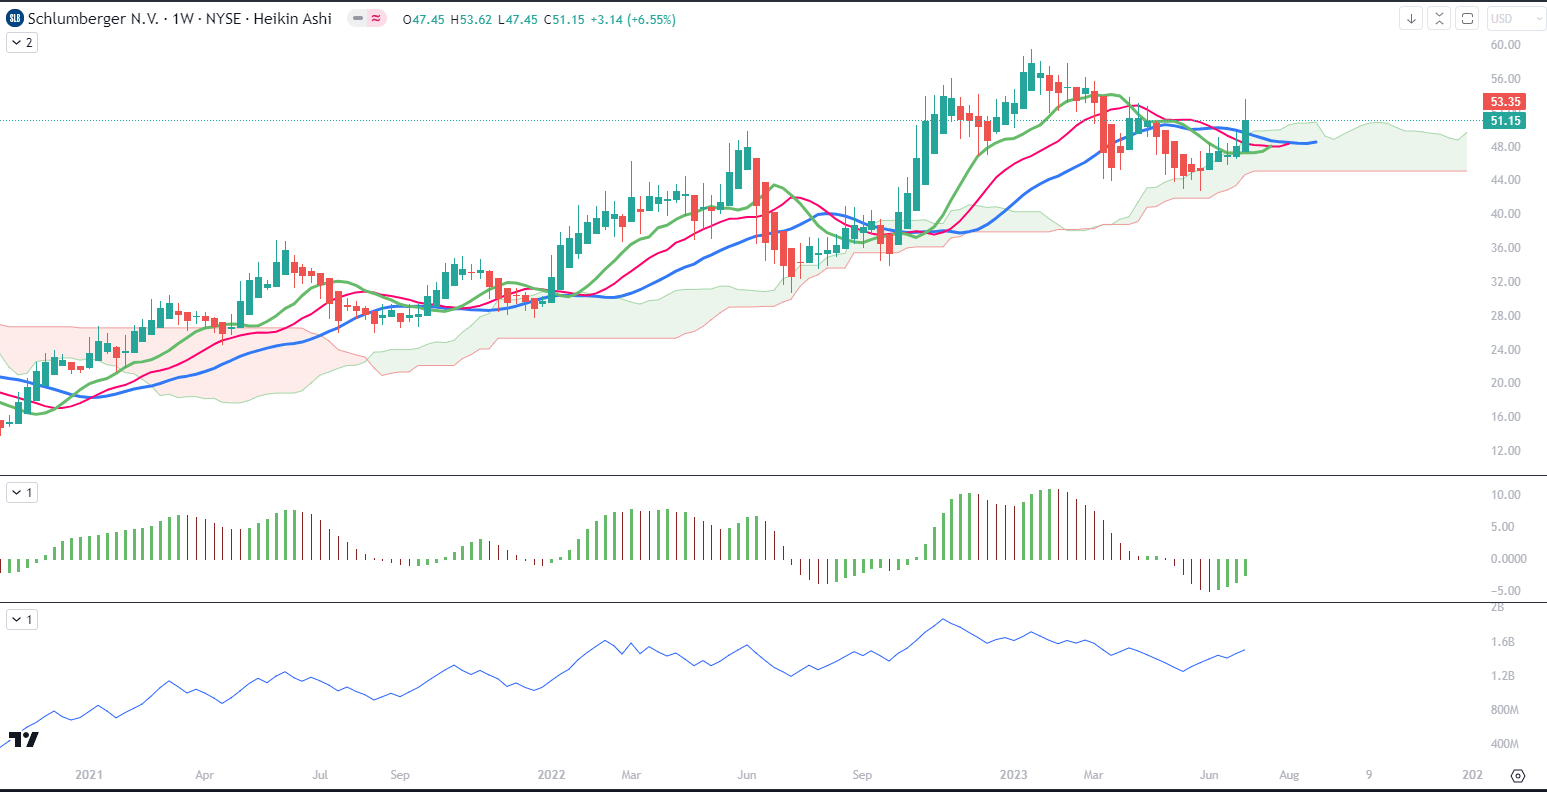
For the mid-term trend analysis, I use weekly charts. In Chart 1, we can see a strong momentum returning. A strong weekly candle has moved above all the Alligator's lines as well as above the upper edge of the green Ichimoku cloud. The Alligator's lines are also in a crossing situation. Green Lips are crossing red Teeth, while the Teeth are crossing blue Jaw. Also, the AO is moving from below toward the zero line. The levels of highs and lows for OBV are also rising. At this moment, the width of the Ichimoku cloud indicates that the strong S/R lines are between $45 and $51, slightly below where the last week closed.
Chart 1 - Weekly (TradingView)
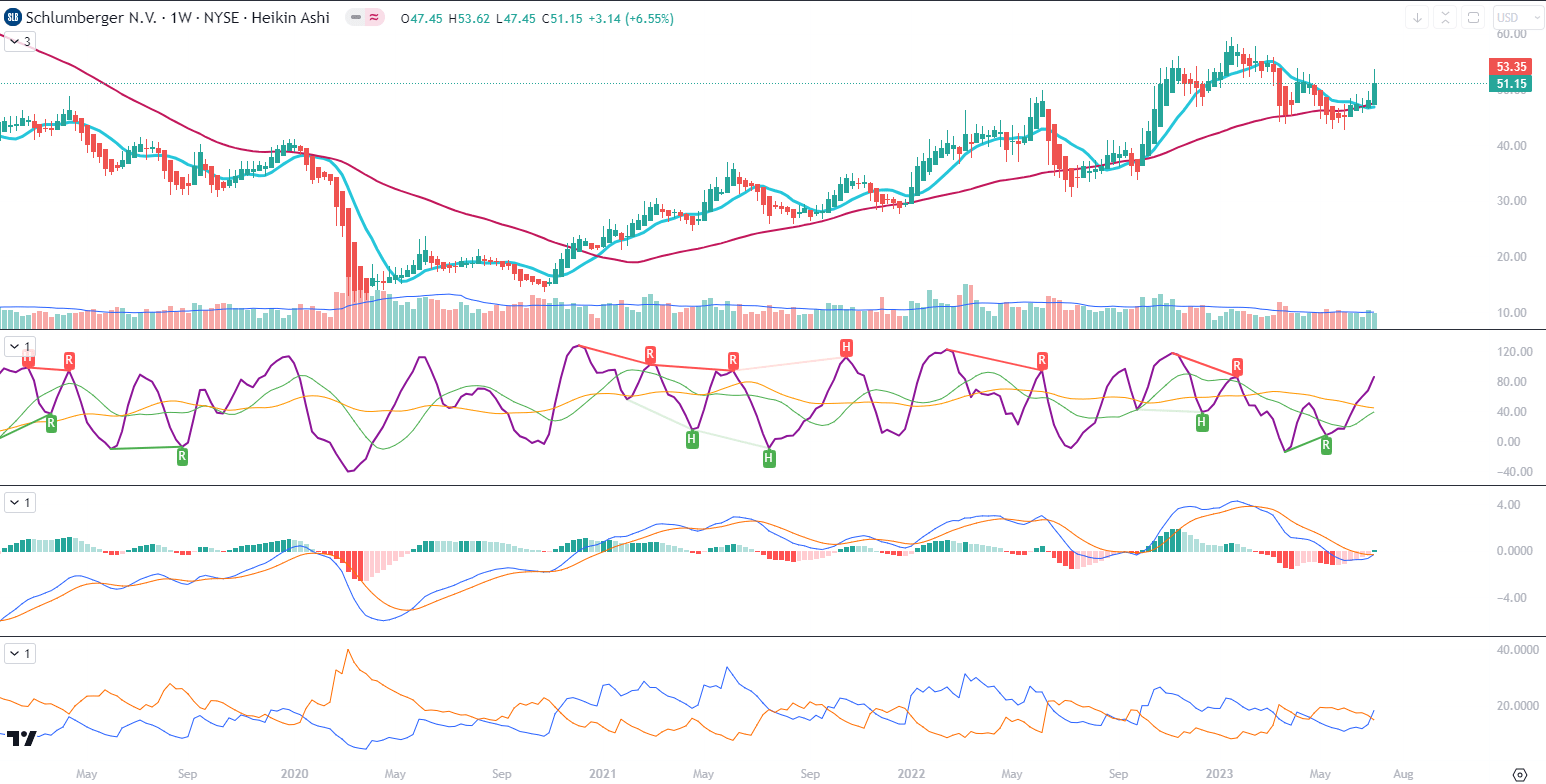
In Chart 2, we see much stronger momentum in the movement of indicators. Although the 10-week MA has dipped below the 50-week MA, last week's candle started off the 50-week MA and does not have a lower wick. CIDI has taken a sharp slope above the slow average, while the fast average is making an approach from below to cross the slow one. MACD and its signal are below the zero level but there is a crossing of MACD above the signal taking place. We can also see that the DI+ line has crossed above the DI-, confirming a possible return to a mid-term uptrend. On this timeframe, we can also appreciate that the volume for the last two weeks has reached close and above the volume 20-week average line.
Chart 2 - Weekly (TradingView)
The Price Momentum
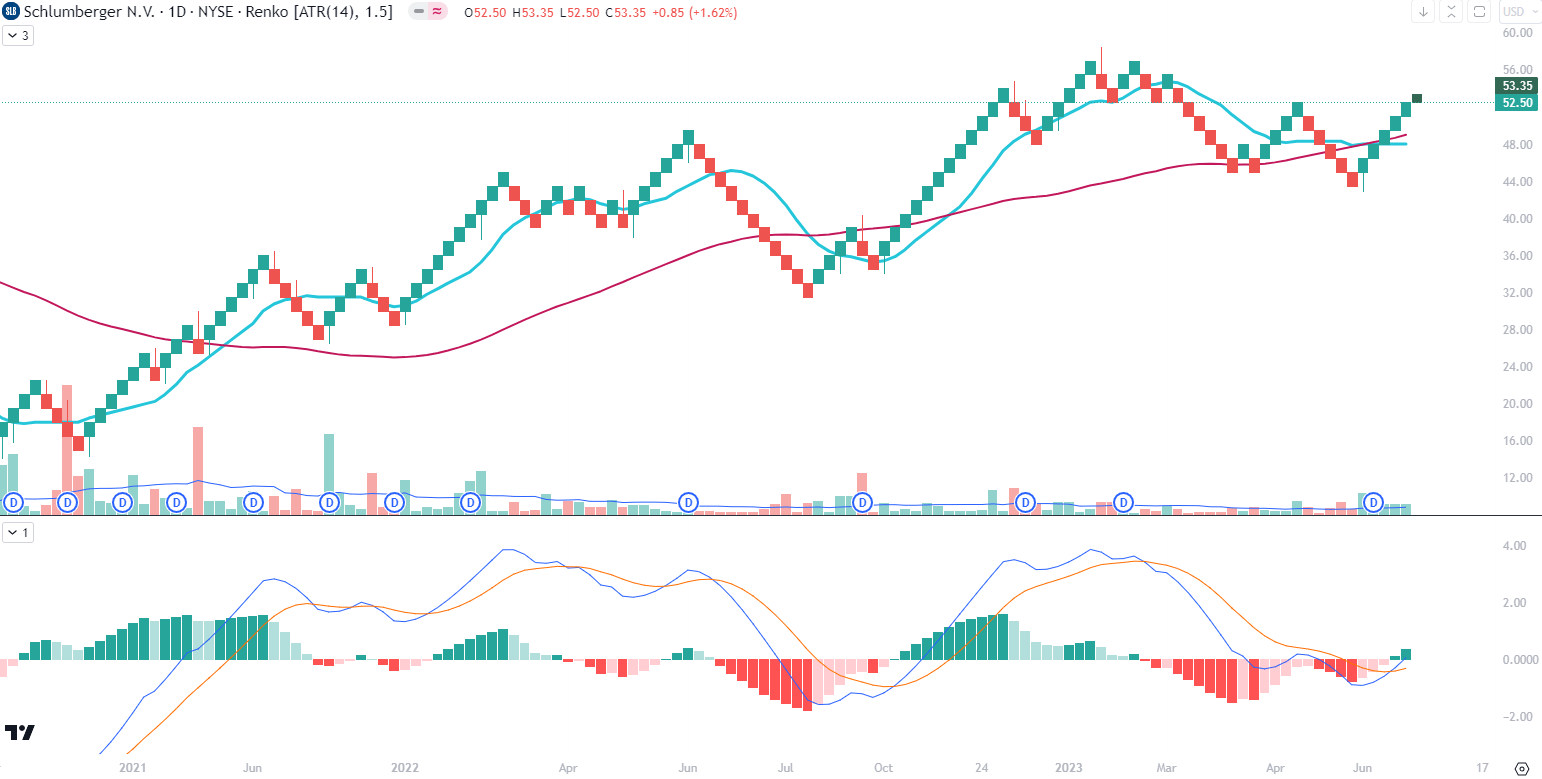
On the daily Renko chart, we see that the last five boxes started last week and crossed above both moving averages. The blue 10-box MA is still to cross the red 50-box MA line. We can see a positive sign in the MACD crossing above the zero level. The last time this happened was in October 2022. The picture is positive overall but the slowdown could be expected to be happening in the coming weeks to stabilize around the S/R levels.
Renko chart - Daily (TradingView)
Conclusions
Overall, the regression-based valuation of the stock indicates a potential for an upside. Also, the overall mood of technical indicators is rather positive. However, I can see a slight indecision in the way momentum develops. On much higher timeframes it might be necessary for the price to build a strong base around $53-$54 after a period of rest, accumulation, or a temporary correction to levels of $45, in order to possibly drive to the next target around $65-$66.
For further details see:
Schlumberger: Attractive Multiples And Positive Technical Outlooks (Technical Analysis)