BKR - Schlumberger: Solid Earnings But An Uncertain Future Ahead
Summary
- Schlumberger Limited recorded a 26.6% increase in revenue yearly and up 5.4% over the 3Q22. Net income was $1,064 million or $0.74 per diluted share.
- 2022 was a golden year, but 2023 is not. Looking at oil and gas prices, it is clear that the exuberance is gone.
- Schlumberger’s board of directors approved a quarterly cash dividend of $0.25 per share, up from $0.175 the previous quarter.
- I recommend accumulating Schlumberger stock on any weaknesses between $53.3 and $52, with lower support possible at $44.6.
Introduction
Houston-based Schlumberger Limited ( SLB ) released its fourth-Quarter and full-year 2022 Results on January 20, 2023.
Note: I have followed SLB quarterly since December 2018 with 17 articles and counting. This new article is a quarterly update of my article published on October 25, 2022.
1 - 4Q and FY22 results Snapshot
SLB reported fourth-quarter 2022 adjusted earnings of $0.71 per share, beating once again analysts' expectations. It significantly increased from the $0.41 per share a year ago.
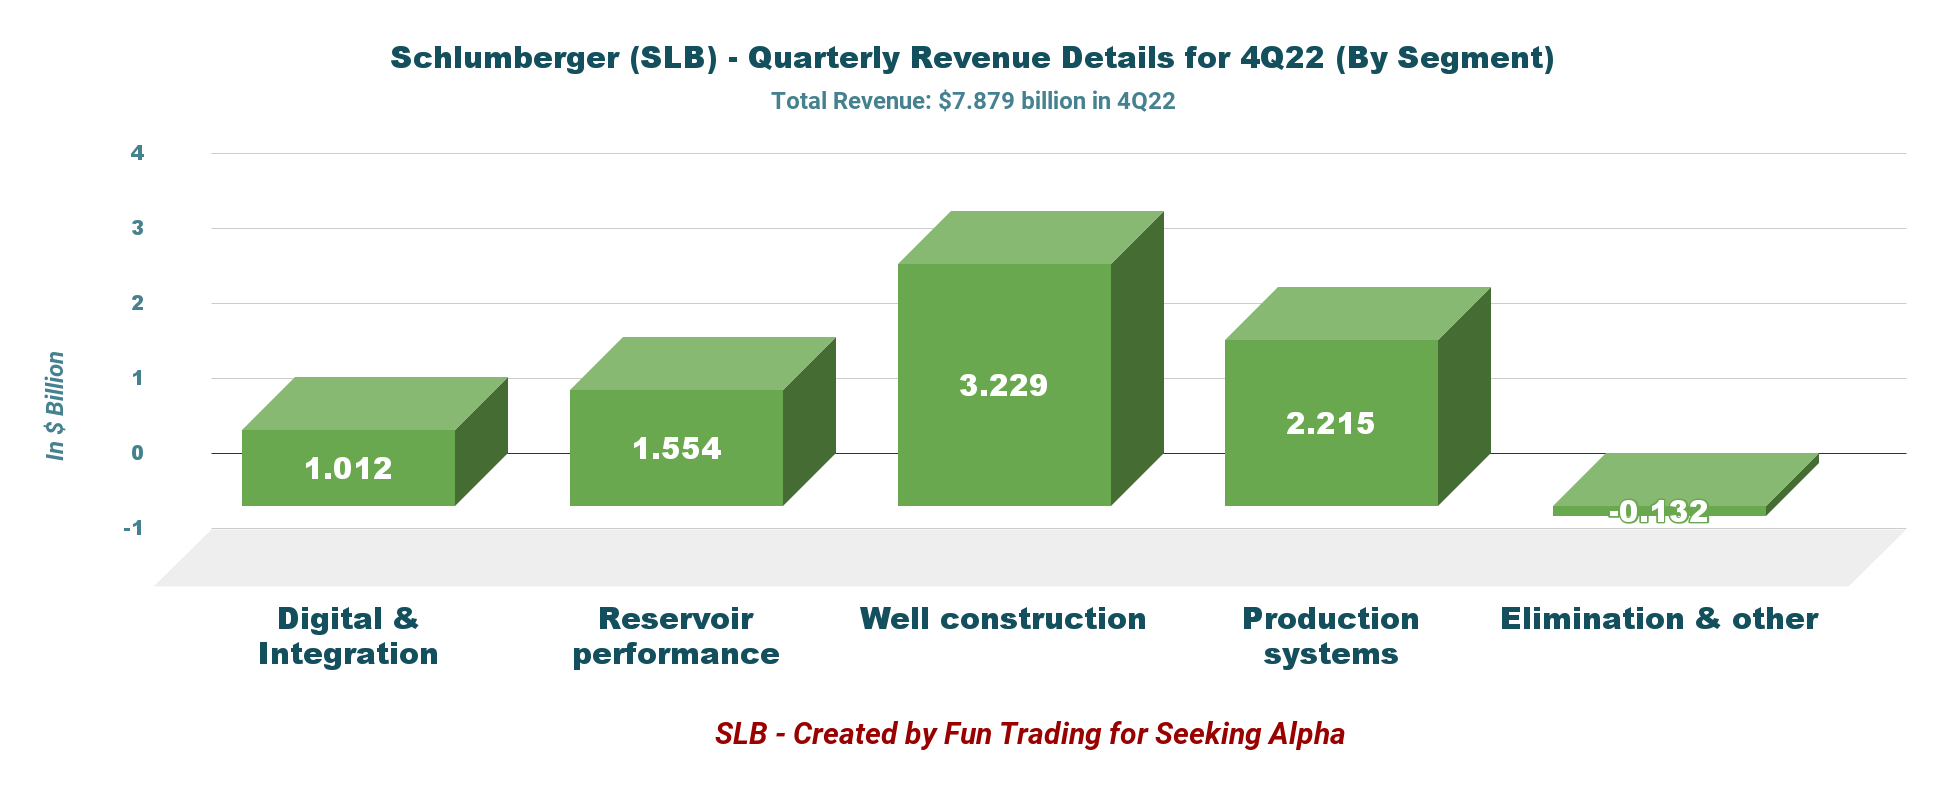
Also, Schlumberger posted total quarterly revenues of $7,879 million, up the year-ago quarter’s $6,225 million.
It was a solid quarterly result reflecting vigorous business activities in land and offshore resources in North America and Latin America.
Schlumberger’s board of directors approved a quarterly cash dividend of $0.25 per share, up from $0.175 the previous quarter.
CEO Olivier Le Peuch said in the conference call:
we sustained growth momentum through the fourth quarter, delivering strong revenue growth and further margin expansion, both sequentially and year-over-year. The quarter was characterized by very strong activity growth in the Middle East and offshore and was augmented by robust year-end sales in Digital.
2 - Investment Thesis
I own SLB stock, which is...
SLB Quarterly Free cash flow history (Fun Trading)
...my preferred company in the oilfield services segment due to its vast expertise and eclectic business spread equally worldwide.
I continue to view the stock as a long-term option and have owned a long-term position for many years.
However, the oilfield-services sector is less rewarding than the E&P industry and quickly shifts from a successful investment to a more non-inspiring one without sufficient time to adapt to the new paradigm.
We are now in 2023, and it is evident that the business will not deliver the same return and could rapidly turn sour depending on the oil and gas prices.
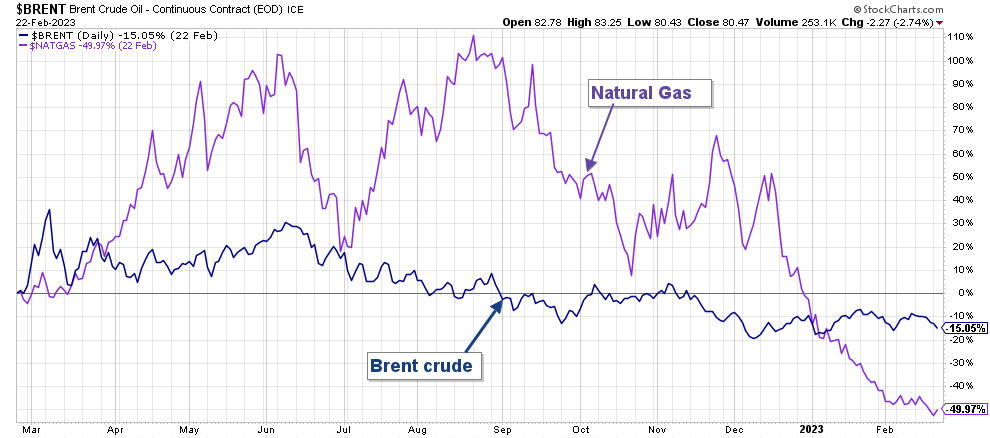
A savvy investor must quickly recognize the first signs of trouble and adopt a trading/investing strategy that fits the challenge ahead. A quick look at oil and gas prices, which are crucial for the business, tells us what we may experience soon.
SLB Brent and NG 1-Year chart (Fun Trading StockCharts)
The basic principle is that the company generates revenues by increasing drilling contracts and services that could be quickly affected by a turnaround worsening in H2 2023.
The oil sector has experienced a gigantic rally in 2022 but is cooling down significantly, as shown in the chart above.
The strategy that fits such pivoting situations is to trade LIFO around a long-term position. I think trading 60% entire position is the most adapted strategy with cyclical stocks. It protects you from excessive ups and sector and provides an extra-gain non-negligible while waiting for a new rebound.
3 - Stock Performance
As shown below, Schlumberger has outperformed the VanEck Vectors Oil Services ETF ( OIH ), Baker Hughes ( BKR ), and Halliburton ( HAL ) quite significantly. SLB is up 33% on a one-year basis.
Schlumberger Financials history ending 4Q22 Trend And Raw numbers
| Schlumberger |
| 4Q21 |
| 1Q22 |
| 2Q22 |
| 3Q22 |
| 4Q22 |
| Total Revenues in $ Billion |
| 6.23 |
| 5.96 |
| 6.77 |
| 7.48 |
| 7.88 |
| Net income in $ Million |
| 601 |
| 510 |
| 959 |
| 907 |
| 1,064 |
| EBITDA $ Million |
| 1,425 |
| 1,294 |
| 1,808 |
| 1,256 |
| 1,539 |
| EPS diluted in $/share |
| 0.42 |
| 0.34 |
| 0.67 |
| 0.63 |
| 0.74 |
| Cash flow from operating activities in $ Million |
| 1,932 |
| 131 |
| 408 |
| 1,567 |
| 1,614 |
| CapEx in $ Million |
| 465 |
| 344 |
| 320 |
| 382 |
| 669 |
| Free cash flow in $ Million |
| 1,467 |
| -213 |
| 88 |
| 1,185 |
| 945 |
| Total cash $ Billion |
| 3.14 |
| 2.65 |
| 2.82 |
| 3.61 |
| 2.89 |
| Total LT Debt in $ Billion |
| 14.20 |
| 14.09 |
| 13.85 |
| 13.35 |
| 13.23 |
| Dividend per share in $ |
| 0.125 |
| 0.175 |
| 0.175 |
| 0.175 |
| 0.25 |
| Shares Outstanding (Diluted) in Million |
| 1,442 |
| 1,434 |
| 1,436 |
| 1,414 |
| 1,440 |
Source: Company release .
Revenues, Free Cash Flow, And Debt Analysis
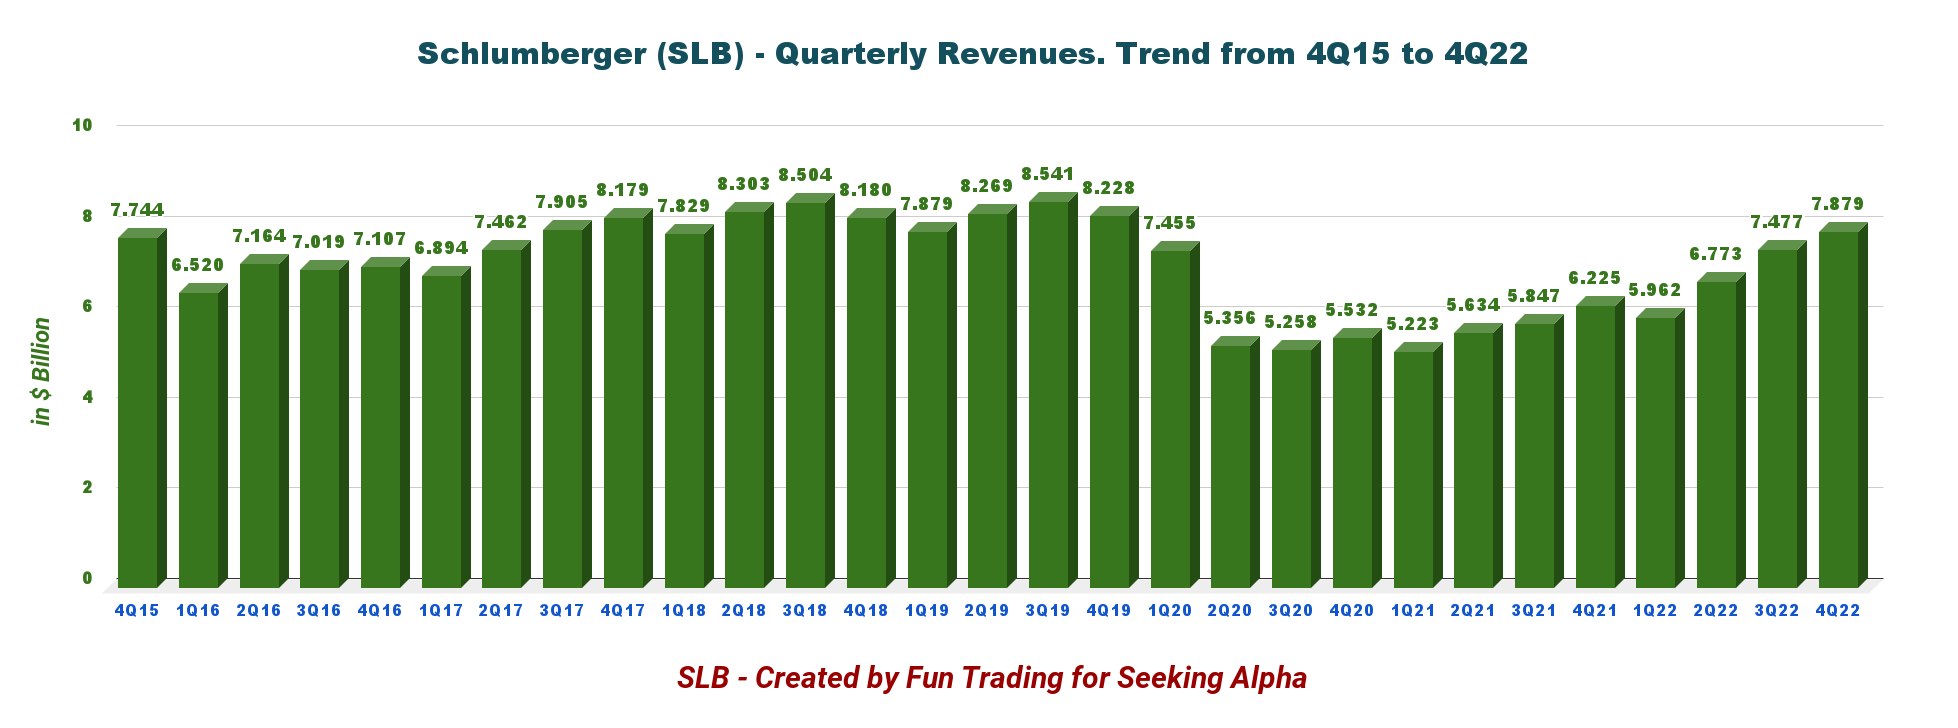
1 - Quarterly Revenues were $7.879 billion at the end of December 2022
SLB Quarterly Revenues history (Fun Trading)
Schlumberger recorded a 26.6% increase in revenue year over year and up 5.4% over the 3Q22. Net income was $1,064 million or $0.74 per diluted share compared with $601 million or $0.42 in 4Q21.
Schlumberger also sold an additional portion of its Liberty Energy (LBRT) oilfields services shares, which generated $218 million of net proceeds during the quarter. SLB currently owns a 4.9% interest in Liberty.
Schlumberger CEO Oliver Le Peuch said in the press release:
we sustained growth momentum through the fourth quarter, delivering strong revenue growth and further margin expansion, both sequentially and year-over-year. The quarter was characterized by very strong activity growth in the Middle East and offshore and was augmented by robust year-end sales in Digital.
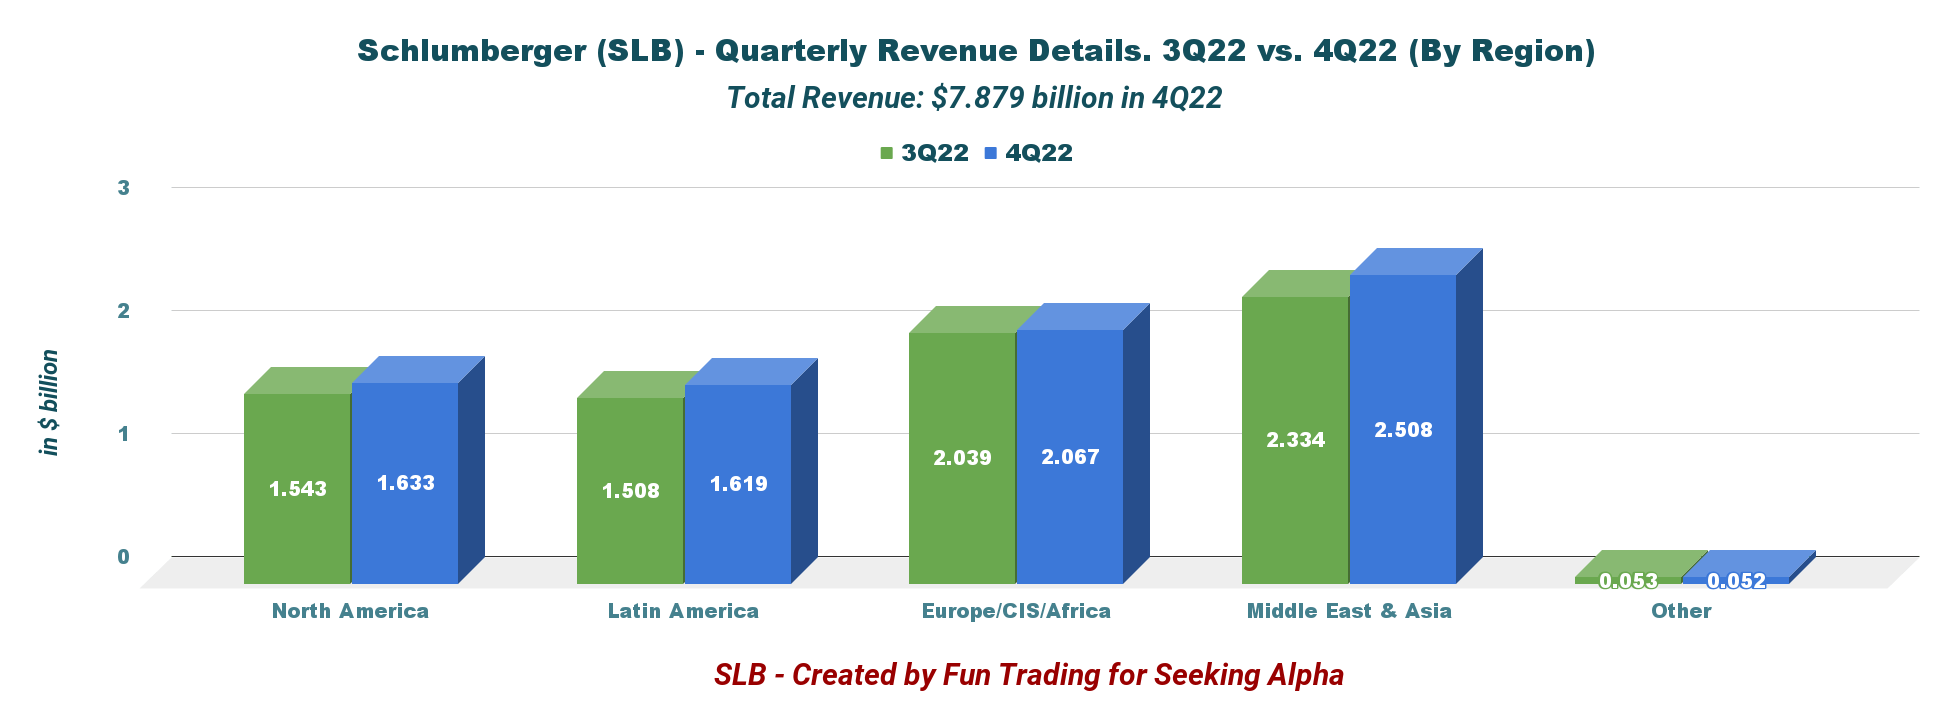
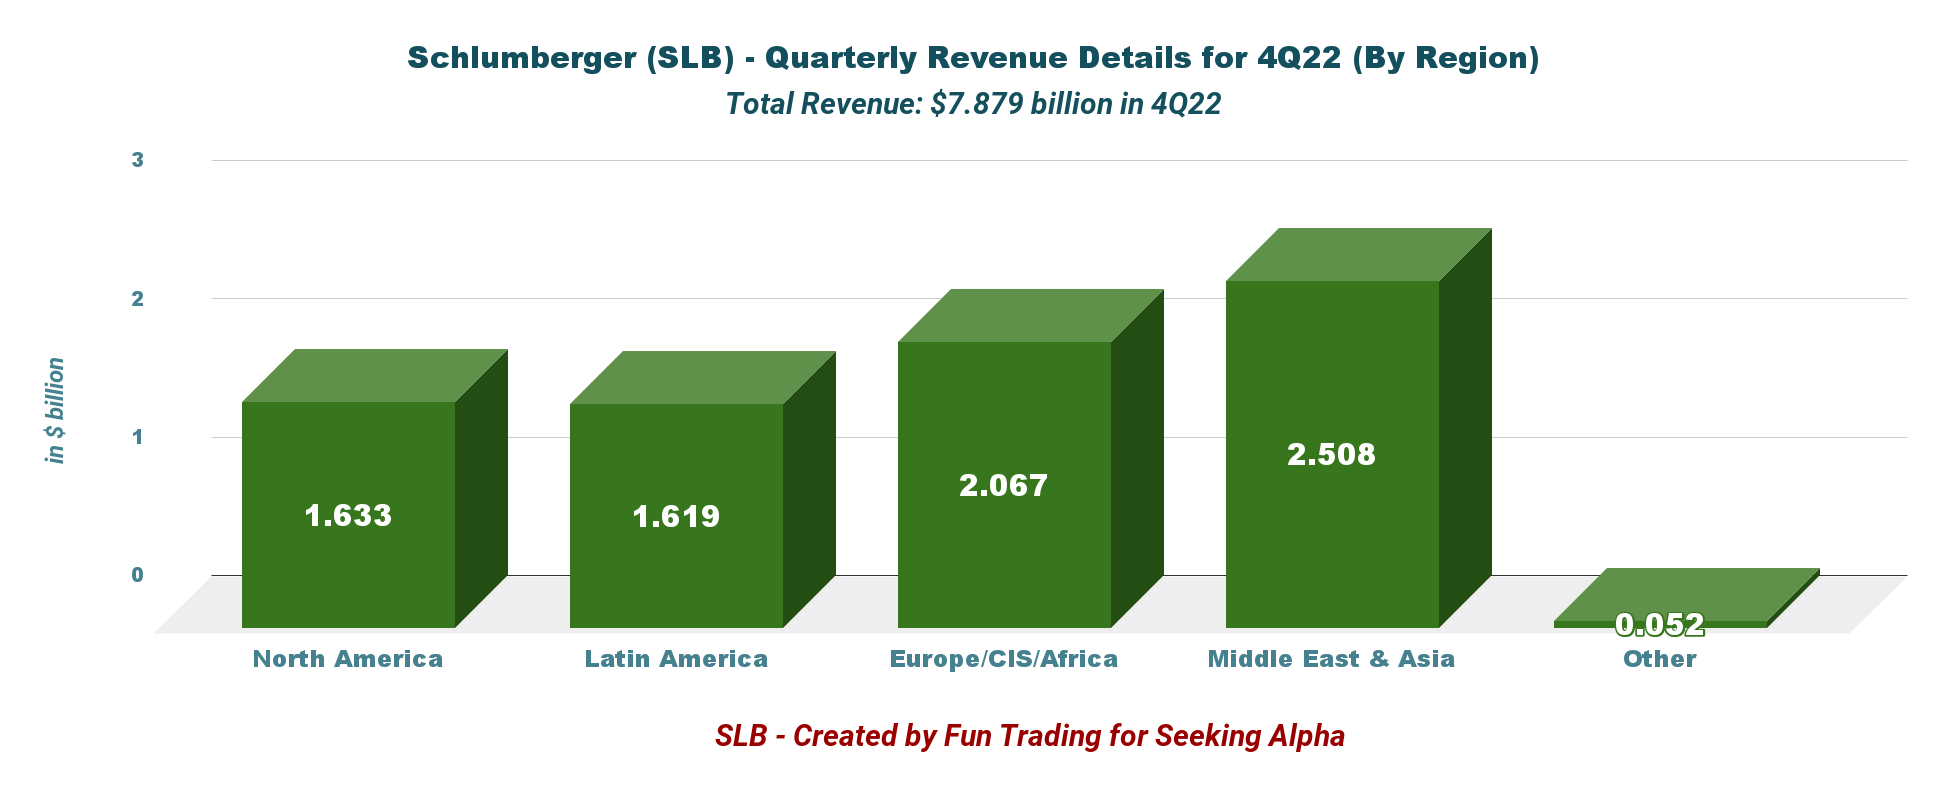
1.1 Revenues per Region
Revenues were significantly higher sequentially, especially for the International business. However, all regions delivered a higher revenue QoQ, as shown below:
SLB Quarterly per region 3Q22 versus 4Q22 (Fun Trading) SLB 4Q22 revenues per region (Fun Trading)
1.2 - Revenue per segment
SLB 4Q22 revenues per segment (Fun Trading) As we can see, the Well construction segment is the most influential for the company and represents 41% of the company's revenue.
CFO Stephan Biguet said in the conference call:
All divisions posted sequential revenue growth led by Digital & Integration and Reservoir Performance. From a geographical perspective, North America revenue grew 6% sequentially, while international revenue grew 5%, led by the Middle East.
1.2.1 - Digital & Integration
Revenues totaled $1,012 million, up 14% from last year. The higher contributions came from better revenue from Asset Performance Solutions in Ecuador and a strong demand for exploration data and digital sales in North America and internationally.
1.2.2 - Reservoir Performance
Revenues rose 21% year over year to $1,554 million. This quarter, the solid profit was again due to solid land and offshore activities.
1.2.3 - Well Construction
Revenues increased 36% from last year's quarter to $3,229 million, up from 3,084 million last year. The increase was due to robust offshore drilling activities in Latin America with higher profit margins.
1.2.4 - Production Systems
Revenues were $2,215 million, up 26% from last year. Production systems recorded higher sales from new projects and increased product deliveries, particularly in Europe/CIS/Africa, North America, and Latin America.
1.2.5 - 2023 outlook
In 2023, Schlumberger expects a $2.5-$2.6 billion for the full-year CapEx, up from the $2.3 billion indicated in 2022.
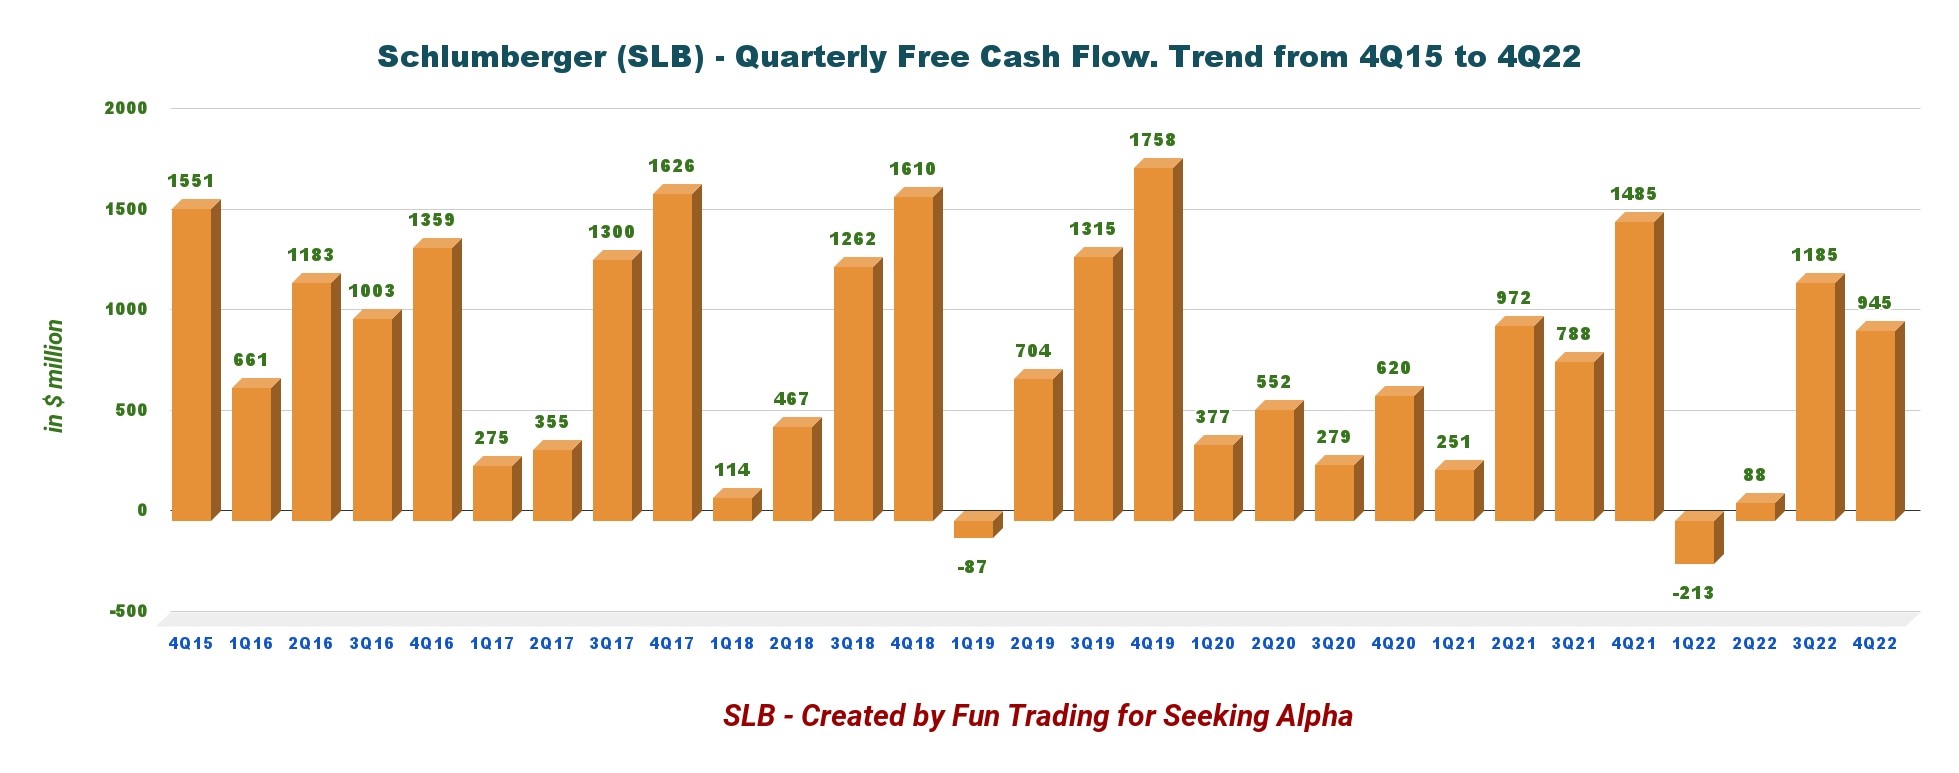
2 - The Free Cash Flow was $945 million in 4Q22
SLB Quarterly Free cash flow history (Fun Trading)
Note: The generic free cash flow is the cash from operating activities minus CapEx. The difference is how the CapEx is calculated. Schlumberger used a CapEx, including investments in APS projects and multi-client. I used a CapEx of $669 million.
Trailing 12-month free cash flow was $2,005 million, and 4Q22 free cash flow was $945 million from $1,185 million in 3Q22.
Schlumberger's board of directors approved a quarterly cash dividend of $0.25 per share. It is a dividend yield of 1.91%.
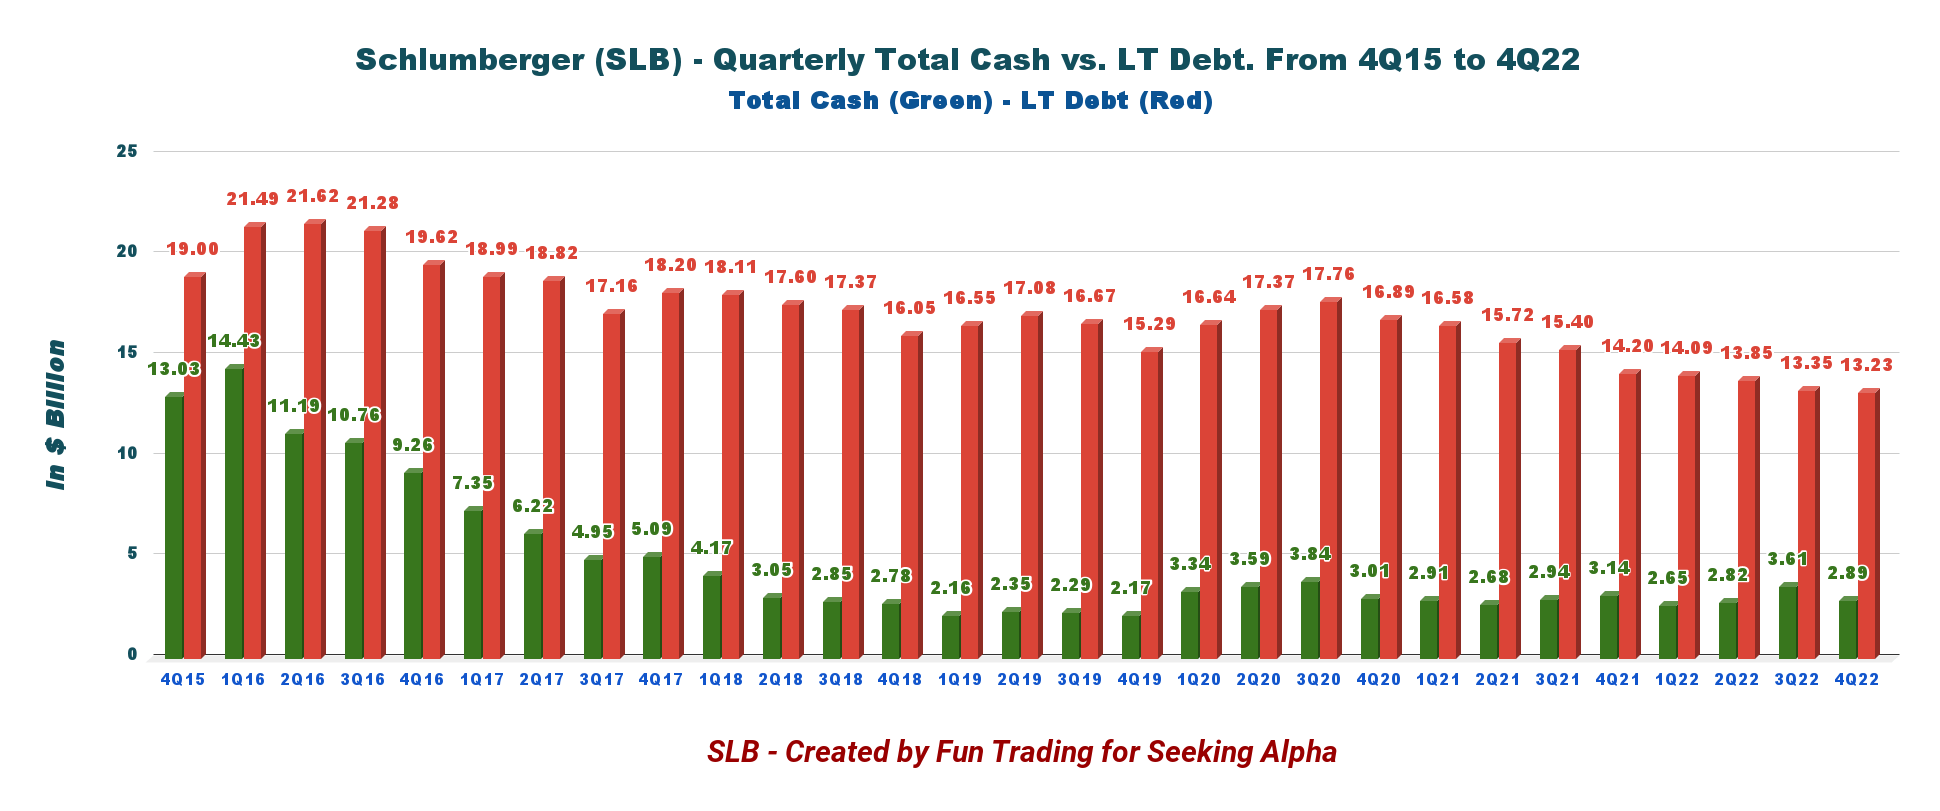
3 - Net Debt is $9.33 billion at the end of December 2022
SLB Quarterly Cash versus Debt history (Fun Trading)
CFO Stephane Biguet said in the conference call:
we ended the year with net debt of $9.3 billion. This represents an improvement of approximately $400 million sequentially and $1.7 billion compared to the end of 2021. This also represents our lowest net debt level since the first quarter of 2016. Consequently, our net debt-to-EBITDA leverage is now down to 1.4.
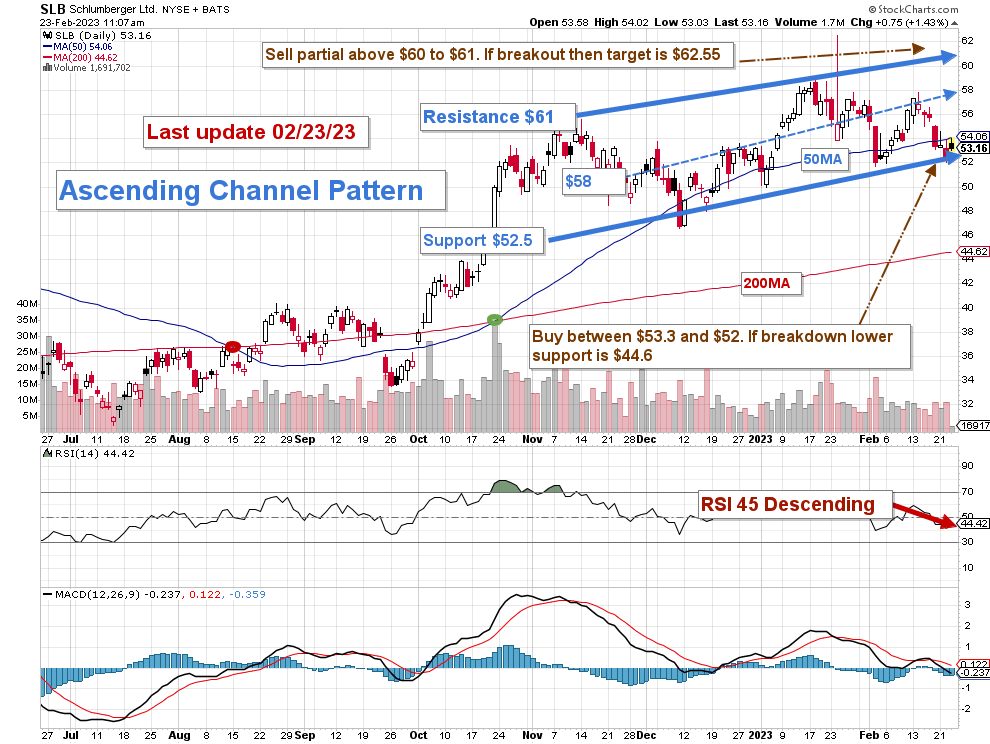
Technical Analysis and Commentary
SLB TA Chart short-term (Fun Trading StockCharts) Note: the chart has been adjusted for dividends.
SLB forms an ascending wedge pattern with resistance at $61 and support at $52.5.
Ascending channel patterns or rising channels are short-term bullish in that a stock moves higher within an ascending channel, but these patterns often form within longer-term downtrends as continuation patterns. The ascending channel pattern is often followed by lower prices,
As I said in my investment thesis, I suggest trading short-term LIFO for about 50% of your position. I recommend selling partially between $60 and $61 and potentially waiting for a test at $62.55 in case of solid momentum to sell another portion.
Conversely, it is reasonable to accumulate when the stock experiences weakness between $53.3 and $52, with lower support possible at $44.6.
2022 was a golden year for oilfield services, but 2023 will not be as exciting, and I believe the business will drop significantly with oil and gas considerably from their tops.
Trading LIFO is an excellent way of trading your long core position. It means that you are selling first your recent purchases and keeping your older position for a higher level. It will reward you with a much higher profit while reducing your risk significantly.
Warning: The TA chart must be updated frequently to be relevant. It is what I am doing in my stock tracker. The chart above has a possible validity of about a week. Remember, the TA chart is a tool only to help you adopt the right strategy. It is not a way to foresee the future. No one and nothing can.
For further details see:
Schlumberger: Solid Earnings But An Uncertain Future Ahead