BKR - Schlumberger: Time To Take Some Profit Off
2023-07-26 12:40:13 ET
Summary
- Schlumberger Limited reported second quarter 2023 adjusted earnings of $0.72 per share, beating once again analysts' expectations. It significantly increased from $0.50 per share a year ago.
- Schlumberger posted total quarterly revenues of $8,099 million, up from the year-ago quarter's $6,773 million.
- The balance sheet explains why I consider Schlumberger the best long-term investment in this industry.
- I believe the oilfield services sector is now overbought and it is perhaps time to sell a part of your Schlumberger position between $57.8 and $58.5, with a possible higher resistance at $59.5 in case of solid momentum.
Introduction
Houston-based Schlumberger Limited (SLB) released its second quarter 2023 results on July 21, 2023.
Note: I have followed SLB quarterly since December 2018. This article updates my article published on May 29, 2023.
Schlumberger is the last of the three selected oilfield services I follow regularly on Seeking Alpha and are part of my stock tracker. I strongly recommend reading my recent Baker Hughes (BKR) and Halliburton (HAL) articles about their 2Q23 results by clicking on the business name in blue.
1 - 2Q23 Results Snapshot
SLB reported second quarter 2023 adjusted earnings of $0.72 per share, beating once again analysts' expectations. It significantly increased from the $0.50 per share a year ago.
Also, Schlumberger posted total quarterly revenues of $8,099 million , up from the year-ago quarter's $6,773 million. Revenue was lower than expected.
However, It was a solid quarterly result, reflecting robust business activities in land and offshore resources in North America and Latin America. The company indicated that the North American segment will be slightly down in 3Q23.
Schlumberger's board of directors approved a quarterly cash dividend of $0.25 per share.
CEO Olivier Le Peuch said in the conference call:
Our second quarter results continue to demonstrate the strength of our portfolio and our strategic positioning in the most attractive, accretive, and resilient markets globally. This is translating to financial performance, and we closed the first half of the year with solid growth across revenue, earnings per share, free cash flow, and expanded EBITDA and pre-tax segment operating margins.
2 - Investment Thesis
SLB is my preferred company in the oilfield services segment due to its solid reputation and Worldwide expertise.
As I said many times, I find the oilfield services sector generally less rewarding than the E&P industry. Furthermore, companies in this segment offer an unattractive dividend compared to the high volatility attached to the industry.
This highly unpredictable segment can quickly turn from a successful investment to a more non-inspiring one without sufficient time to adapt to the new development.
The industry has turned bullish recently due to a solid oil environment but could quickly reverse course if any signs of weakness start to darken the horizon. The FED is about to raise interest again, which could trigger a selloff in the oil sector. This uncertainty explains why the industry has reached a strong resistance.
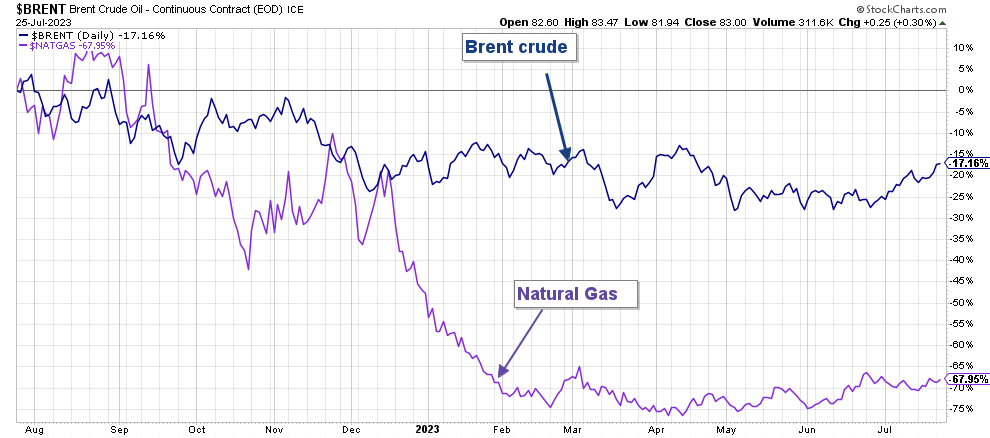
The chart below shows that oil and gas prices dropped significantly YoY.
SLB 1-Year Chart Brent and NG (Fun Trading StockCharts)
Thus, the strategy for such a volatile environment is trading LIFO around a long-term position. Trading 50% of the entire position is the most adapted strategy with cyclical stocks. It protects you from excessive ups and downs and provides an extra gain non-negligible while waiting for a new rebound.
3 - Stock Performance
As shown below, Schlumberger has significantly outperformed Baker Hughes and Halliburton. However, SLB is up 63% on a one-year basis.
3 - 2Q23 Balance Sheet Snapshot: Schlumberger compared to Halliburton and Baker Hughes
As we can see below, SLB revenues are the most significant. I like SLB for its business spread worldwide and its moderate exposure in North America while strongly relying on the Middle East and Europe/Africa.
3.1 - Balance Sheet
| Balance Sheet Comparison 2Q23 |
| SLB |
| HAL |
| BKR |
| Total Revenues $ million |
| 8,099 |
| 5,798 |
| 6,315 |
| Net Income $ million |
| 1,033 |
| 610 |
| 410 |
| EBITDA $ million |
| 1,981 |
| 1,120 |
| 997 |
| EPS diluted $ per share |
| 0.72 |
| 0.68 |
| 0.40 |
| Operating Cash Flow $ million |
| 1,608 |
| 1,052 |
| 858 |
| CapEx $ million |
| 471 |
| 303 |
| 276 |
| Free Cash Flow $ million |
| 1,137 |
| 749 |
| 582 |
| Total Cash $ million |
| 3,194 |
| 2,105 |
| 2,805 |
| Total LT Debt $ million |
| 13,335 |
| 7,931 |
| 6,644 |
| Shares outstanding (Diluted) |
| 1,442 |
| 903 |
| 1,015 |
| Quarterly Dividend per share |
| 0.25 |
| 0.16 |
| 0.19 |
| Dividend Yield in $ per share |
| 1.75% |
| 1.67% |
| 2.13% |
3.2 - Revenues per Region
Halliburton North American revenue is the most significant and brings extra security but more risk exposure due to a lack of diversification.
| Comparison SLB/HAL/BKR |
| SLB ($8,099 billion) |
| HAL ($5,798 million) |
| BKR ($6,315 million) |
| North America |
| 1.746 |
| 2.696 |
| 1.042 |
| Latin America |
| 1.624 |
| 0.994 |
| 0.698 |
| Europe/CIS/Africa |
| 2.031 |
| 0.698 |
| 0.672 |
| Middle East & Asia |
| 2.642 |
| 1.410 |
| 1.465 |
| Other |
| 0.056 |
| 0.000 |
| 2.438 |
| Total |
| 8.099 |
| 5.798 |
| 6.315 |
Note: It isn't easy to compare BKR with HAL and SLB because of the larger revenue classified as other (Industrial & Energy Technology) for BKR that should be distributed to all the regions above.
Schlumberger Financials History Ending 2Q23 Trend And Raw Numbers
| Schlumberger |
| 2Q22 |
| 3Q22 |
| 4Q22 |
| 1Q23 |
| 2Q23 |
| Total Revenues in $ Billion |
| 6.77 |
| 7.48 |
| 7.88 |
| 7.74 |
| 8.10 |
| Net income in $ Million |
| 959 |
| 907 |
| 1,064 |
| 934 |
| 1,033 |
| EBITDA $ Million |
| 1,808 |
| 1,256 |
| 1,539 |
| 1,841 |
| 1,981 |
| EPS diluted in $/share |
| 0.67 |
| 0.63 |
| 0.74 |
| 0.65 |
| 0.72 |
| Cash flow from operating activities in $ Million |
| 408 |
| 1,567 |
| 1,614 |
| 330 |
| 1,608 |
| CapEx in $ Million |
| 320 |
| 382 |
| 669 |
| 410 |
| 471 |
| Free cash flow in $ Million |
| 88 |
| 1,185 |
| 945 |
| -80 |
| 1,137 |
| Total cash $ Billion |
| 2.82 |
| 3.61 |
| 2.89 |
| 2.50 |
| 3.19 |
| Total LT Debt in $ Billion |
| 13.85 |
| 13.35 |
| 13.23 |
| 12.84 |
| 13.34 |
| Dividend per share in $ |
| 0.175 |
| 0.175 |
| 0.25 |
| 0.25 |
| 0.25 |
| Shares Outstanding (Diluted) in Million |
| 1,436 |
| 1,414 |
| 1,440 |
| 1,446 |
| 1,442 |
Source: Company release.
Revenues, Free Cash Flow, And Debt Analysis
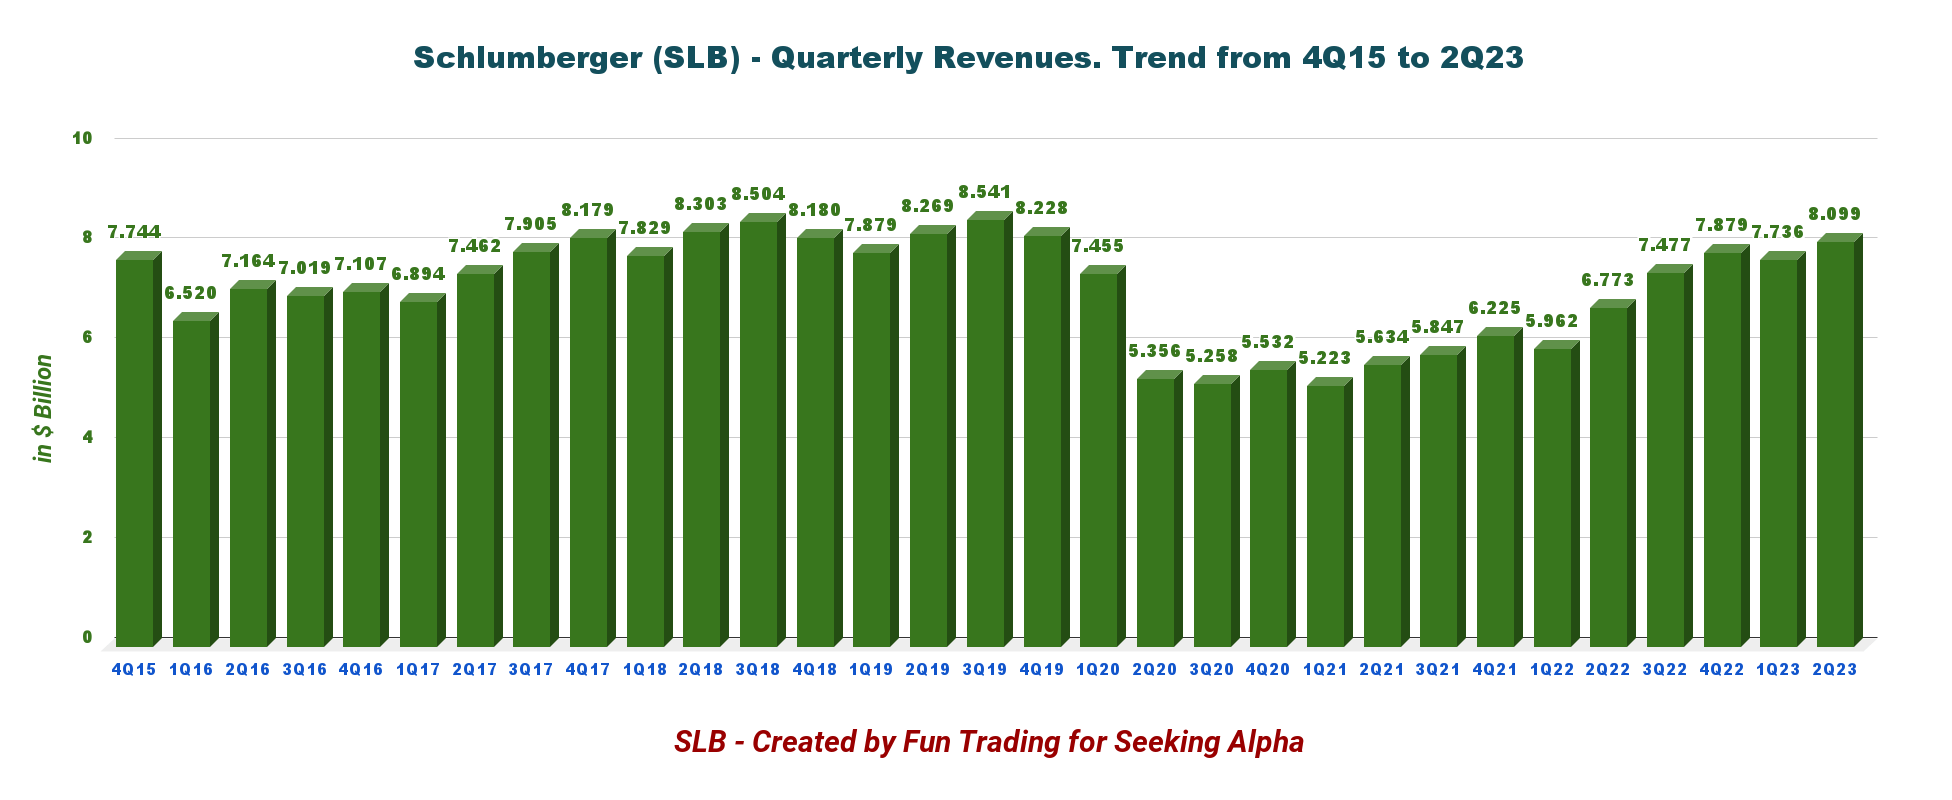
1 - Quarterly Revenues were $8.099 billion at the end of June 2023
SLB Quarterly Revenues History (Fun Trading)
Schlumberger announced revenue of $8.099 billion in 2Q23, or a 19.6% increase YoY, down 4.7% over 2Q22. Net income was $1,033 million or $0.72 per diluted share, compared with $959 million or $0.67 in 2Q22. Revenue increase was mostly driven by the international markets led by the Middle East and Asia.
Adjusted earnings were $0.72 per share, which beat analysts' expectations, and Adjusted EBITDA was $1,962 million.
CFO Stephane Biguet said in the conference call:
Second quarter revenue increased 20% year-on-year as international revenue was up 21%, significantly outpacing North America revenue growth of 14%. The strong international growth was led by the Middle East and Asia and robust offshore activity.
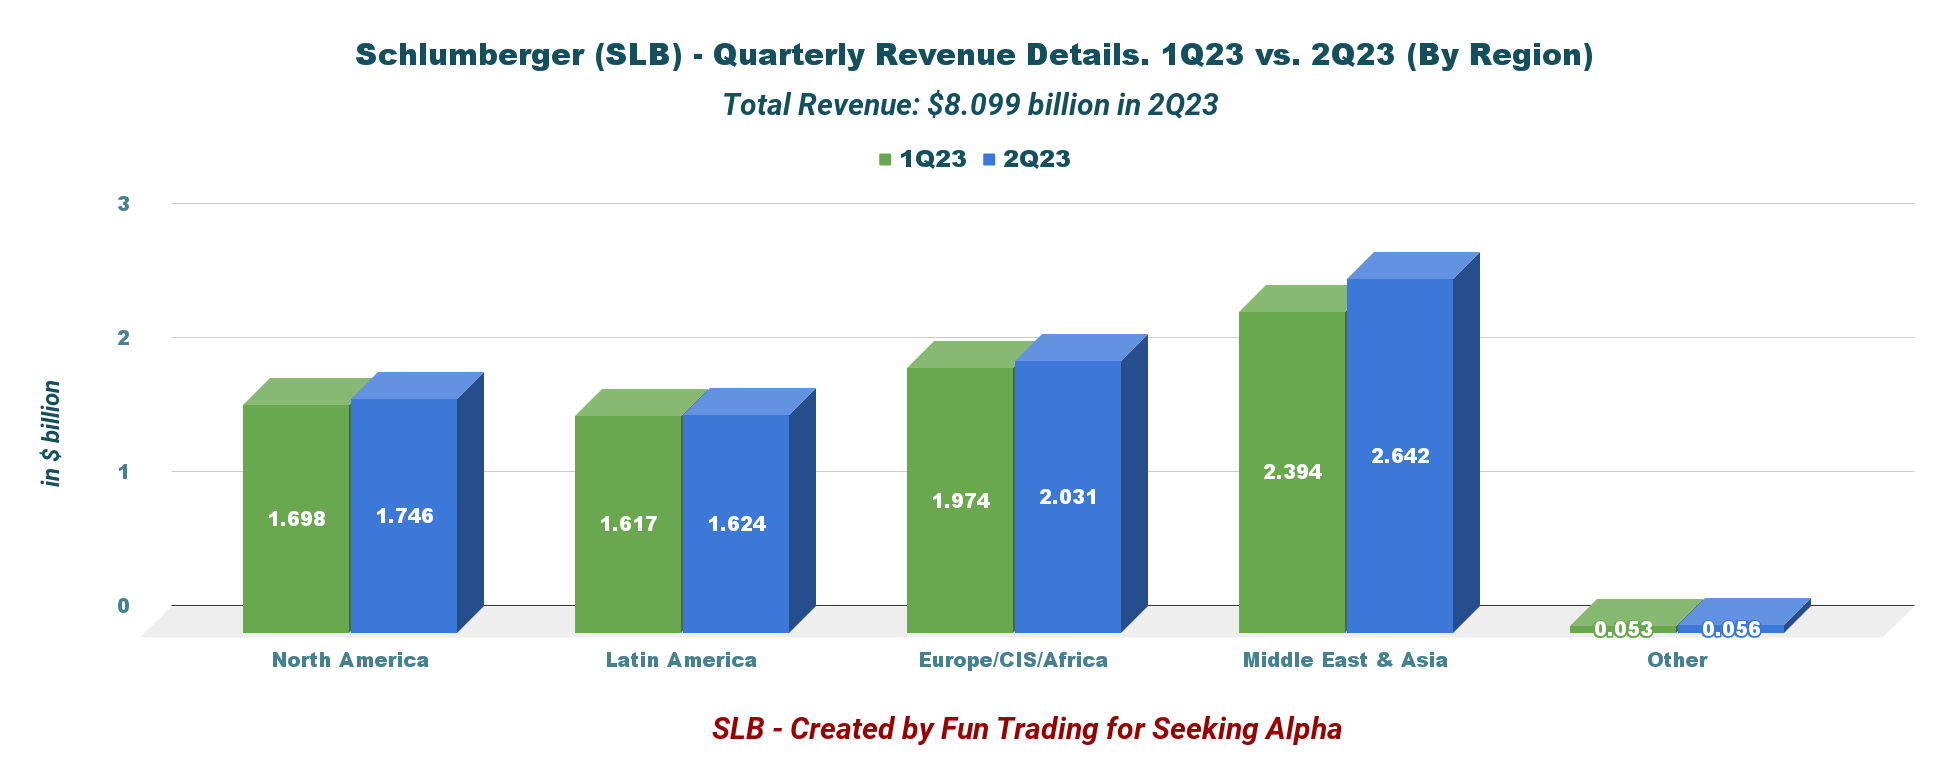
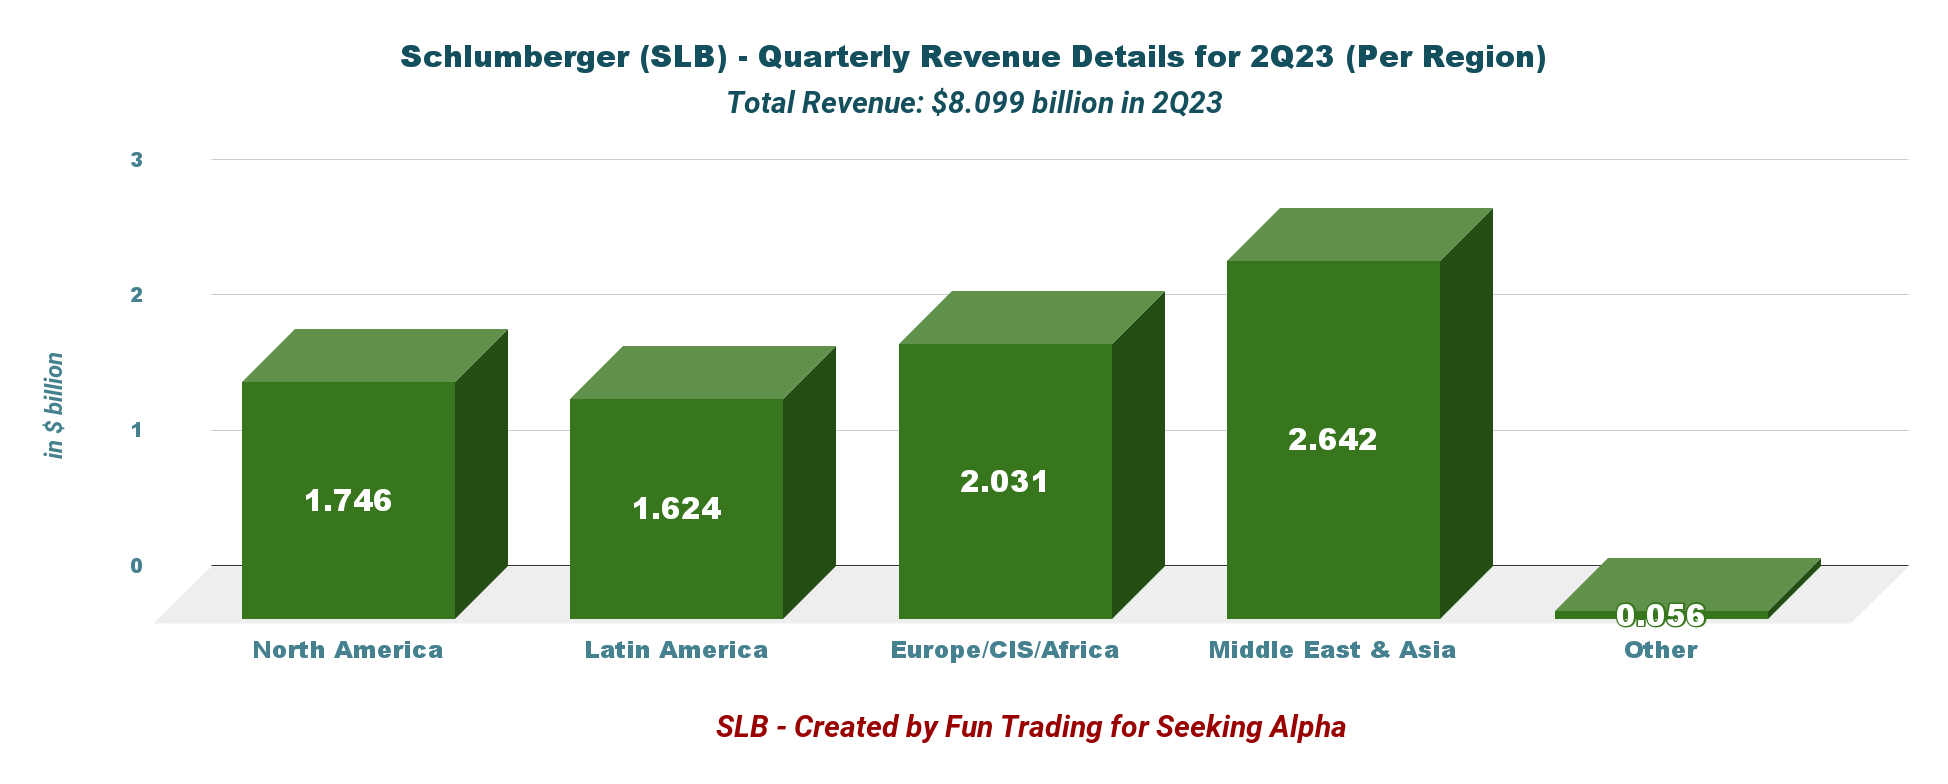
1.1 Revenues per Region
Revenues were significantly higher sequentially, especially for the International business. However, all regions delivered a lower revenue QoQ, excluding North America, as shown below:
SLB Quarterly Revenue details 1Q23 versus 2Q23 (Fun Trading) SLB Quarterly Revenue details per Region in 2Q23 (Fun Trading)
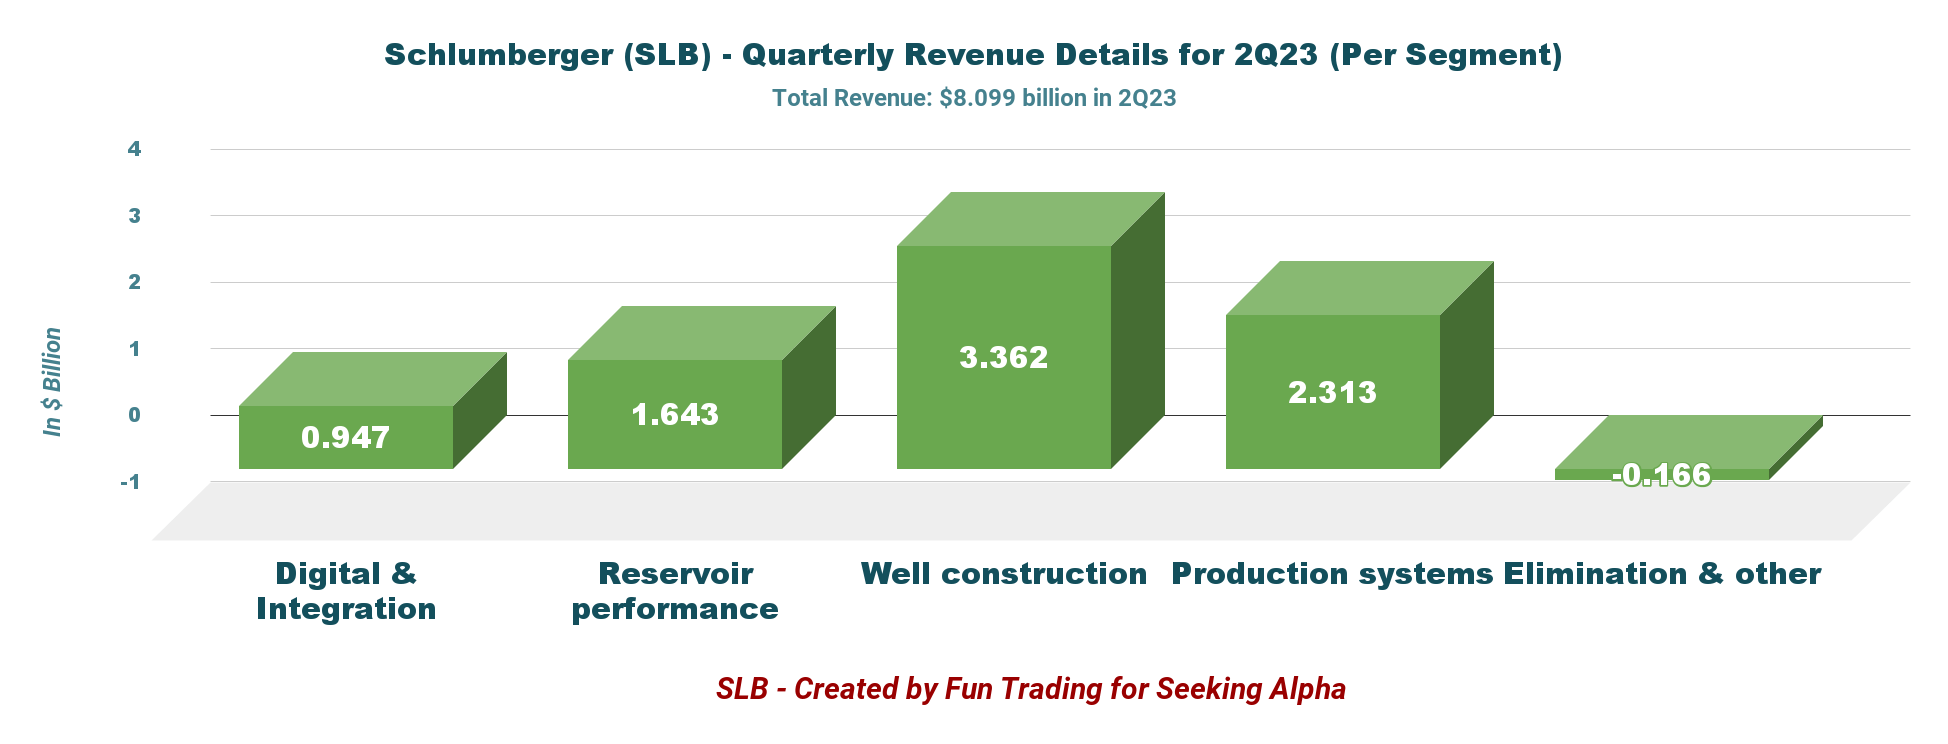
1.2 - Revenue per segment
SLB Revenue per Segment 2Q23 (Fun Trading) As we can see, the Well construction segment is the most influential for the company and represents 41.5% of the company's revenue.
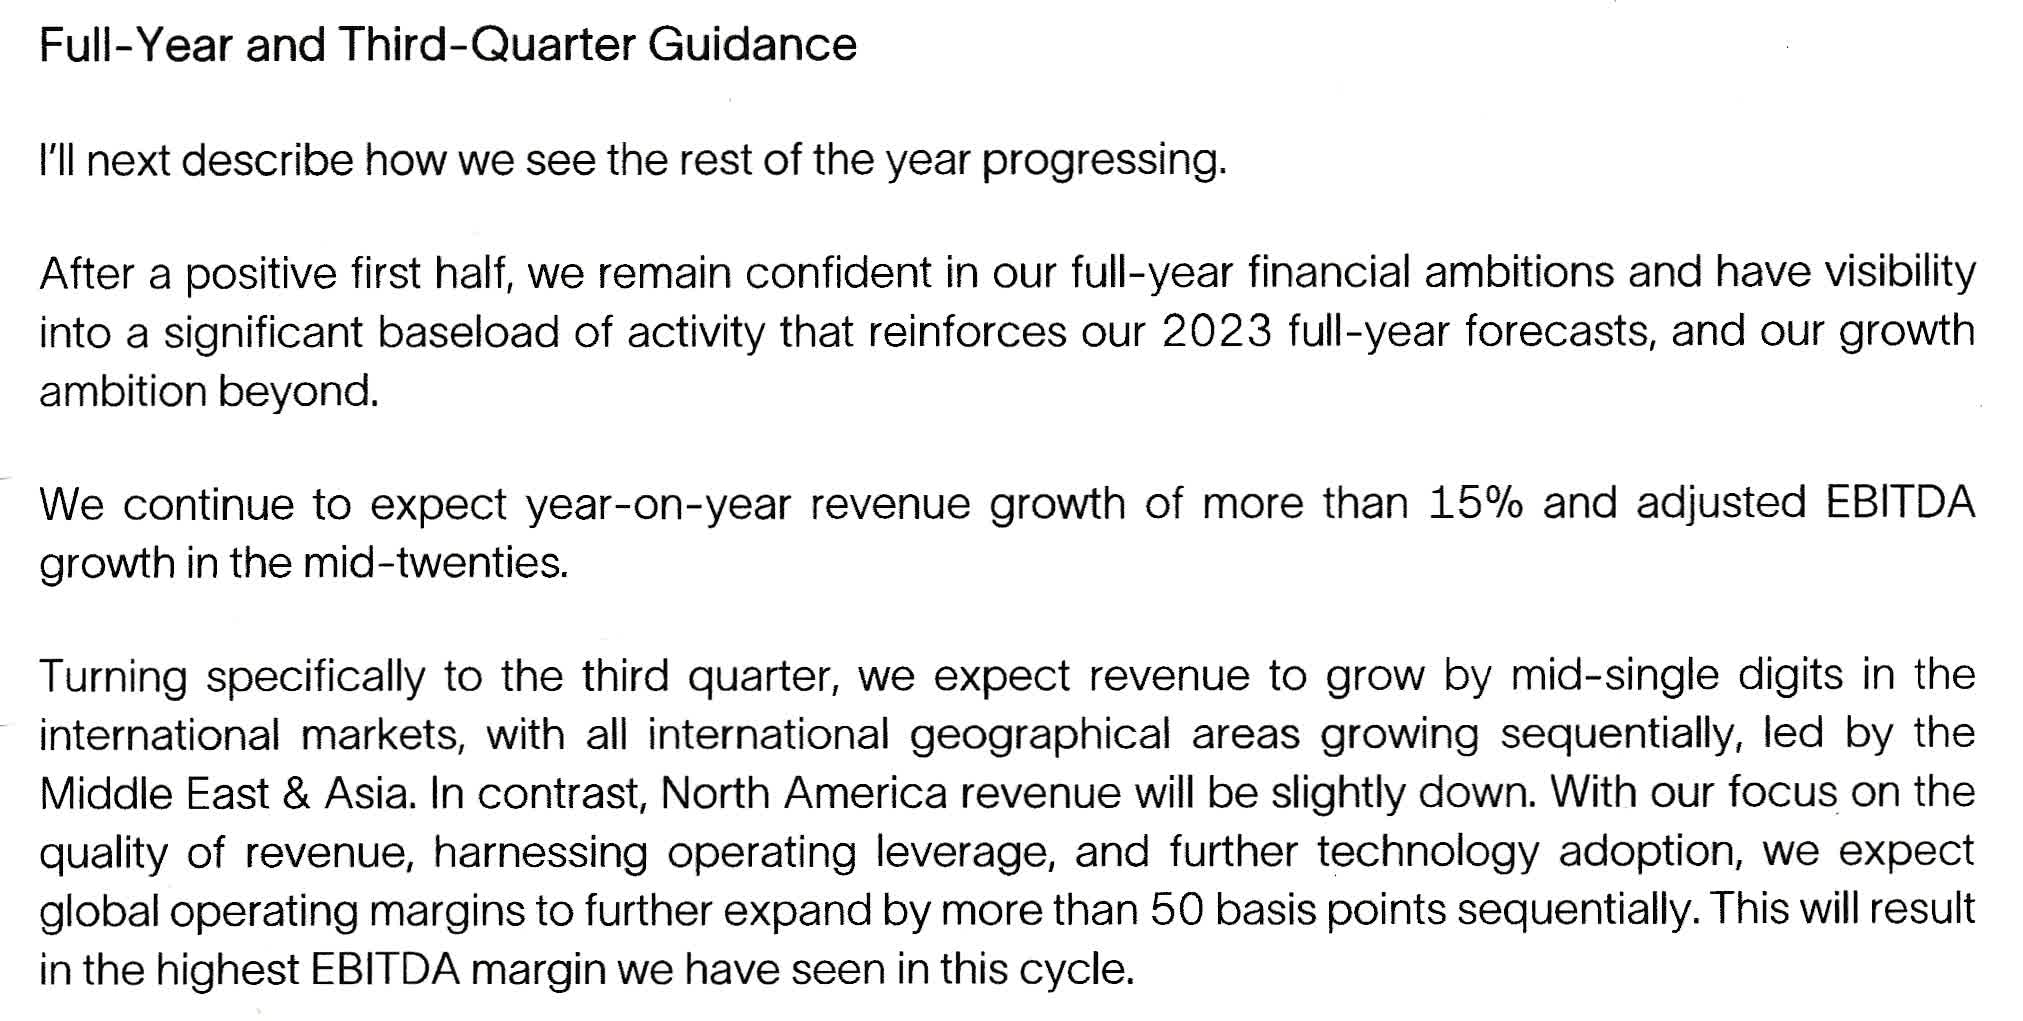
1.3 - 3Q23 and 2023 Outlook
The company is expecting North American revenue to drop slightly in 3Q23. However, the International segment is expected to increase by approximately 5%.
SLB 3Q23 and FY23 Guidance (SLB Press Release)
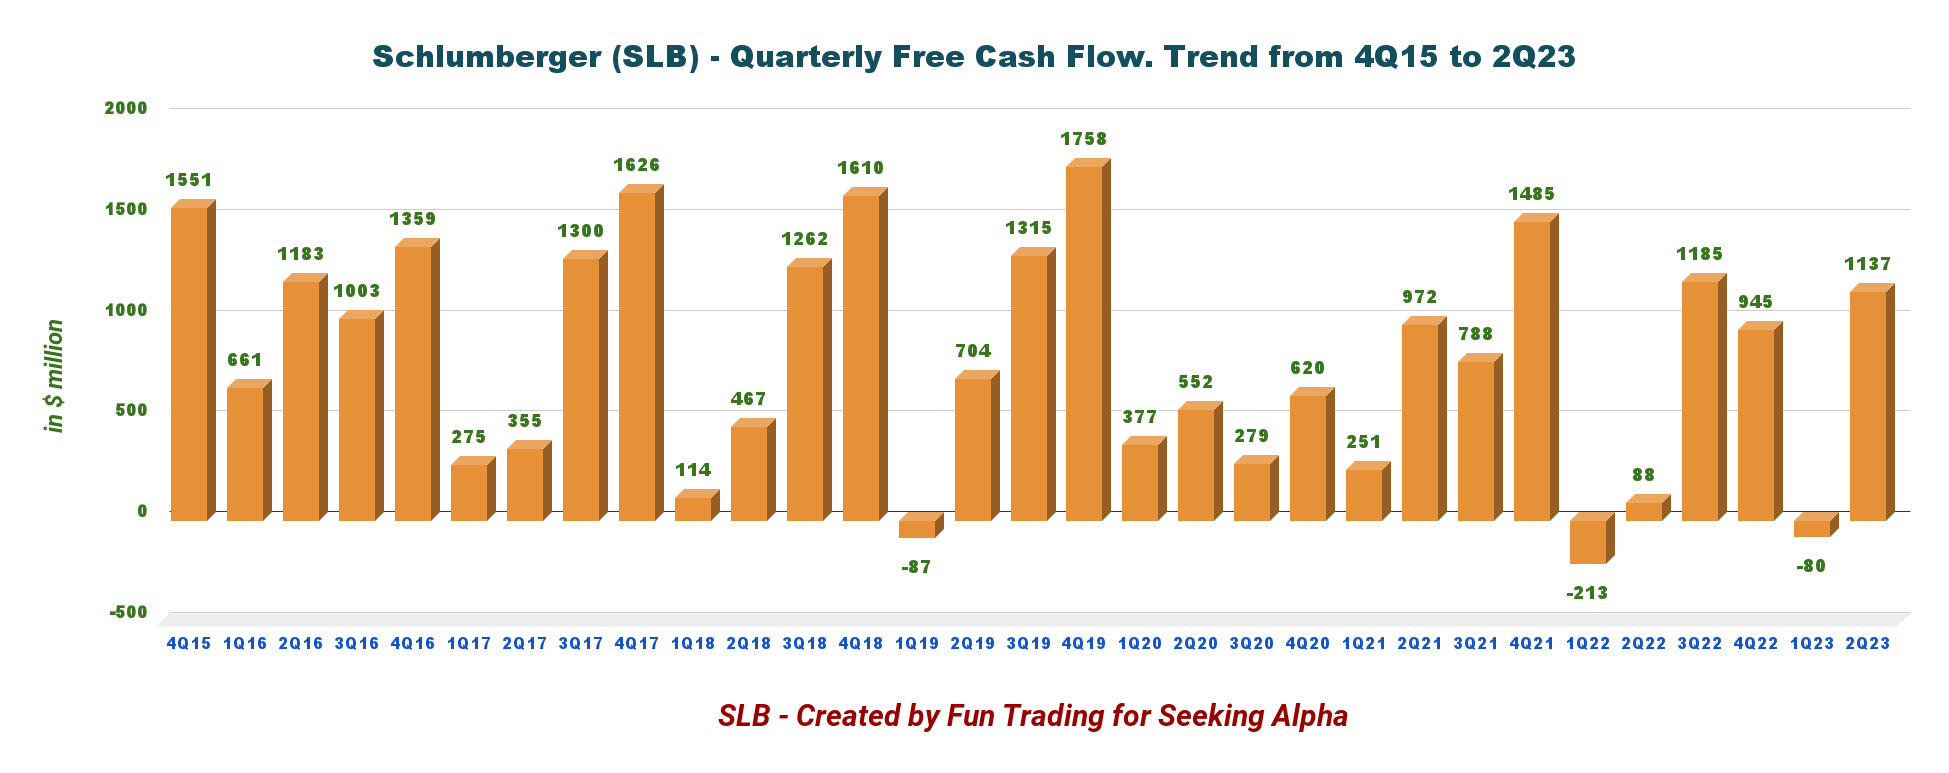
2 - The Free Cash Flow was $1,137 million in 2Q23
SLB Quarterly Free Cash Flow History (Fun Trading)
Note: The generic free cash flow is the cash from operating activities minus CapEx. Schlumberger calculated the FCF differently and indicated $721 million. Schlumberger used a CapEx, including investments in APS projects and multi-client. I used a CapEx of $471 million.
Trailing 12-month free cash flow was $3,187 million, and 2Q23 free cash flow was $1,137 million from $48 million in 2Q22.
Schlumberger's board of directors approved a quarterly cash dividend of $0.25 per share or a dividend yield of 1.75%, which I consider too low.
Also, during the quarter, SLB repurchased approximately 4.5 million shares of its common stock at an average price of $47.33 per share for a total purchase price of $213 million .
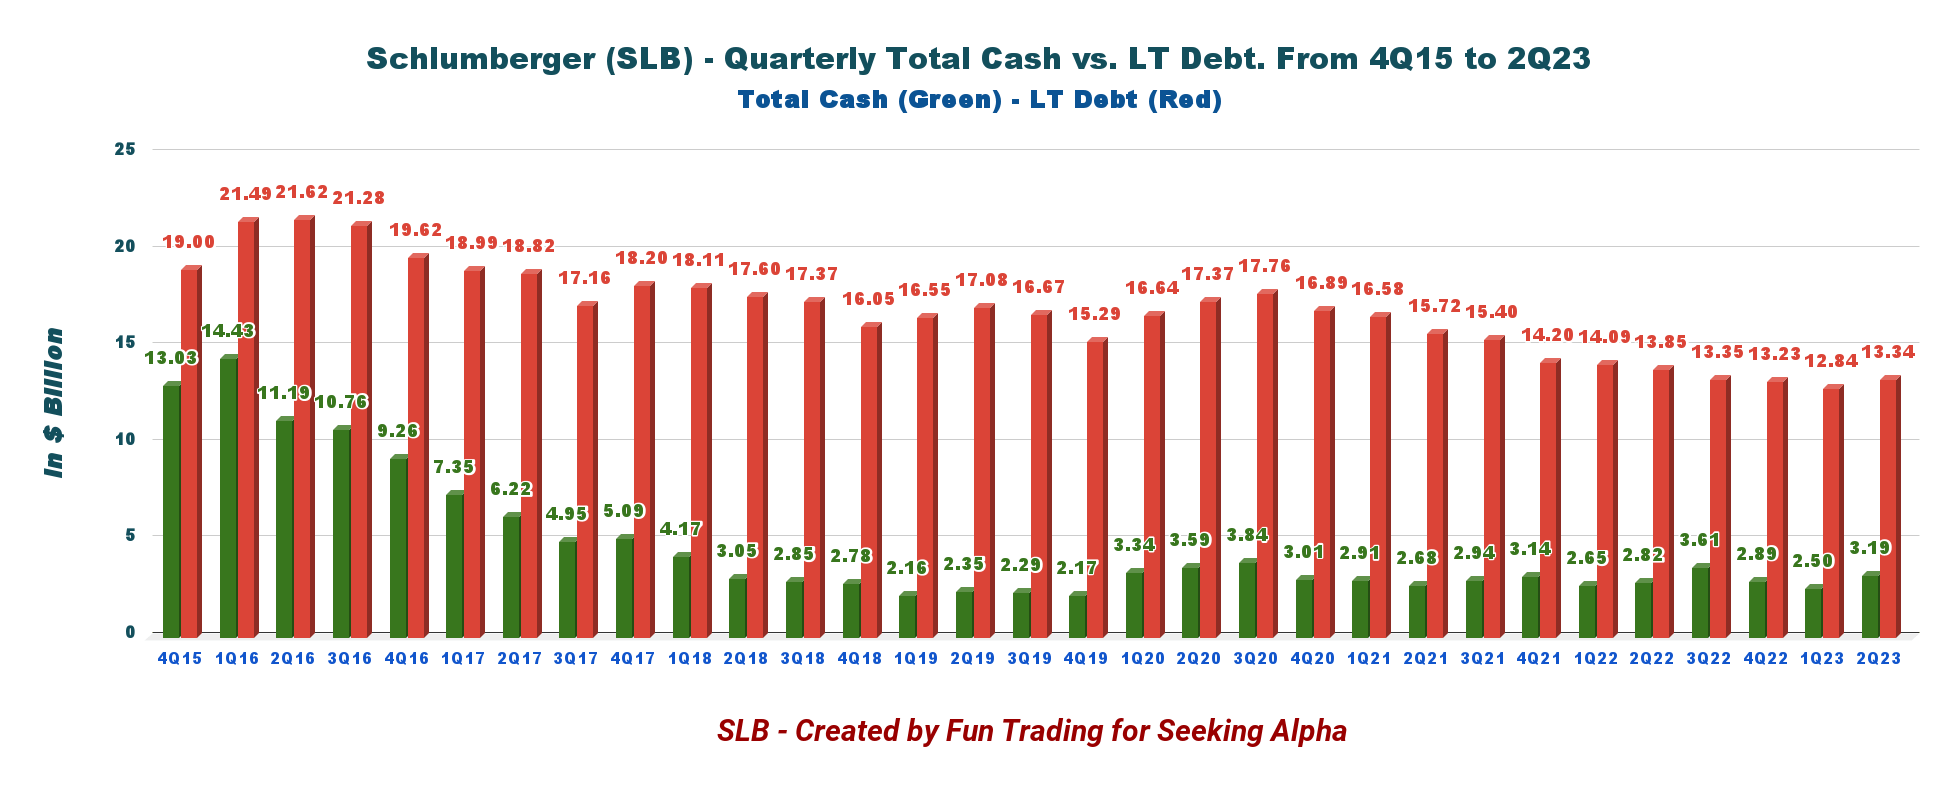
3 - Net Debt increased sequentially to $10.14 billion at the end of June 2023
SLB Quarterly Cash versus Debt History (Fun Trading)
The long-term debt (including current) was $13,335 million at the end of June 2023, down from $13,847 million in 2Q22. Cash was $2,105 million this quarter.
CFO Stephane Biguet said in the conference call:
Our net debt reduced approximately $200 million sequentially to $10.1 billion, which is $900 million lower than the same period last year. Capital investments, inclusive of CapEx and investments in APS projects and exploration data, were $622 million in the second quarter. For the full-year, we are still expecting capital investments to be approximately $2.5 billion to $2.6 billion.
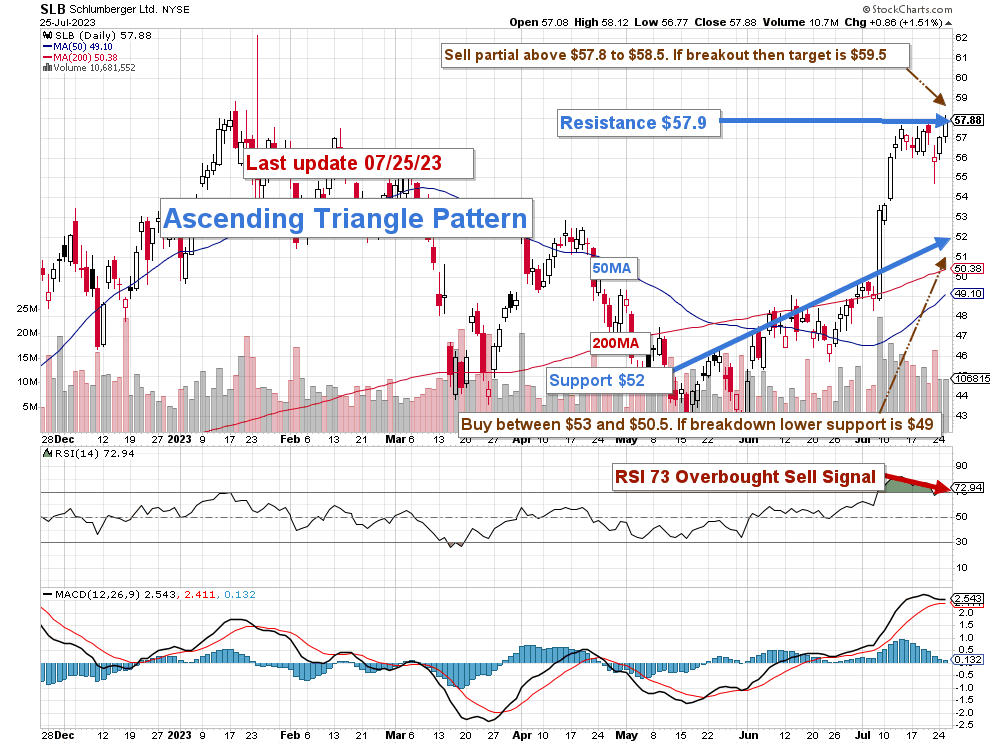
Technical Analysis and Commentary (SLB)
SLB TA Chart Short-Term (Fun Trading StockCharts) Note: The chart has been adjusted for dividends.
SLB forms an ascending triangle pattern, with resistance at $57.9 and support at $52 . RSI is 73 and signals an overbought situation, suggesting it is time to sell a portion of your position.
The ascending triangle, often referred to as the 'rising triangle', is one of the top continuation patterns that appears mid-trend. Traders anticipate the market to continue in the direction of the larger trend and develop trading setups accordingly.
As I said in my investment thesis, I suggest trading short-term LIFO for about 50% of your position. I recommend selling partially between $57.8 and $58.5 with a possible higher resistance at $59.5 in case of solid momentum.
Conversely, it is reasonable to accumulate when the stock experiences weakness between $53 and $50.5, with lower support possible at $49.
Trading LIFO is an excellent way of trading your long core position. It means that you are selling first your recent purchases and keeping your older position for a higher level. It will reward you with a much higher profit while reducing risk significantly.
Warning: The TA chart must be updated frequently to be relevant. It is what I am doing in my stock tracker. The chart above has a possible validity of about a week. Remember, the TA chart is a tool only to help you adopt the right strategy. It is not a way to foresee the future. No one and nothing can.
For further details see:
Schlumberger: Time To Take Some Profit Off