SPY - SDS: Added To Our Model Portfolio (Technical Analysis)
2023-05-12 07:11:35 ET
Summary
- This is a technical analysis article. As the debt ceiling game plays out, we think the market goes down, so we have used excess cash in our Model Portfolio to swing trade using the SDS.
- As you know, the SDS goes up when the SPY goes down. We think the sell signal on the Point & Figure chart below means the SPY is going down.
- Besides the debt ceiling, we see the banking crisis and the Fed holding rates high, for longer, as additional forces depressing an already depressed market.
- We think the good news is over on the earnings front, at least for the mega caps that move the SPY.
- It is also “sell in May and go away” time. The market is ignoring the Fed, high-interest rates, Ukraine, and Taiwan. That will change.
As the SPDR S&P 500 ETF ( SPY ) goes down, the ProShares UltraShort S&P 500 ( SDS ) goes up. We use excess cash in the Model Portfolio to swing trade a falling market by adding the SDS. As you can see on the chart below, we expect the market to fall because there is a Sell Signal on the SPY chart and a Buy Signal on the SDS chart.
The negative factors pounding the market down:
1) Continued high interest rates by the Fed. This policy lacks traction short term, but longer term it will bring the economy down and increase unemployment. It will bring on a recession.
2) End of the earnings season, with the good news over for the mega caps that rule the SPY. The technology stocks have had a nice technical bounce off the bottom, but a recession will force many to revisit that bottom. No growth means lower prices for stocks and lower PEs. Overvalued stocks go down in a recession.
3) Inflation continues to drop slightly, while the inflation rate remains very high, forcing the Fed to keep interest rates high for longer. Compared to former Fed Chairman Volcker, 5% interest rates are nowhere near the top of the range. But Powell will not do a Volcker.
4) The banking crisis continues. There will be more failing banks and each one will make headlines. I worked for a bank and they are not the smartest people in the room. They really do need to be supervised by regulators and somehow that supervision just failed.
5) The debt ceiling crisis results in default. The market thinks that it is possible that the government will default. I don't think even politicians would be that dumb. No matter, I still think the threat takes the market down short term. So we are using excess cash in our Model Portfolio for a swing trade using the SDS. We will close the position before the debt ceiling is raised.
6) It is "Sell in May and go away" time the market as we start the worst six months in the market according to the "Stock Trader's Almanac" which I use every day. Portfolio managers are set for this year, except for selling stocks when earnings blowup or the market crashes and there are redemptions. A hard landing recession will do the same.
The positive factors keeping the market up:
1) The economy is still good. The MEME attitude for the October bounce is to enjoy the great economy until you see the end coming. The market is still using rose colored glasses, enjoying the good economy, consumer spending and the lack of traction by high interest rates. The high interest rates are not working because of the hot jobs market. This October bounce in a bear market still does not see a recession coming. When it does, it will drop to the bottom again.
2) Consumers spending and traveling despite increases in prices. When the consumer has a job and plenty of money to spend, it can overlook the higher prices.
3) The hot jobs market is creating low unemployment. The hallmark of a recession is increasing unemployment. Instead we have a hot jobs market and pay increases making the consumer "fat and happy." The politicians want to keep it that way to get re-elected.
4) The market does not see a recession coming, yet. When it does, it will drop like a building being demolished. The market will not drop until it has a reality check like increased unemployment, falling corporate earnings or an exogenous factor like an expanding war or new war. Failure to increase the debt ceiling would do the same.
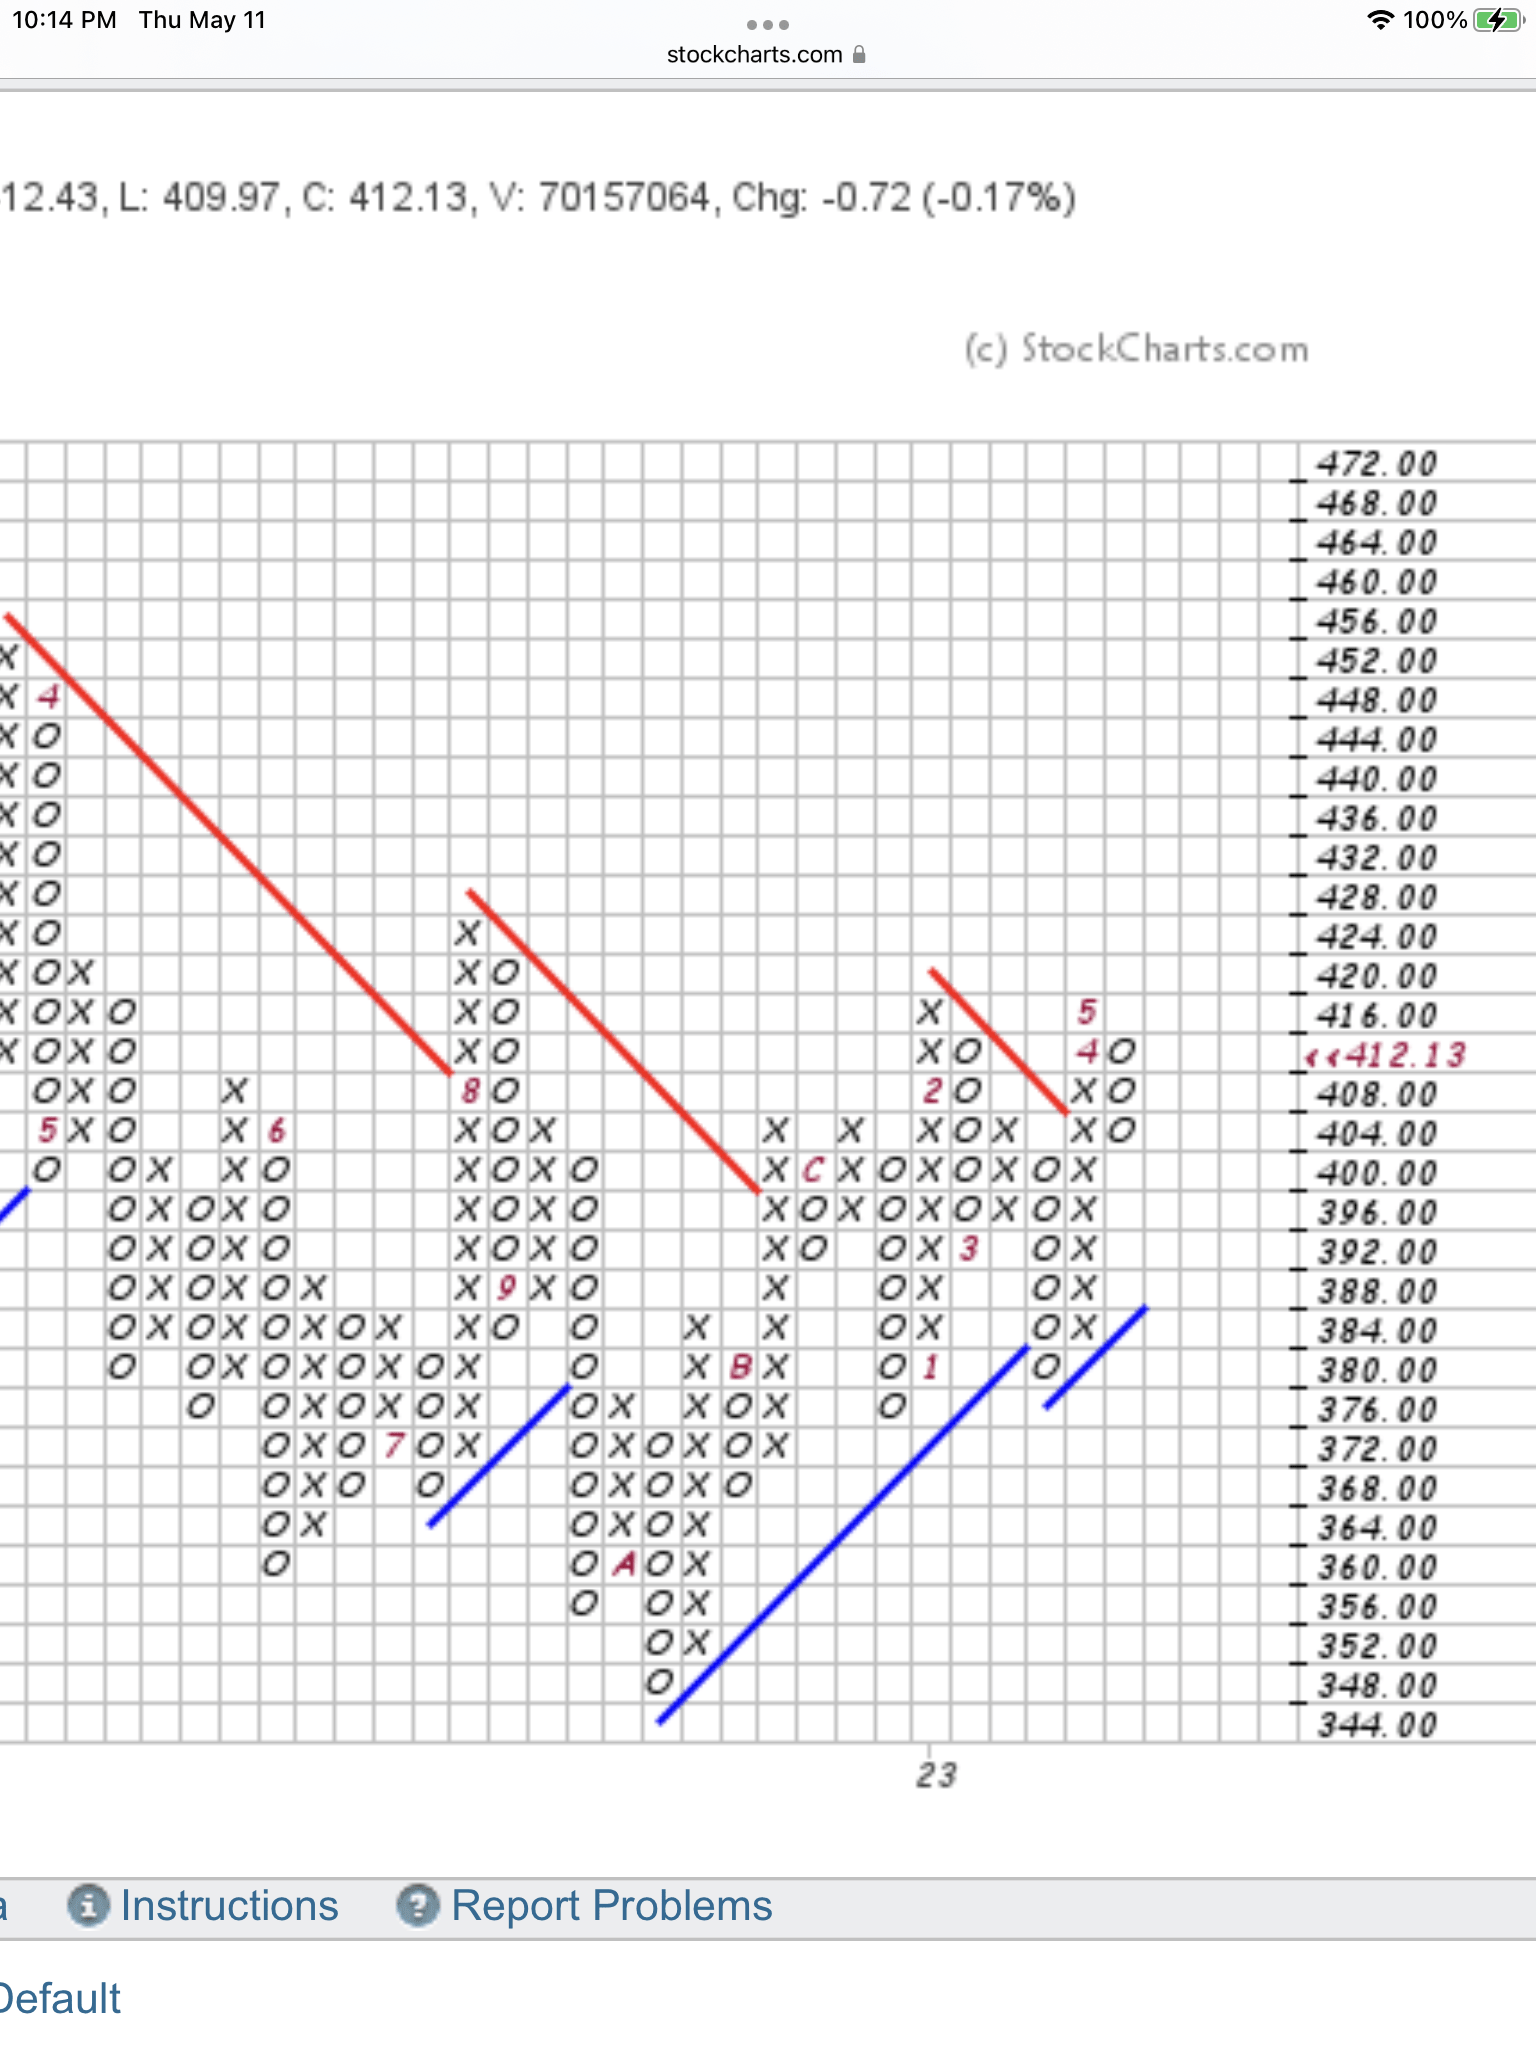
Here is our Point & Figure chart for the SPY. On the far right is a column of dropping "Os" created by the recent drop in prices. This is the Sell Signal that is driving our decision to add SDS to the Model Portfolio using excess cash for swing trades. Notice the bearish double top created by the two columns of "Xs" at $416. (The 4 and 5 stand for April and May but are really Xs.)
SPY Sell Signal Column of "Os" Falling Because Price Dropped. (StockCharts.com)
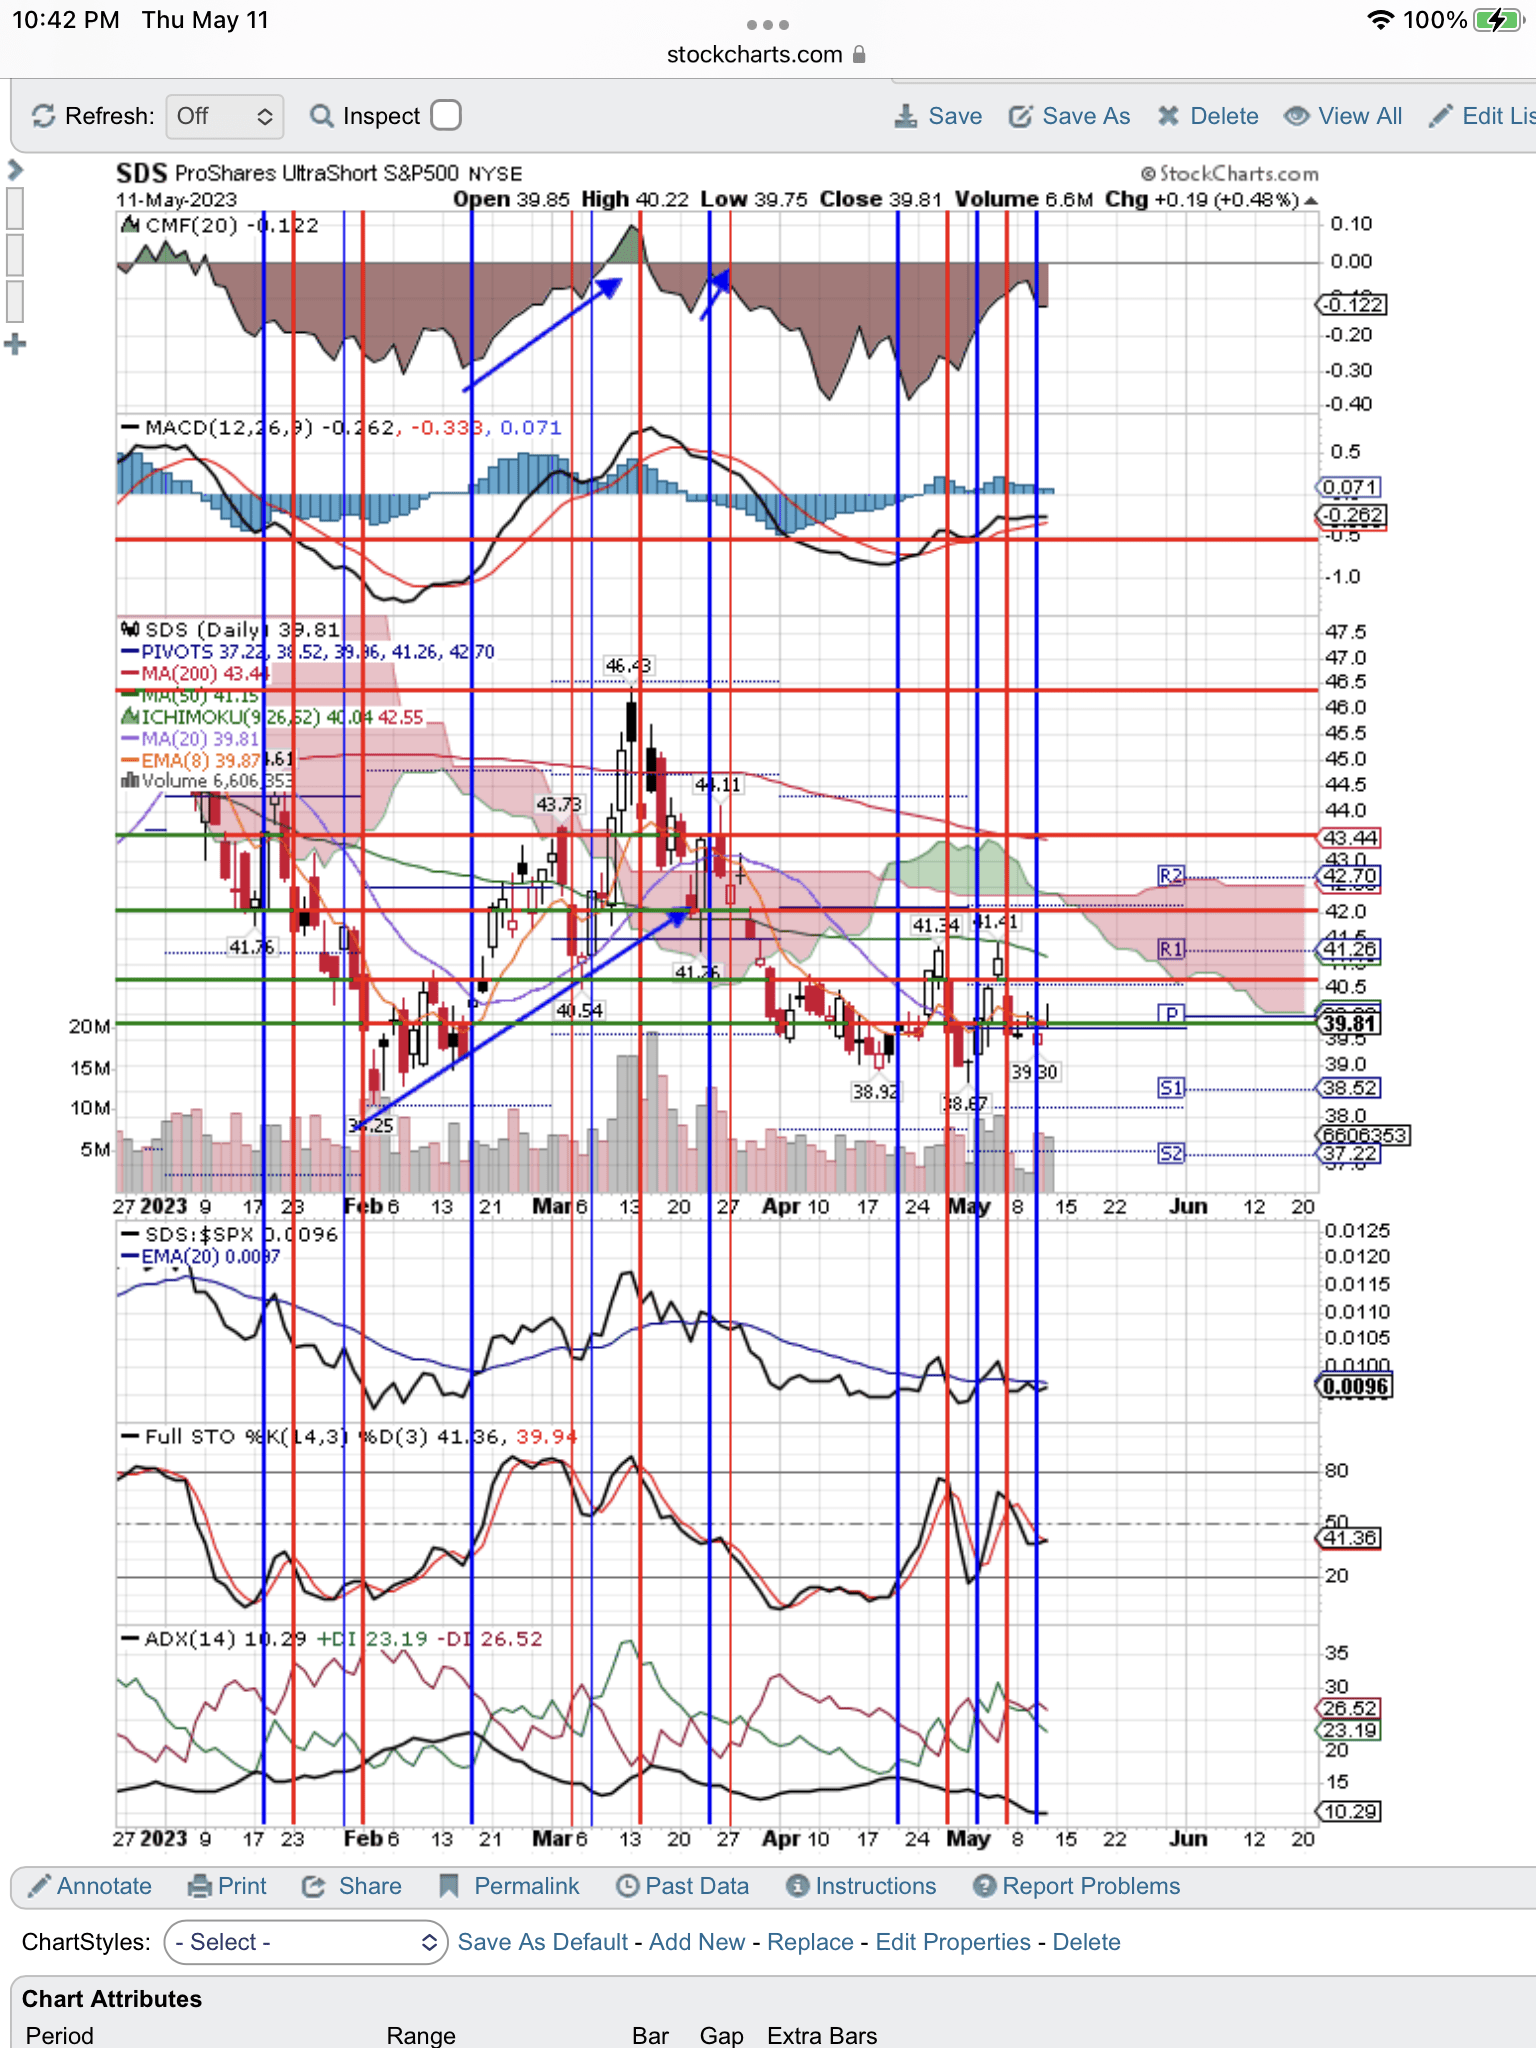
As a result in the SPY dropping, we expect the SDS to go up. Price has started rising and we have drawn a blue, vertical line, Buy Signal on the chart. Here is our daily SDS chart:
For further details see:
SDS: Added To Our Model Portfolio (Technical Analysis)