SPY - SFY: Boring Is Beautiful; Stick With SPY And QQQ Instead
2023-11-05 23:54:14 ET
Summary
- SoFi Select 500 ETF offers exposure to the 500 largest US companies without a management fee, but the fee waiver will end in June 2024.
- SFY's proprietary weighting methodology does not add value, as it has underperformed market ETFs like SPY.
- Investors should consider other ETFs such as SPY or QQQ, which have better risk-adjusted returns and lower fees once the fee waiver period ends.
What if I told you there is an exchange-traded fund ("ETF") that gives you exposure to the 500 largest companies in the U.S. and it doesn't charge a management fee? That sounds like a great deal, right?
I was intrigued by the SoFi Select 500 ETF's ( SFY ) unique value proposition of being 'free'. However, after digging a little deeper, I must say there is no reason to recommend the SFY ETF.
First, the 'free' period only lasts until June 2024, at which time the SFY ETF will begin to collect a 0.19% management fee, multiples of what other low-cost ETFs charge.
Furthermore, historical performance of the SFY ETF does not suggest its proprietary weighting methodology adds any value. Overall, I recommend most investors should stick with the boring SPY and QQQ ETFs.
Fund Overview
The SoFi Select 500 ETF is a passive ETF that provides exposure to the largest 500 companies in the U.S. measured by market capitalization with a growth-oriented tilt.
The SFY ETF tracks the performance of the Solactive SoFi US 500 Growth Index ("Index"), an index that measures the returns of the 500 largest companies in the U.S. with index weights modified with a proprietary composite score calculated based on three growth-oriented fundamental factors: trailing 12-month sales growth, trailing 12-month earnings per share ("EPS") growth, and 12-month forward-looking EPS growth consensus estimates. Companies that score well will receive a higher weight, while companies that score poorly will receive a lower index weight.
The index is rebalanced and reconstituted annually in May.
As of November 3rd, 2023, the SFY ETF has $518 million in assets (Figure 1). The asset manager has waived the fund's 0.19% management fee until June 2024.
Portfolio Holdings
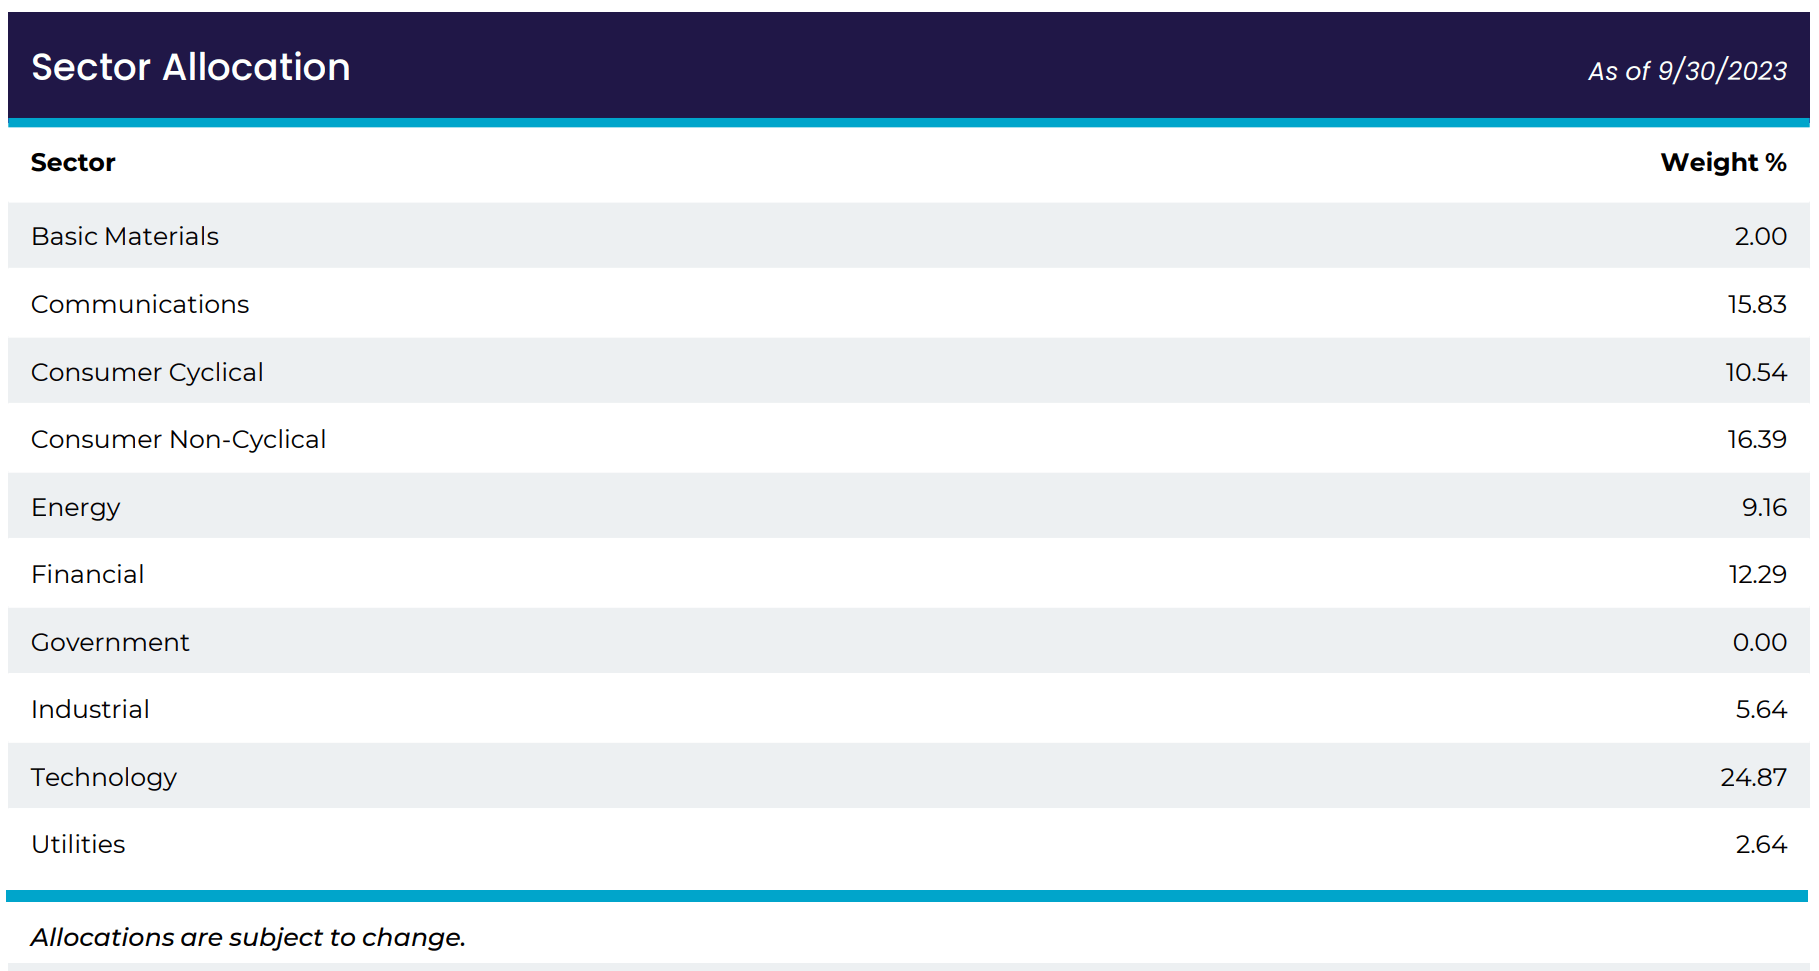
The SFY ETF's sector allocation is shown in Figure 2. The largest sector weights are Technology (24.9%), Consumer Non-Cyclicals (16.4%), Communications (15.8%), Financials (12.3%), and Consumer Cyclicals (10.5%).
Since SoFi's sector definition is different from industry standards (for example, SFY does not show portfolio weight in Health Care stocks), it is hard to analyze SFY's sector allocations at first glance.
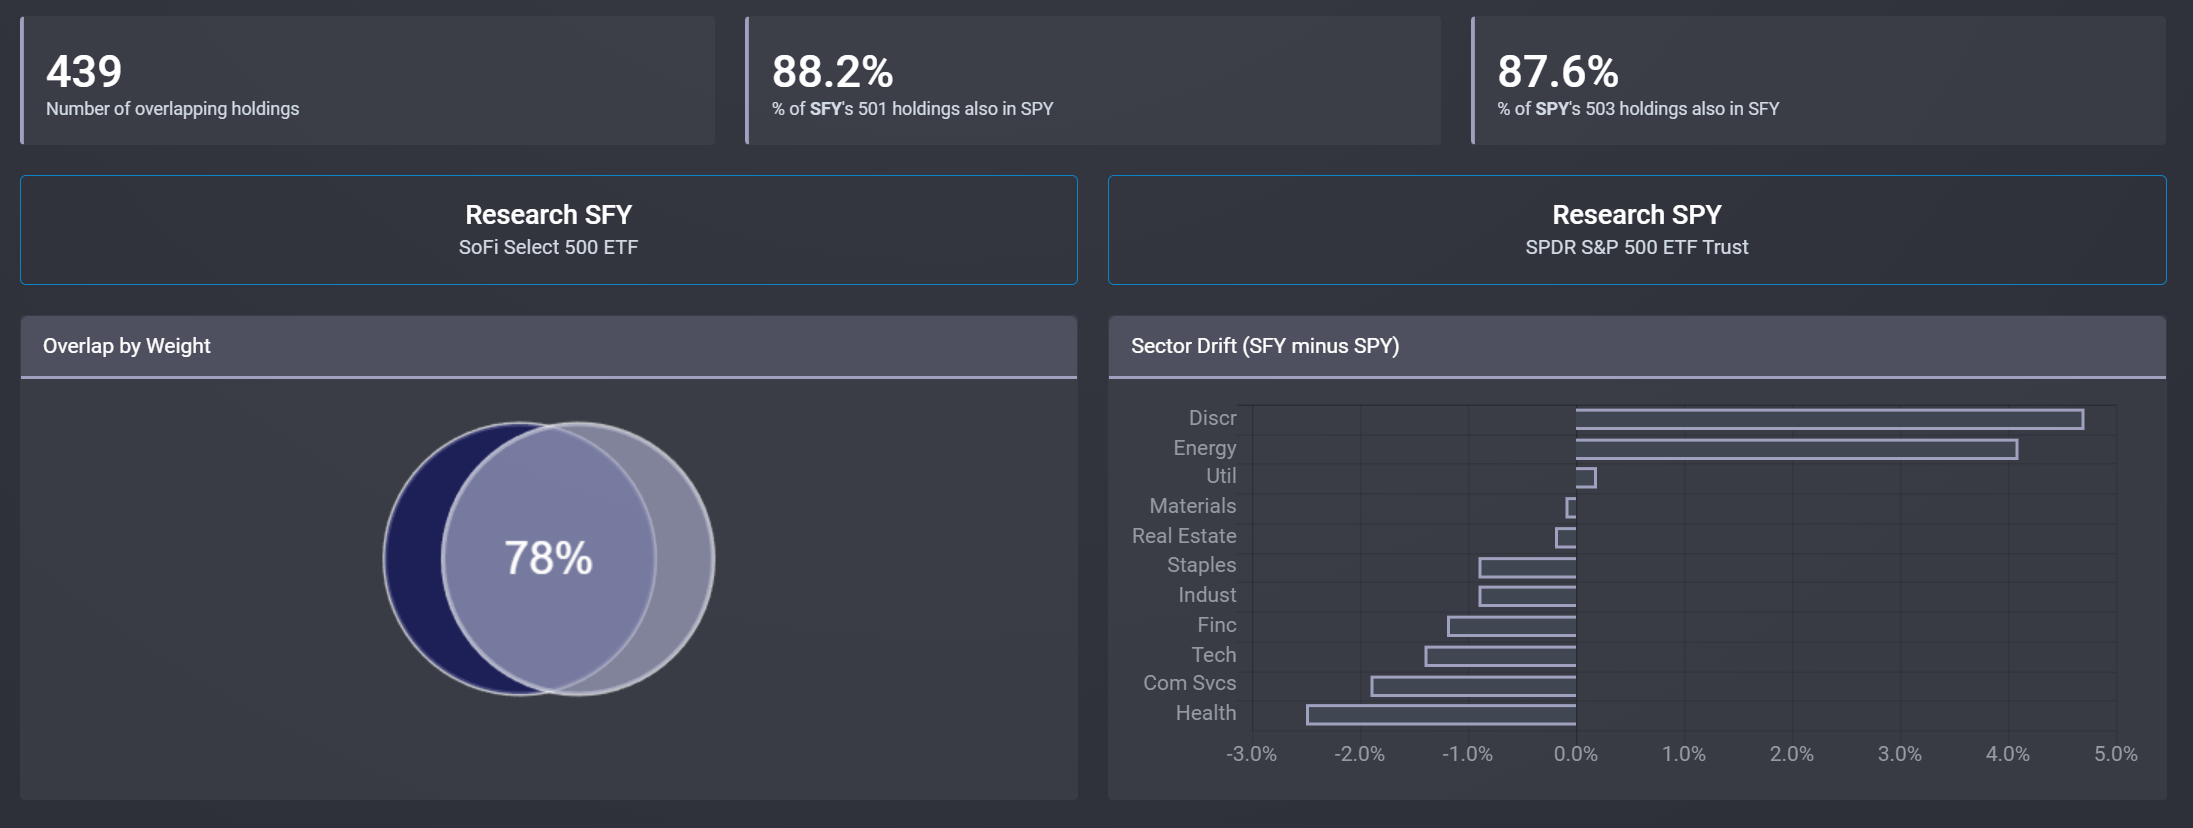
However, using ETF Research Center's overlap tool , we see that there is an 88% overlap in holdings between the SFY ETF and the SPDR S&P 500 ETF Trust ( SPY ) (Figure 3). By position weight, there is a 78% overlap.
Relative to the SPY ETF, the SFY ETF is overweight Consumer Discretionary and Energy and underweight Health Care, Communication Services, Technology, Financials, and Industrials.
SFY's top 10 holdings constitute 29.6% of the portfolio and are shown in Figure 4).
The notable difference between the SFY ETF and the SPY ETF's top 10 holdings, shown in Figure 5, is the near doubling of Amazon's index weight from 3.5% in the SPY ETF to 6.9% in SFY. SFY also has a much larger weight in TSLA (3.3% vs. 1.7%).
Returns
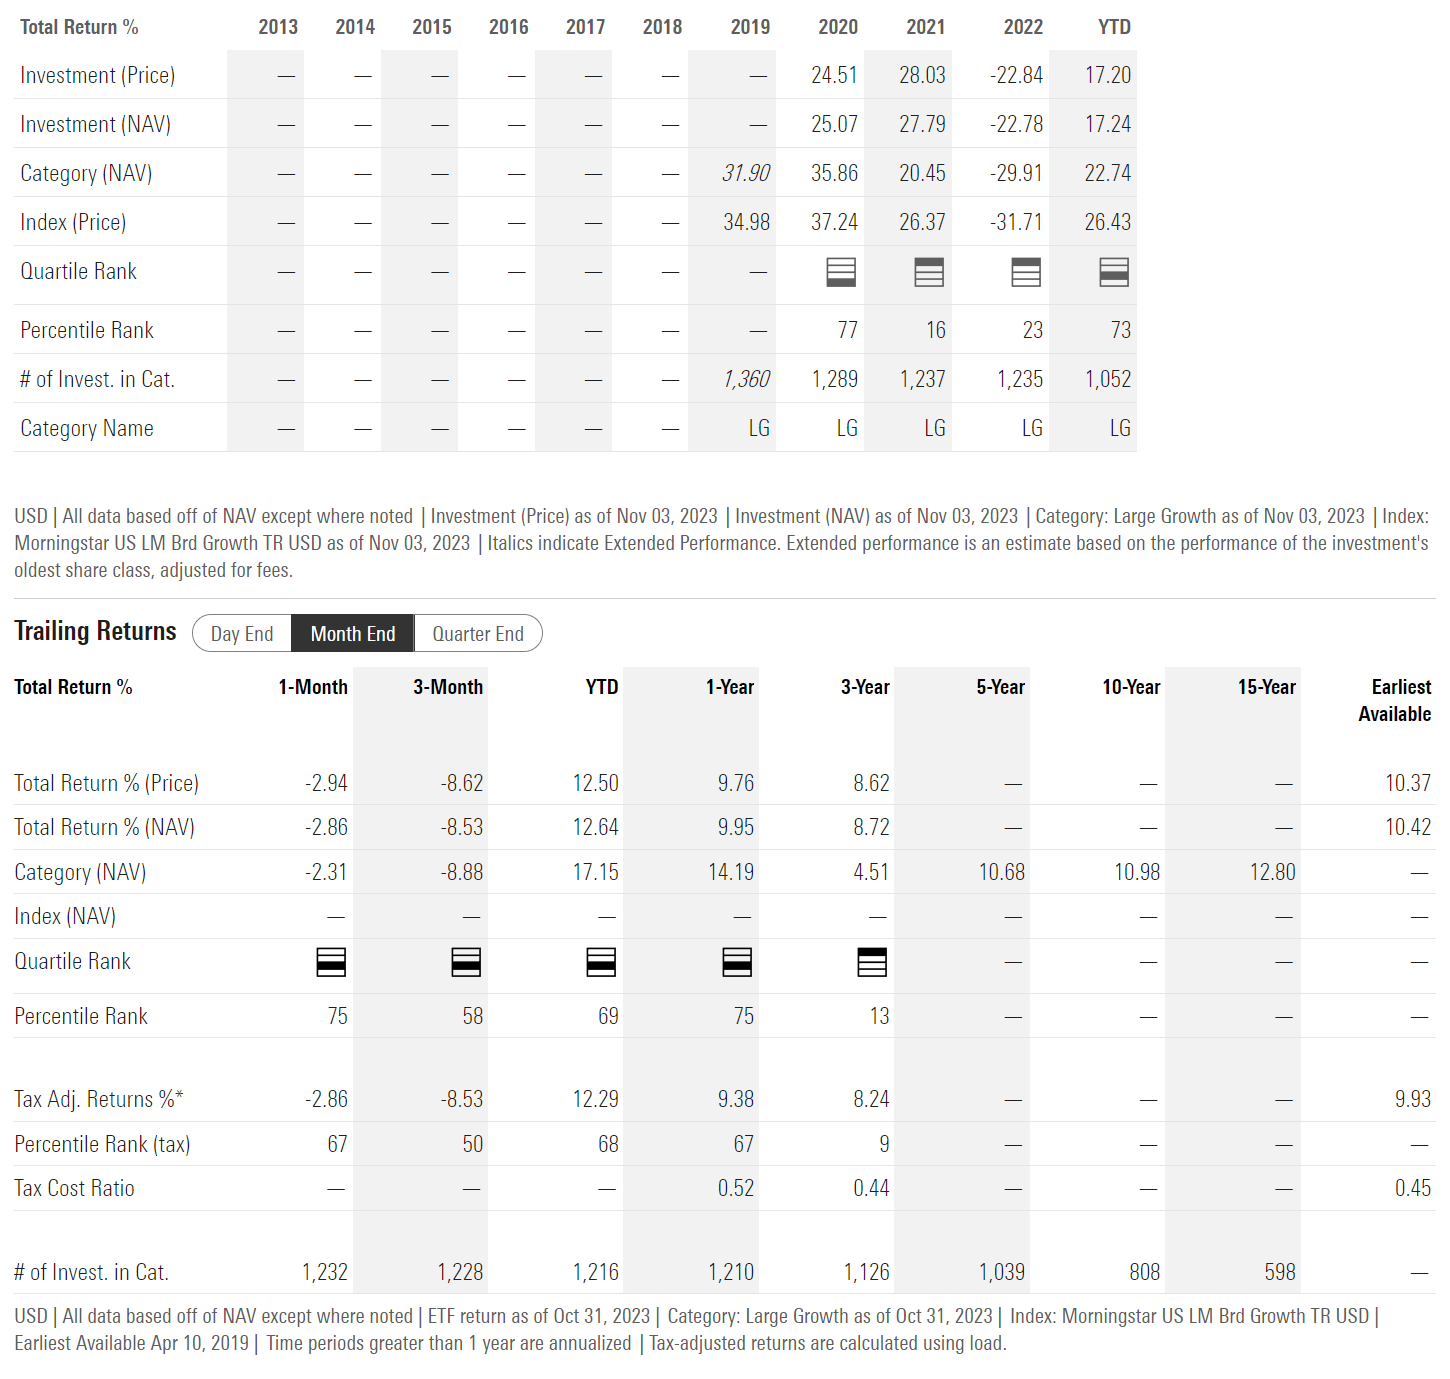
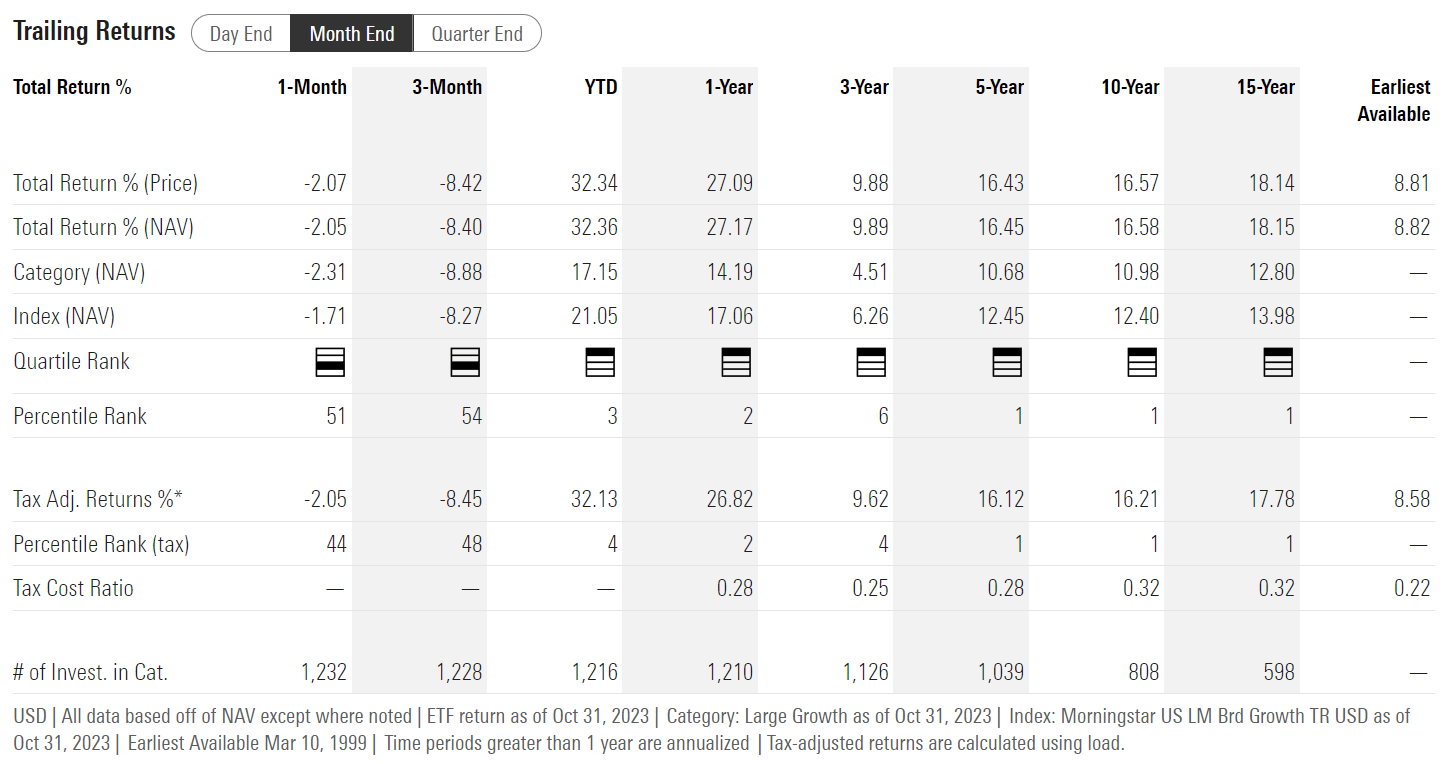
The SFY ETF has delivered solid historical returns, with 1- and 3-year average annual returns of 10.0% and 8.7% respectively to October 31, 2023 (Figure 6).
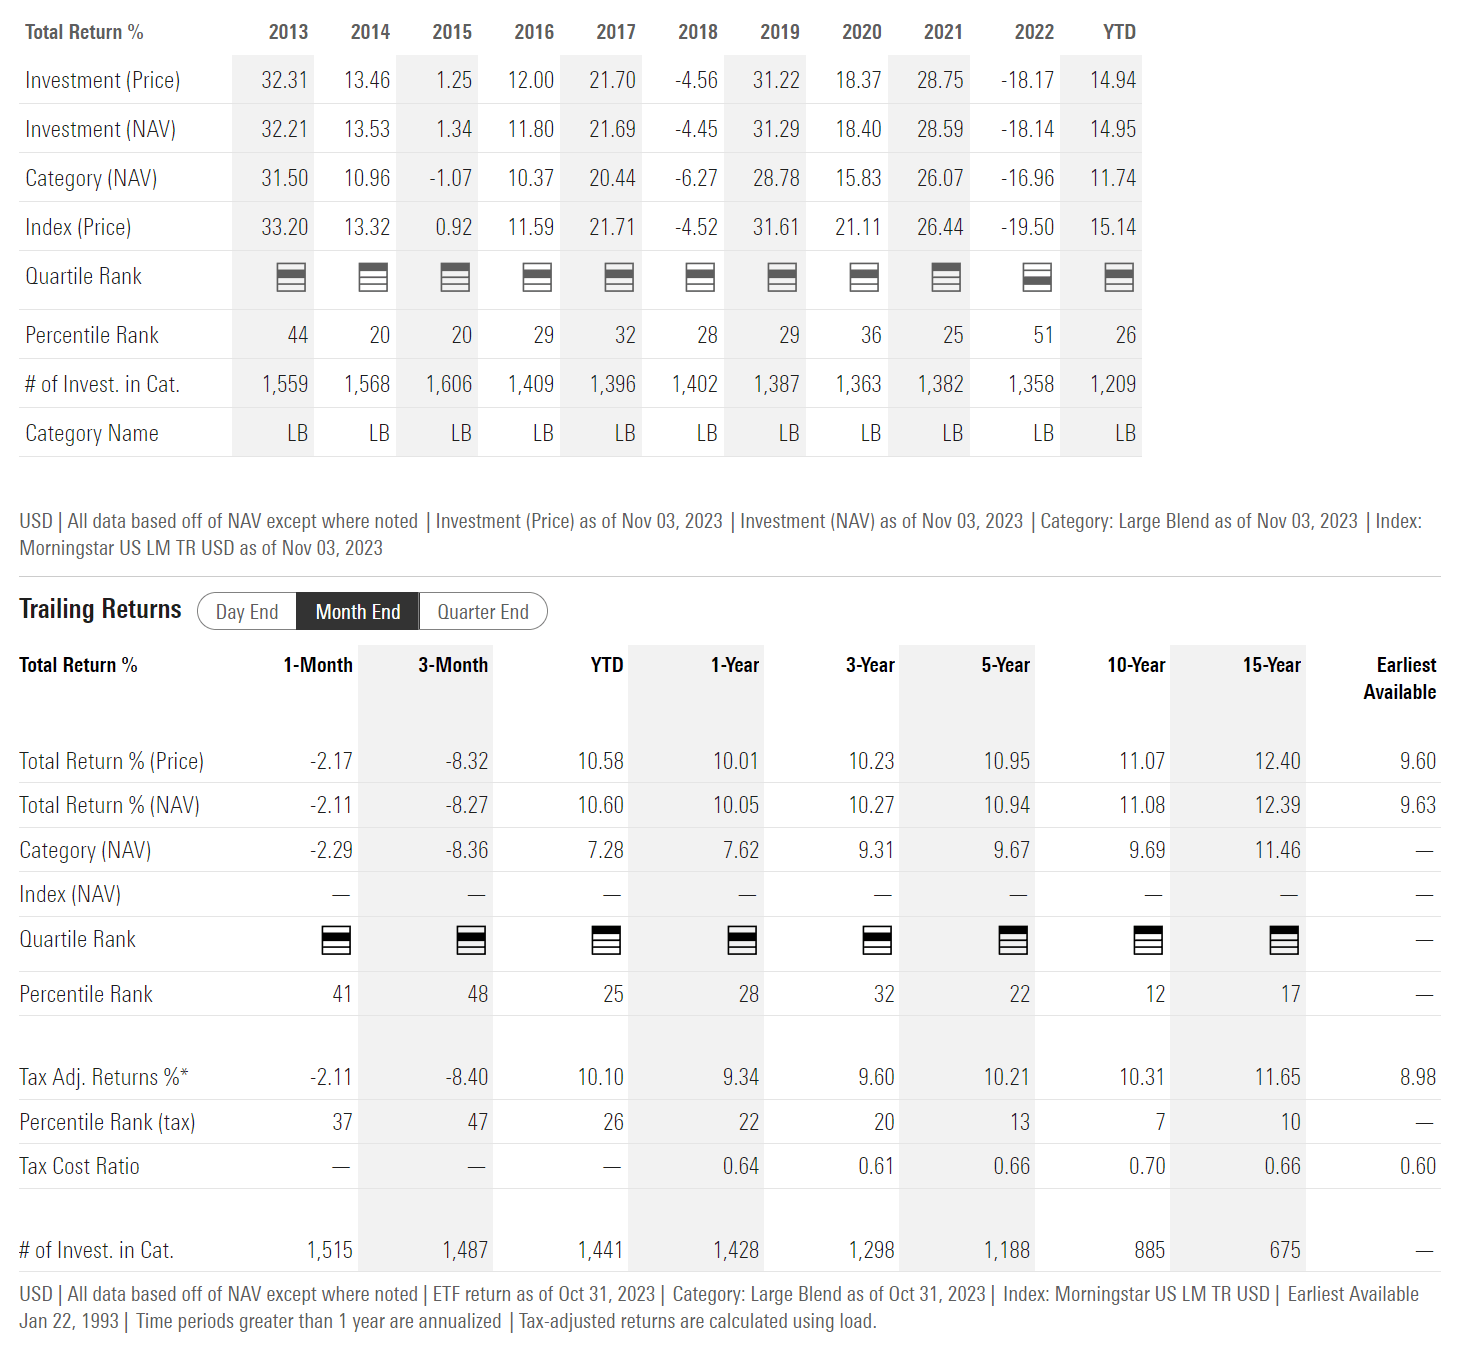
However, the SFY ETF has lagged the SPY ETF, which has returned 10.1% and 10.3% respectively over the same timeframes (Figure 6).
In fact, given SFY's 'growth-oriented' mandate, we should compare the SFY ETF against growth-oriented funds like the Invesco QQQ Trust ETF ( QQQ ). The QQQ ETF has returned 27.2% and 9.9% on a 1- and 3-year timeframe to October 31, 2023 (Figure 8).
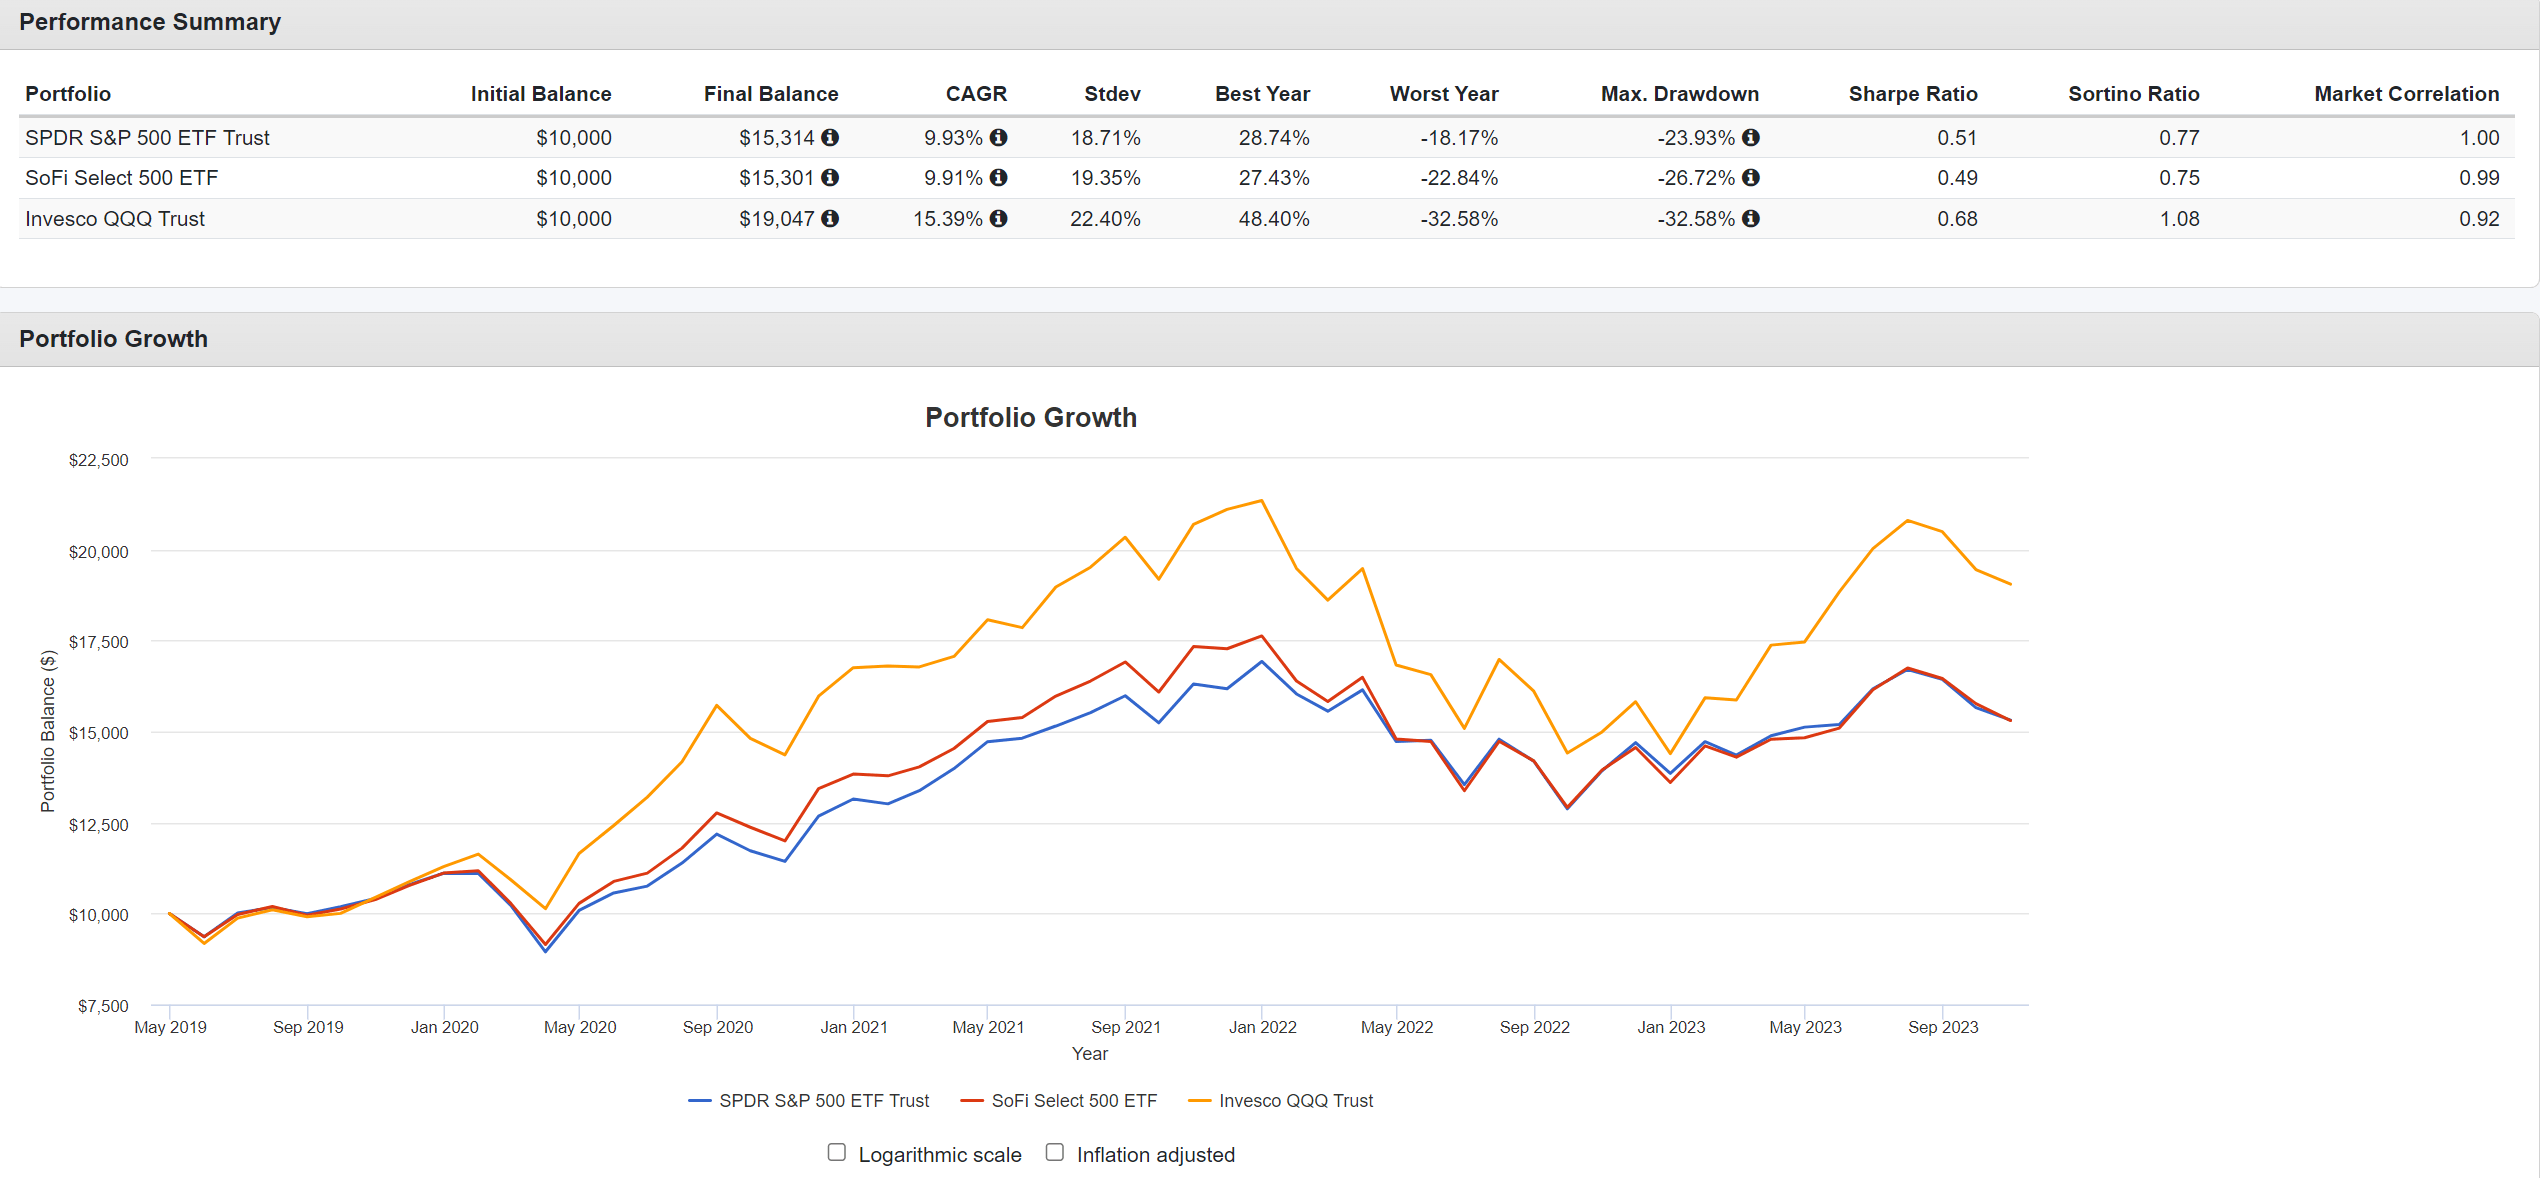
Measured from May 2019 (SFY's inception) to October 2023, the SFY ETF has matched SPY's CAGR returns but has higher volatility and larger drawdowns (Figure 8). SFY has significantly lower CAGR returns compared to QQQ.
Figure 9 - SFY vs. SPY and QQQ (Author created using Portfolio Visualizer)
Overall, both SPY (0.51 Sharpe ratio, 0.77 Sortino ratio) and QQQ (0.68 Sharpe ratio, 1.08 Sortino ratio) have better risk-adjusted returns compared to SFY (0.49 Sharpe ratio, 0.75 Sortino ratio). SPY has similar returns but lower risk. QQQ has higher returns that more than compensate for higher risk.
Commendable Aspirations But Questionable Results
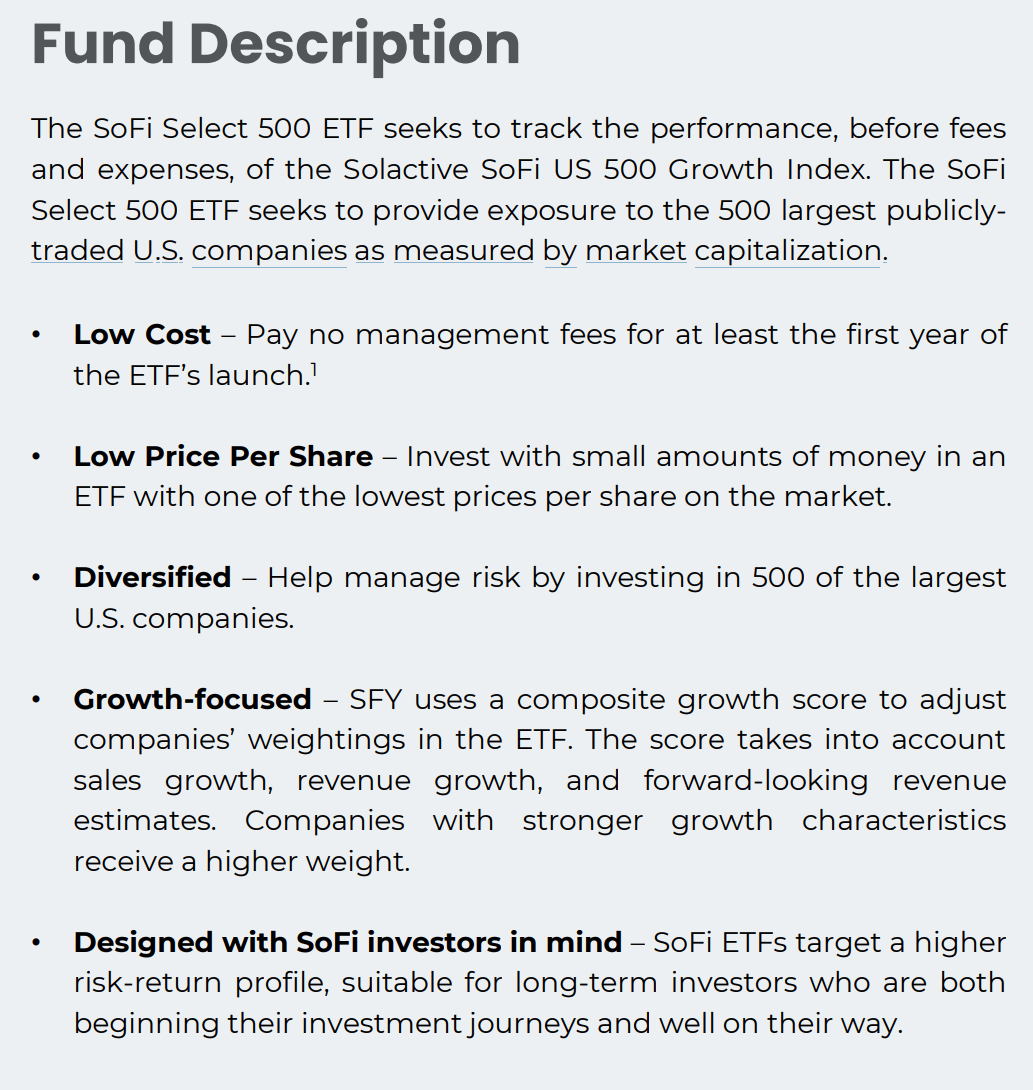
The SFY ETF has commendable aspirations to provide low-cost (a zero management fee is as low as one can go) exposure to large cap U.S. companies, to appeal to its 'Social Finance' customer base (Figure 10).
However, as we have seen in the historical returns comparison above, SFY's proprietary weighting methodology does not appear to add any value, as the SFY ETF has essentially matched the SPY ETF's returns since inception with higher volatility. If we compare SFY to the growthier QQQ ETF, the SFY ETF also underperforms.
Low Price Should Not Be A Selling Feature
In fact, I have an issue with SFY's emphasis on 'low price per share' in its market documents. With the introduction of fractional shares and odd lots on many investment platforms, investors can gain exposure to stocks and ETFs no matter the amount of money they have to invest.
So instead of looking for the 'cheapest' ETF by share price, investors should compare funds based on their track records and investment mandates.
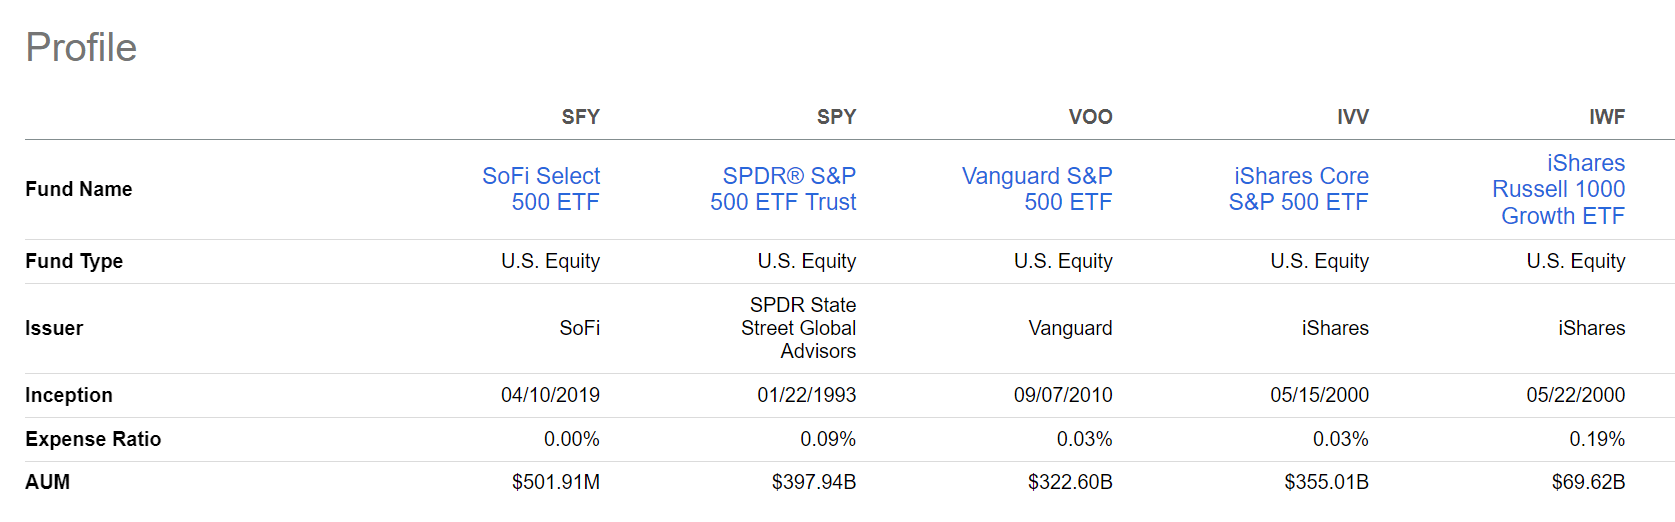
Furthermore, once SFY's management fee waiver period concludes in June 2024, the SFY ETF will be significantly more 'expensive' than the ultracheap Vanguard S&P 500 ETF ( VOO ) and the iShares Core S&P 500 ETF ( IVV ). So caveat emptor.
Conclusion
The SoFi Select 500 ETF provides exposure to the 500 largest U.S. companies weighted with a growth emphasis. Analyzing the fund's historical returns, I do not see a compelling reason why investors should own the SFY ETF compared to a broad market ETF like the SPY, or a growth-oriented ETF like the QQQ. SFY has similar returns to SPY but higher risk. QQQ has higher returns than SFY which more than offsets its higher risk. Once the fee waiver period ends next year, the SFY ETF will also be more expensive than the broad S&P-based ETFs.
For further details see:
SFY: Boring Is Beautiful; Stick With SPY And QQQ Instead