VZ - SPHD: Go Into 2024 With This High-Yield Defensive Tilting ETF
2024-01-11 18:08:35 ET
Summary
- Dividend investors should look beyond the S&P 500's largest stocks for higher yields, and focus in smaller sectors like Utilities and Real Estate.
- The Invesco S&P 500® High Dividend Low Volatility ETF is attractively priced and had a record high total payout last year.
- The SPHD ETF has a diverse and defensive portfolio, low expense ratio, and positive technical indicators, making it a buy-rated ETF in my view.
- I outline key price levels to watch as 2024 gets underway.
Dividend investors have to go beyond the S&P 500's (SP500, SPX) the biggest holdings if they are looking to snatch a decent yield. At just 1.5% as of the end of Q4, the SPX’s dividend payout leaves something to be desired. If an investor is to buy high-yield equities, chances are those will be from smaller sectors in the market. Utilities and Real Estate, two spots beat up hard at times in 2023, are the largest positions in one popular high-yield fund. Those areas are often low-volatility, too.
I have a buy rating on the Invesco S&P 500® High Dividend Low Volatility ETF (SPHD). I view the portfolio as priced attractively, while its total payout last year managed to hit an all-time high.
The S&P 500's Dividend Yield Has Fallen to 1.5% As of Q4 2023
Goldman Sachs
For background, SPHD seeks to track an index of large-cap U.S. high-dividend-yield stocks. It aims to invest in 50 securities traded on the S&P 500 Index (SP500) that historically have provided high dividend yields and low volatility. The Fund and the Index are rebalanced and reconstituted semi-annually, in January and July, according to Invesco.
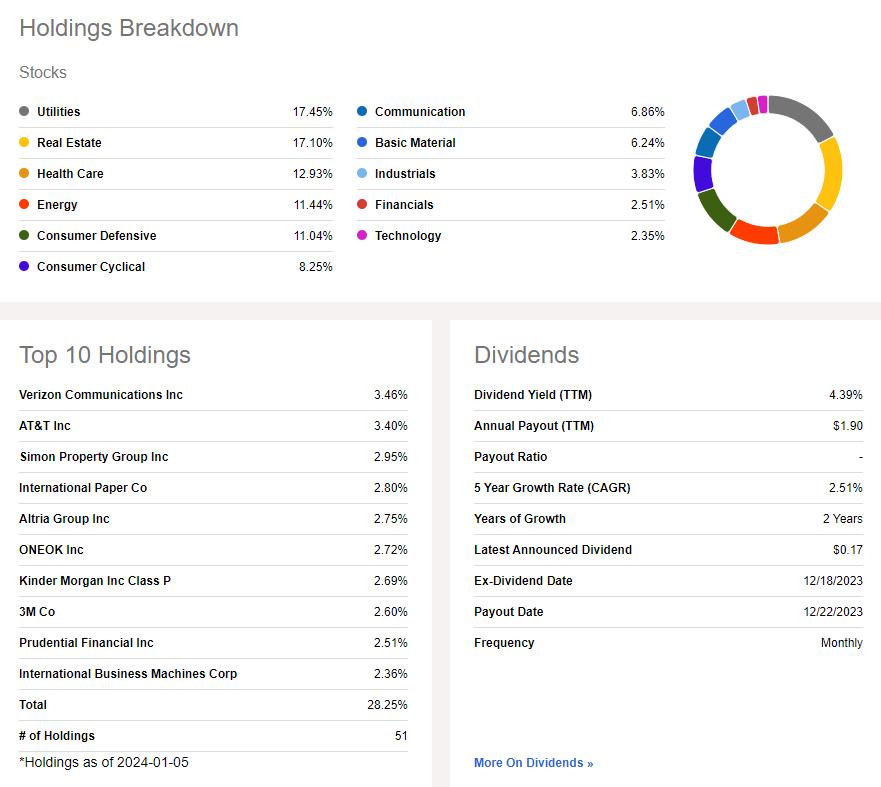
SPHD is a decent-sized exchange-traded fund, or ETF, with more than $3 billion in assets under management ("AUM"), and it features a low to moderate 0.30% annual expense ratio as of January 8, 2024. Share-price momentum has improved lately, but the fund remains below its all-time highs. Also, the high-dividend factor was quite weak last year, leading to underperformance compared to the growth-heavy S&P 500 index. Dividends, meanwhile, are robust given SPHD’s high 4.4% trailing 12-month dividend yield , though risk metrics are somewhat weak. Still, the ETF’s liquidity metrics are sound, with average 90-day volume of about 600k shares while SPHD’s 30-day median bid/ask spread is narrow at just two basis points.
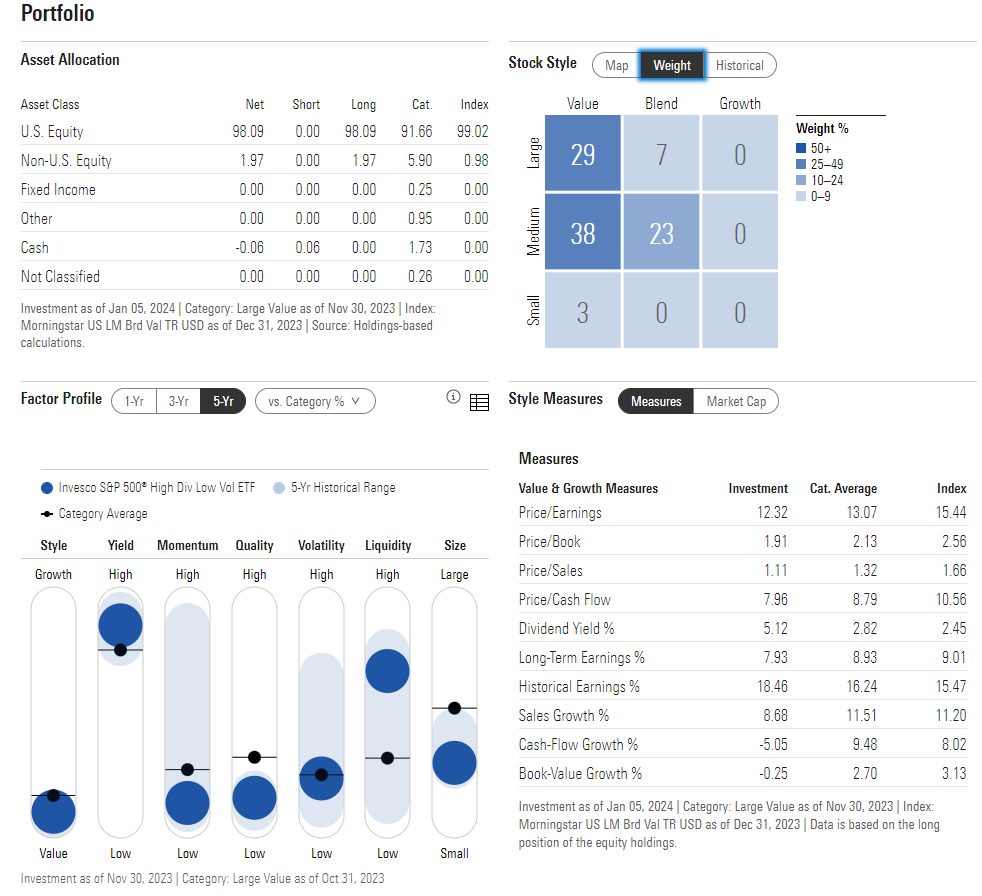
Digging into the portfolio, the 2-star, neutral-rated fund plots on the far-left portion of the Morningstar style box with more than half of the allocation considered mid-cap in nature. So, there is some risk if you simply analyze the market-cap size profile. Of course, many of these companies are somewhat defensive, low-volatility, blue-chip names that focus on high dividend payouts rather than being aggressive growth firms. With a price-to-earnings ratio barely above 12 and a long-term earnings growth rate close to 8%, the valuation is attractive in my view.
SPHD: Portfolio & Factor Profiles
What sets SPHD apart is its sector breakout. More than one-third of the fund is in the defensive Utilities and Real Estate areas. The Tech and Communication Services sectors represent less than 10% of the ETF, so expect the fund’s returns to differ substantially from those of the S&P 500. Keeping the ETF’s risk in check is its construction methodology that makes it so that the top 10 stocks comprise only 28% of the portfolio.
SPHD: Holdings & Dividend Information
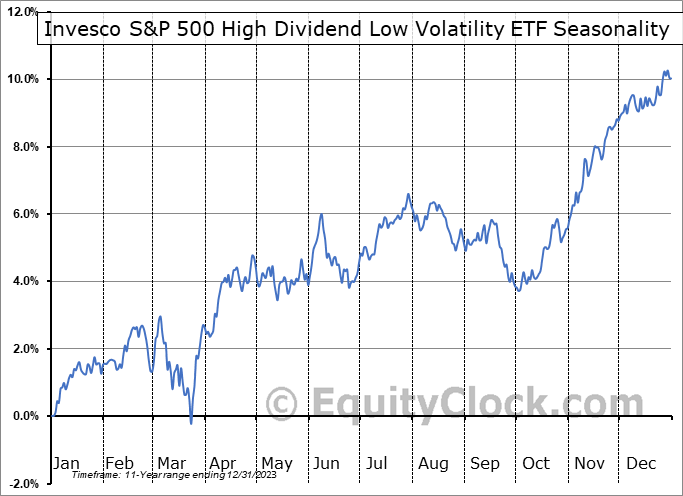
Seasonally, SPHD tends to rally into early March, but history shows that mid-to-late March can often feature volatility and downside price action. That has negatively impacted SPHD, according to data from Equity Clock . From there, however, rallies have typically taken place into Q3.
SPHD: Mixed Q1 Seasonal Trends
The Technical Take
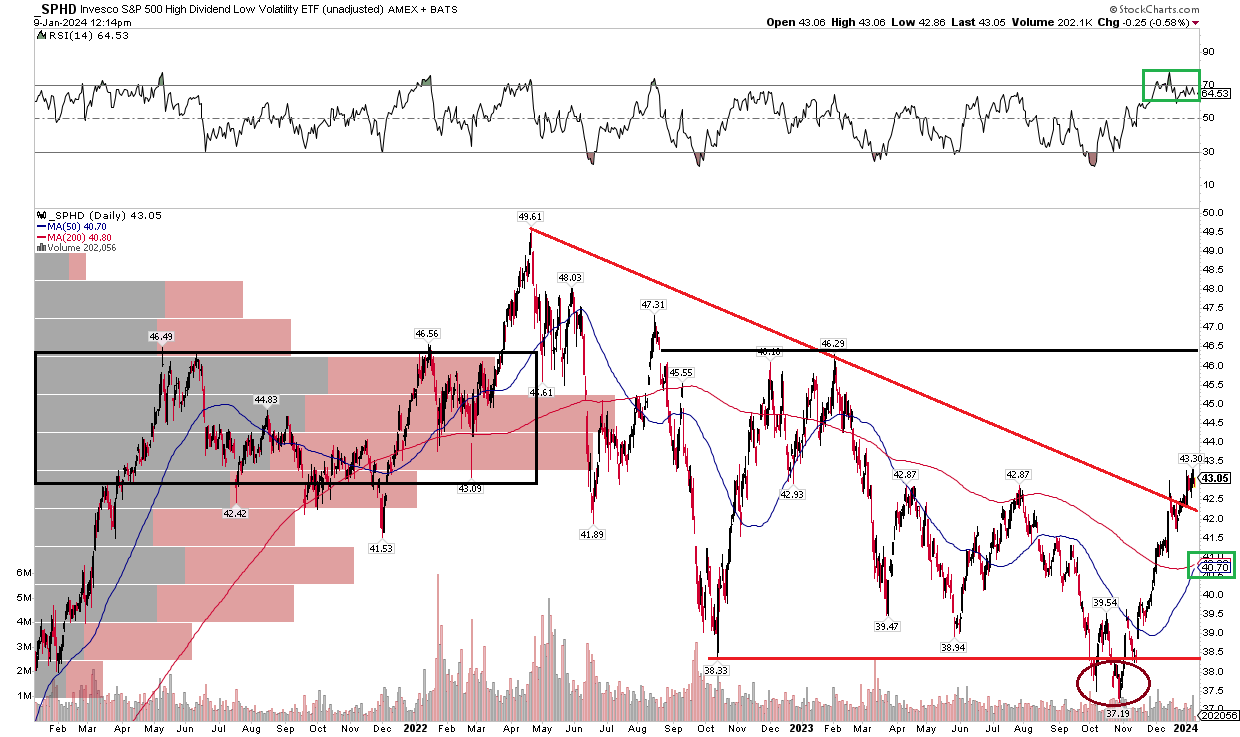
With a diverse and defensive portfolio, modest expense ratio, and low valuation, the chart has turned constructive. Notice in the graph below that shares have broken through a downtrend resistance line off the all-time high hit in early 2022. The fund actually printed a bullish false breakdown at its 2023 low just a handful of weeks ago. I see resistance in the $46 to $47 range, while support is apparent at the confluence of SPHD’s long-term 200-day moving average and the 50dma.
Also take a look at those two moving averages – they are about to post a bullish golden cross pattern, in which the shorter-term moving average rises above the longer-term moving average. That is a positive signal, while the RSI momentum oscillator at the top of the chart hovers in a bullish range as price climbs (positive price and momentum confirmation). The bearish data point is the high amount of volume by price in the $42 to $47 range – that will make tough sledding for the bulls to rally the ETF through a significant amount of supply of shares.
Overall, the technical situation has improved in recent months.
SPHD: Bullish Breakout, Eyeing $46.50
The Bottom Line
I have a buy rating on SPHD. I see Invesco S&P 500® High Dividend Low Volatility ETF's high yield as attractive in this low-dividend world of mega-cap tech stocks that are also pricey on their own. With a low valuation and favorable technicals, SPHD is an ETF to overweight in 2024 in my opinion.
For further details see:
SPHD: Go Into 2024 With This High-Yield, Defensive Tilting ETF