SPY - SPY: Road To 5000 (Technical Analysis)
2023-11-03 15:48:57 ET
Summary
- Stocks sold off in September and October due to higher rates and a strong dollar.
- Sentiment and positioning indicators suggest a bottom could be in or close, and seasonality favors a bull run.
- Technical analysis supports the idea of a low and potential rally to new all-time highs, with a possible test of the 3900 level.
Thesis Summary
Stocks have sold off in September and October, most of which can be attributed to higher rates.
However, with the S&P reversing just above 4000, I believe conditions might be ripe for another rip higher.
As we sold off last month, sentiment reached extreme fear, and positioning reached levels seen during the October 2022 lows. These are both good contrarian indicators that suggest a bottom could be in, or at least close.
To top things off, seasonality now favors a bull run.
Based on technical analysis, I think we could still revisit the 3900 level, before the SPX begins its road to 5000.
Why did stocks drop?
Stocks sold off in September and October, and there are two culprits in my opinion.
Obviously, higher rates, and to an extent, also the strong dollar, have created a headwind for US stocks.
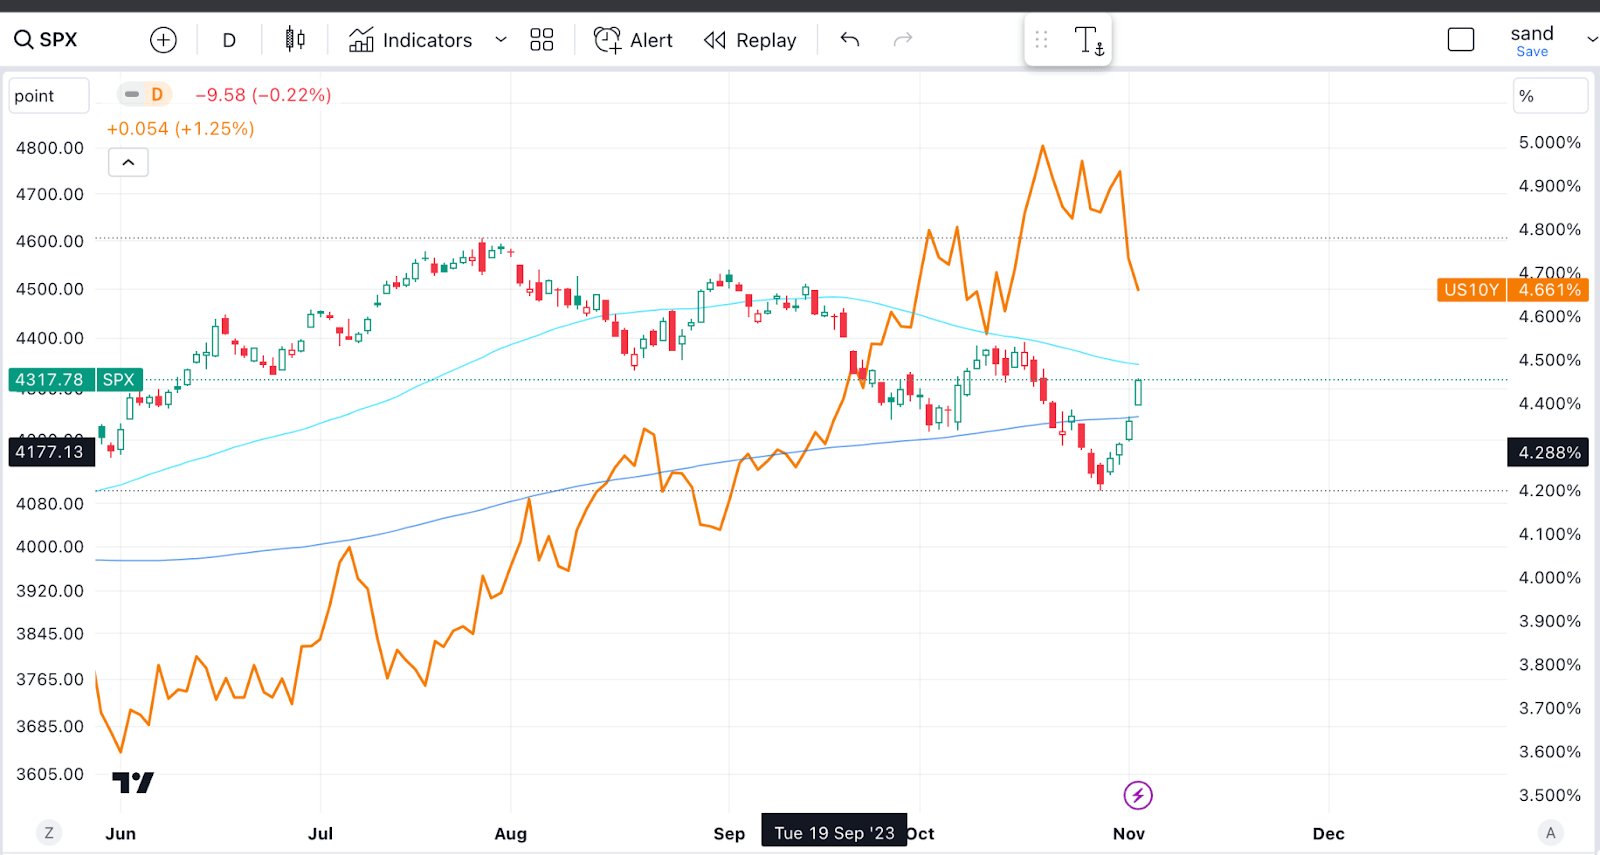
Above we can see the SPX and the path of 10YR US bond yields.
Starting around September, we began to see a clear negative correlation between stocks and bonds. As rates went higher, stocks went lower. We can even see that stocks have been able to rally in the last week as rates have begun to turn down.
So what exactly happened to rates?
Though Fed policy is obviously a factor, the sudden climb in rates could be attributed to an increase in term premia.
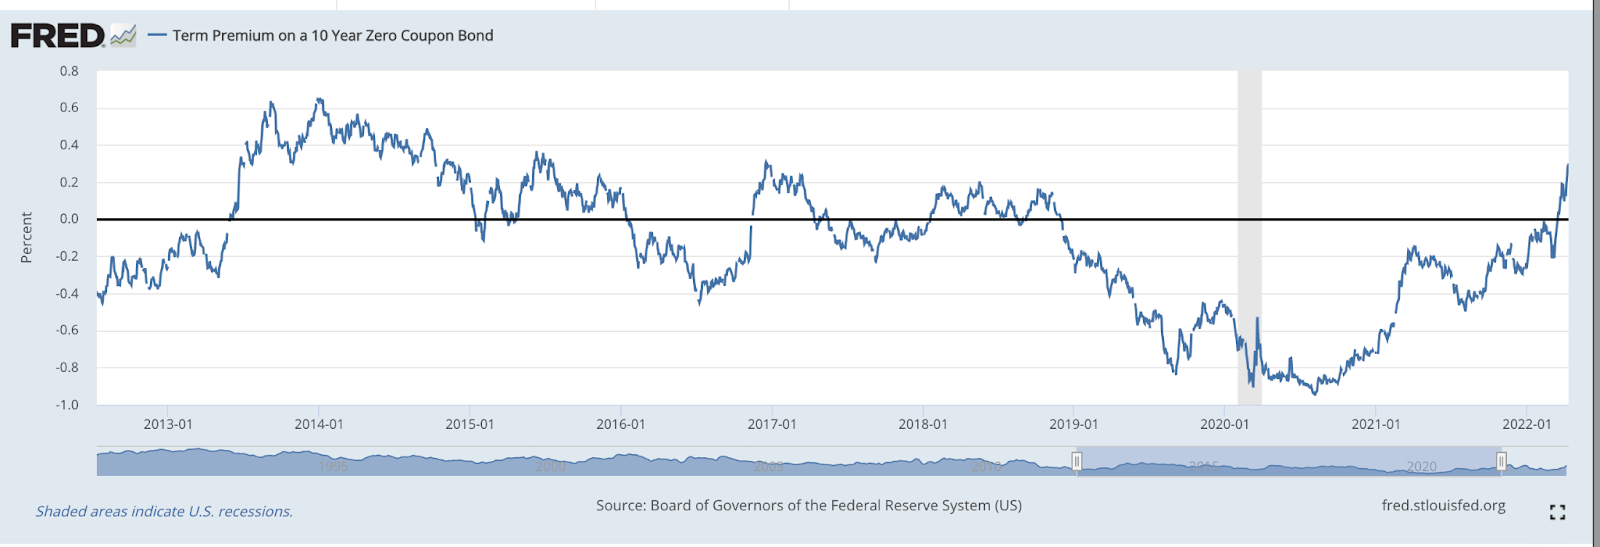
The term premia represents the compensation that investors demand in order to take on the risk of rate volatility. An increase in term premia is a sign that the market is uncertain about the future of interest rates, so it demands more of an “insurance”.
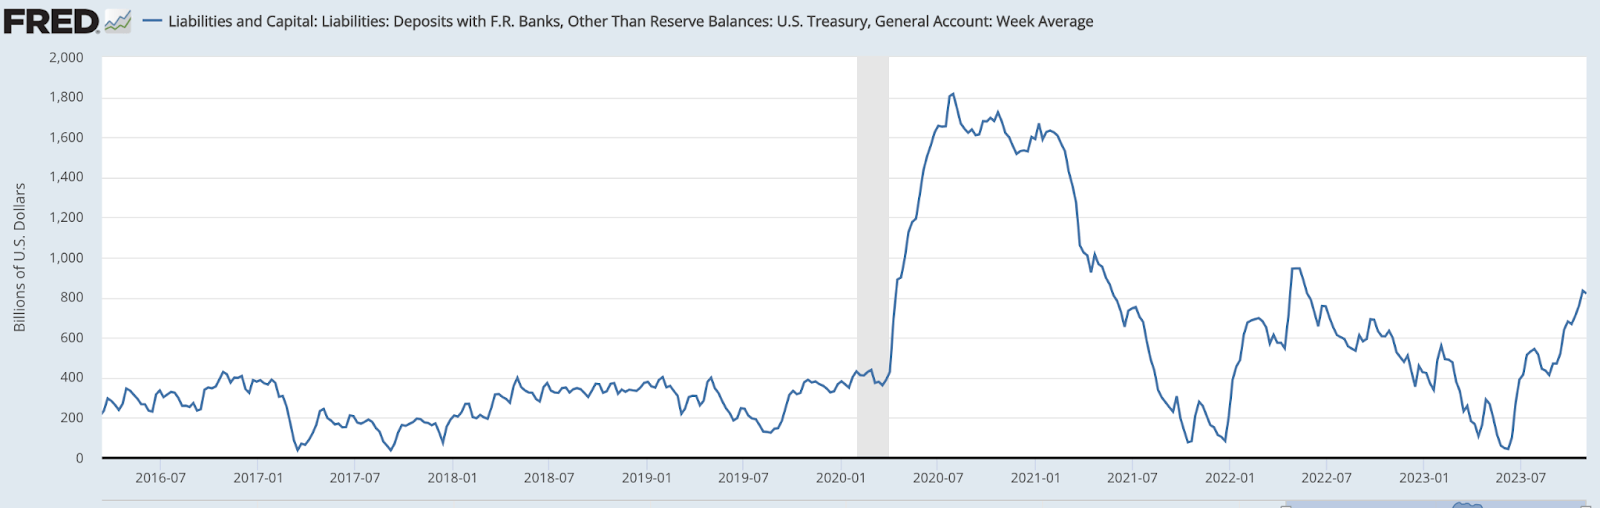
In turn, the increase in term premia, and also rates, is also related to the fact that the treasury has been aggressively refilling its coffers.
And in fact, the reversal in markets and rates coincides with an announcement by the Treasury on Wednesday that it would “only” be borrowing $776 billion in the last three months of the year, which is less than the market expected.
3 Reasons To Buy
Following the news, rates eased, and markets have taken off. While I am still not sure a low has been struck, there are some compelling reasons to be bullish here.
Seasonality (BofA)
While September and October are often seen as seasonally negative, we are now entering what has historically been the most bullish 6 months of the year, going back to 1928.
NAAIM Exposure (NAAIM)
Meanwhile, the NAAIm exposure index, which measures the average exposure to US Equity markets reported by its members, is coming close to revisiting the October 2022 lows. This tends to be a good contrarian indicator, as exposure tends to reach a maximum when markets top, and hits a low as markets bottom.
Fear and Greed Index (CNN)
Lastly, as we approached the 4000 level last week, markets entered extreme fear. Even after this rally, we are still afraid. Again, this is a great contrarian indicator, as markets tend to bottom when fear is at an extreme.
Technical Analysis
So, we are definitely, in my opinion, close to a low, and TA also supports this idea.
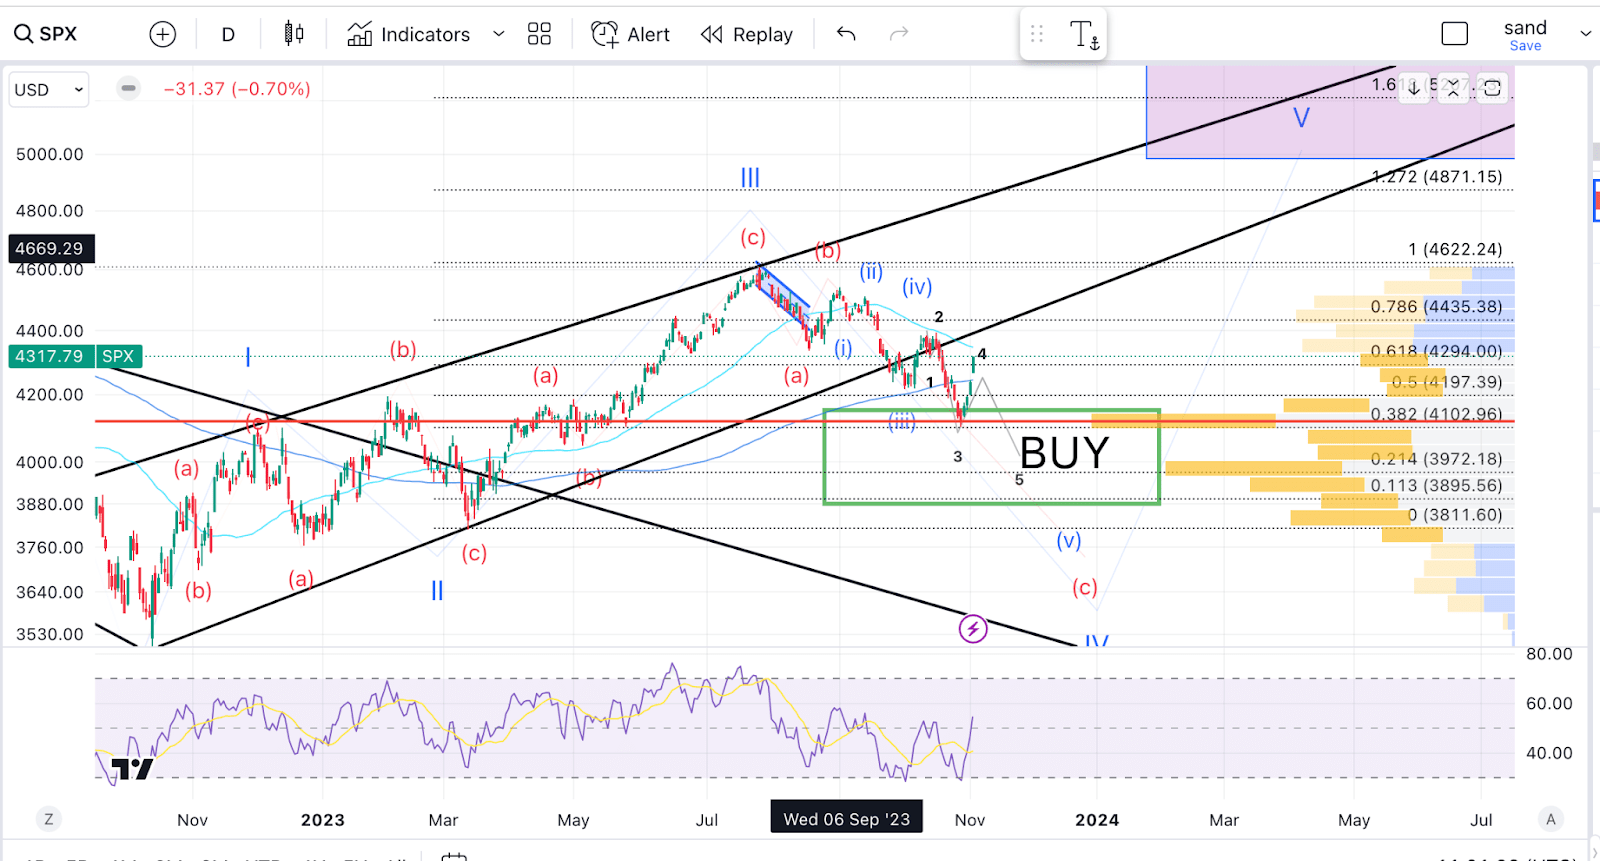
From an EW perspective, I see us completing a five-wave impulse from the October lows, which should take us to new all-time highs north of 5000 points.
After topping in wave III at 4600, the SPX began an a-b-c correction in wave IV. Last week, we broke below the 200-day MA, but found support at the 61.8% retracement at 4100.
However, I think we could head as low as 3900, to test the next fib level.
It’s important to note that the 4100-3900 area has had the most trades in the SPX over the last two years.
Keep It Simple
Now, if you are looking to participate in this coming rally, I suggest keeping it simple. The SPDR S&P 500 Index ( SPY ) tracks the S&P and is a simple way to gain exposure to the coming rally.
I prefer SPY over NDX as tech is more overbought, and we could see more of a rebound in sectors like Utilities and real estate.
It remains to be seen if other indexes like the Russell 2000 ( IWM ) or Emerging Markets ( EEM ) could outperform from here.
Takeaway
Overall, I believe the stage is set for a rally to new all-time highs. Following that, though, we could get a substantial correction. For now, though, it appears we have a compelling entry on the long side.
For further details see:
SPY: Road To 5000 (Technical Analysis)