XLY - SPY: The Bubble Keeps Swelling
2023-06-05 07:03:37 ET
Summary
- The S&P 500 Index has taught all the bears like me a lesson as it has gained 12.32% year-to-date. NASDAQ 100 added over 34% YTD.
- The breadth of the gain shows obvious signs that we're facing another bubble in equities.
- A galaxy of fundamental indicators points to a sell-off that cannot be timed because of the identified bubble.
- I'm mostly concerned about consumer behavior and their spending plans - they're the main driver of the economy, the state of which doesn't bode well at the moment.
I Was Wrong On SPX So Far
The S&P 500 Index ( SPY ) ( SP500 ) has taught all the bears like me a lesson as it has gained 12.32% year-to-date. The deterioration of macroeconomic conditions, which I've written about more than once , mainly affected the ex-tech sectors, and accordingly, the SPY and the Nasdaq 100 Index ( QQQ ) exceeded all my expectations due to the high weighting of technology stocks in their structures.
However, the S&P and NASDAQ ex-tech indices gained only 3.72% and 6.74% YTD, respectively:
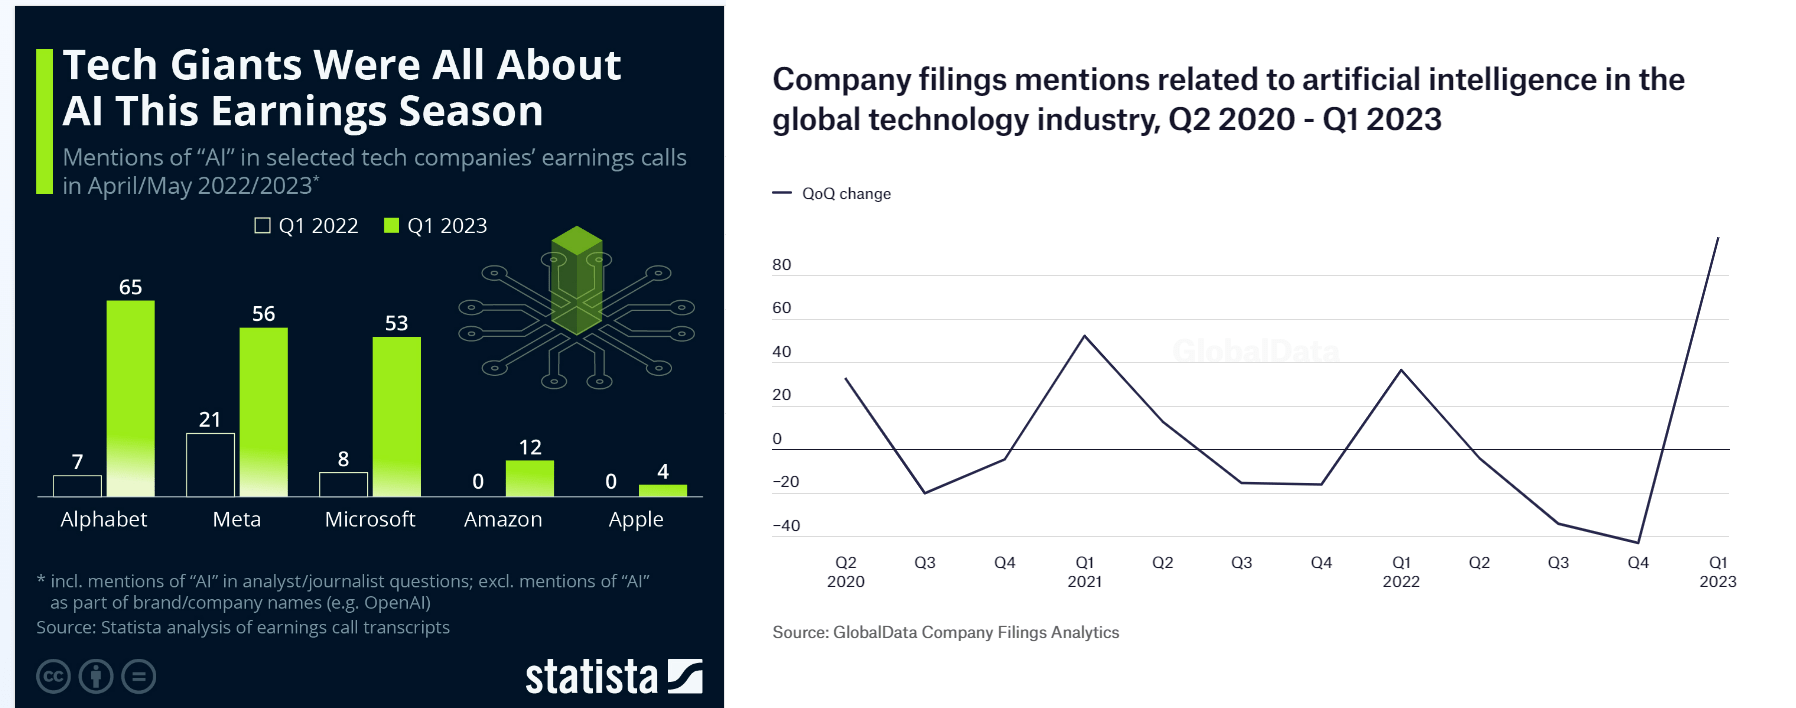
The market has continued to ignore fundamentals that in the past were clear and visible signs of an approaching economic peak - all because of the AI craze that started with the Big Tech companies and eventually spread far beyond today's tech sector.
Updated Thesis
Yes, I was wrong when turned bearish on SPY in late March 2023. But I never suggested shorting the index - it was always about reducing positions or getting out temporarily. As I analyzed the new facts that emerged in the market over time, I revised some of my views. However, one thing remained unchanged - today's rally looks like an absolutely unstable phenomenon in terms of fundamental indicators.
Why Do I Think So?
Let me note that I'm not a "permanent bear" on the stock market. I admit that some companies in the S&P 500 Index can be great "Buys" (and even more so from other smaller capitalized indexes), and almost all FANGMAN stocks are great long-term "Buy-and-Holds" because of their wide moats. However, a constructive look at current events raises some troubling questions that I cannot answer bullishly with certainty.
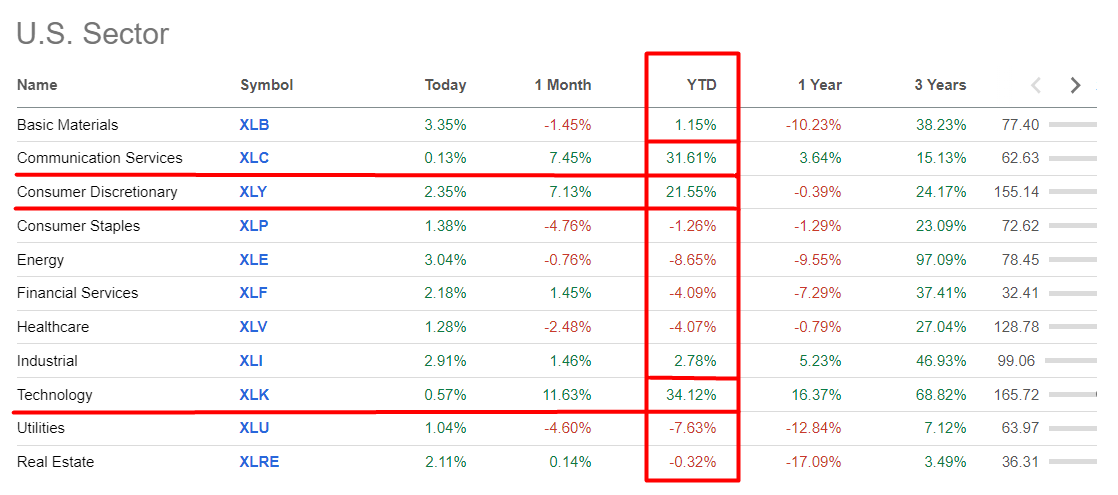
Firstly, like many others, I'm obviously confused about the breadth of the market rally we have seen over the last year. The SP500 has 11 sectors in its structure, but only 1/3 has driven the entire rally so far, while the other sectors have been very weak.
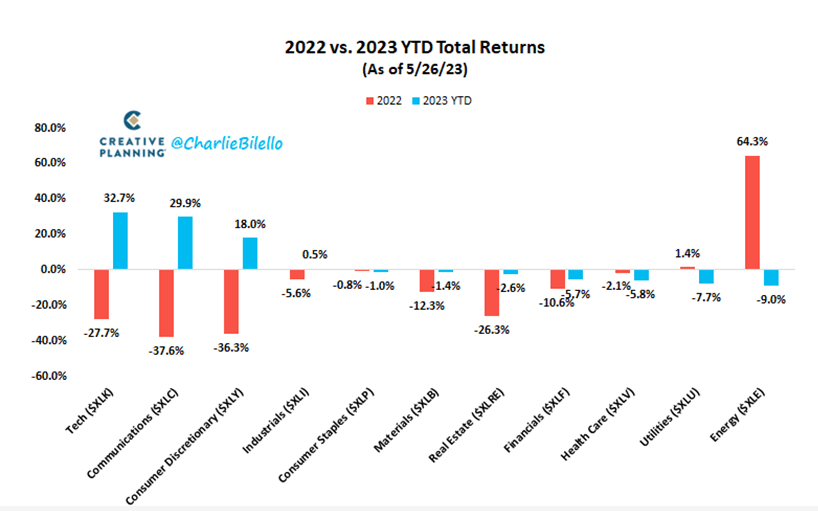
The growth of the three driving sectors - Technology ( XLK ), Communication Services ( XLC ), and Consumer Discretionary ( XLY ) - was the result of a "return to normal". The market simply began to favor the sectors that fell the most in 2022 and dump those that grew the most over the same period. Just take a look at Energy ( XLE ):
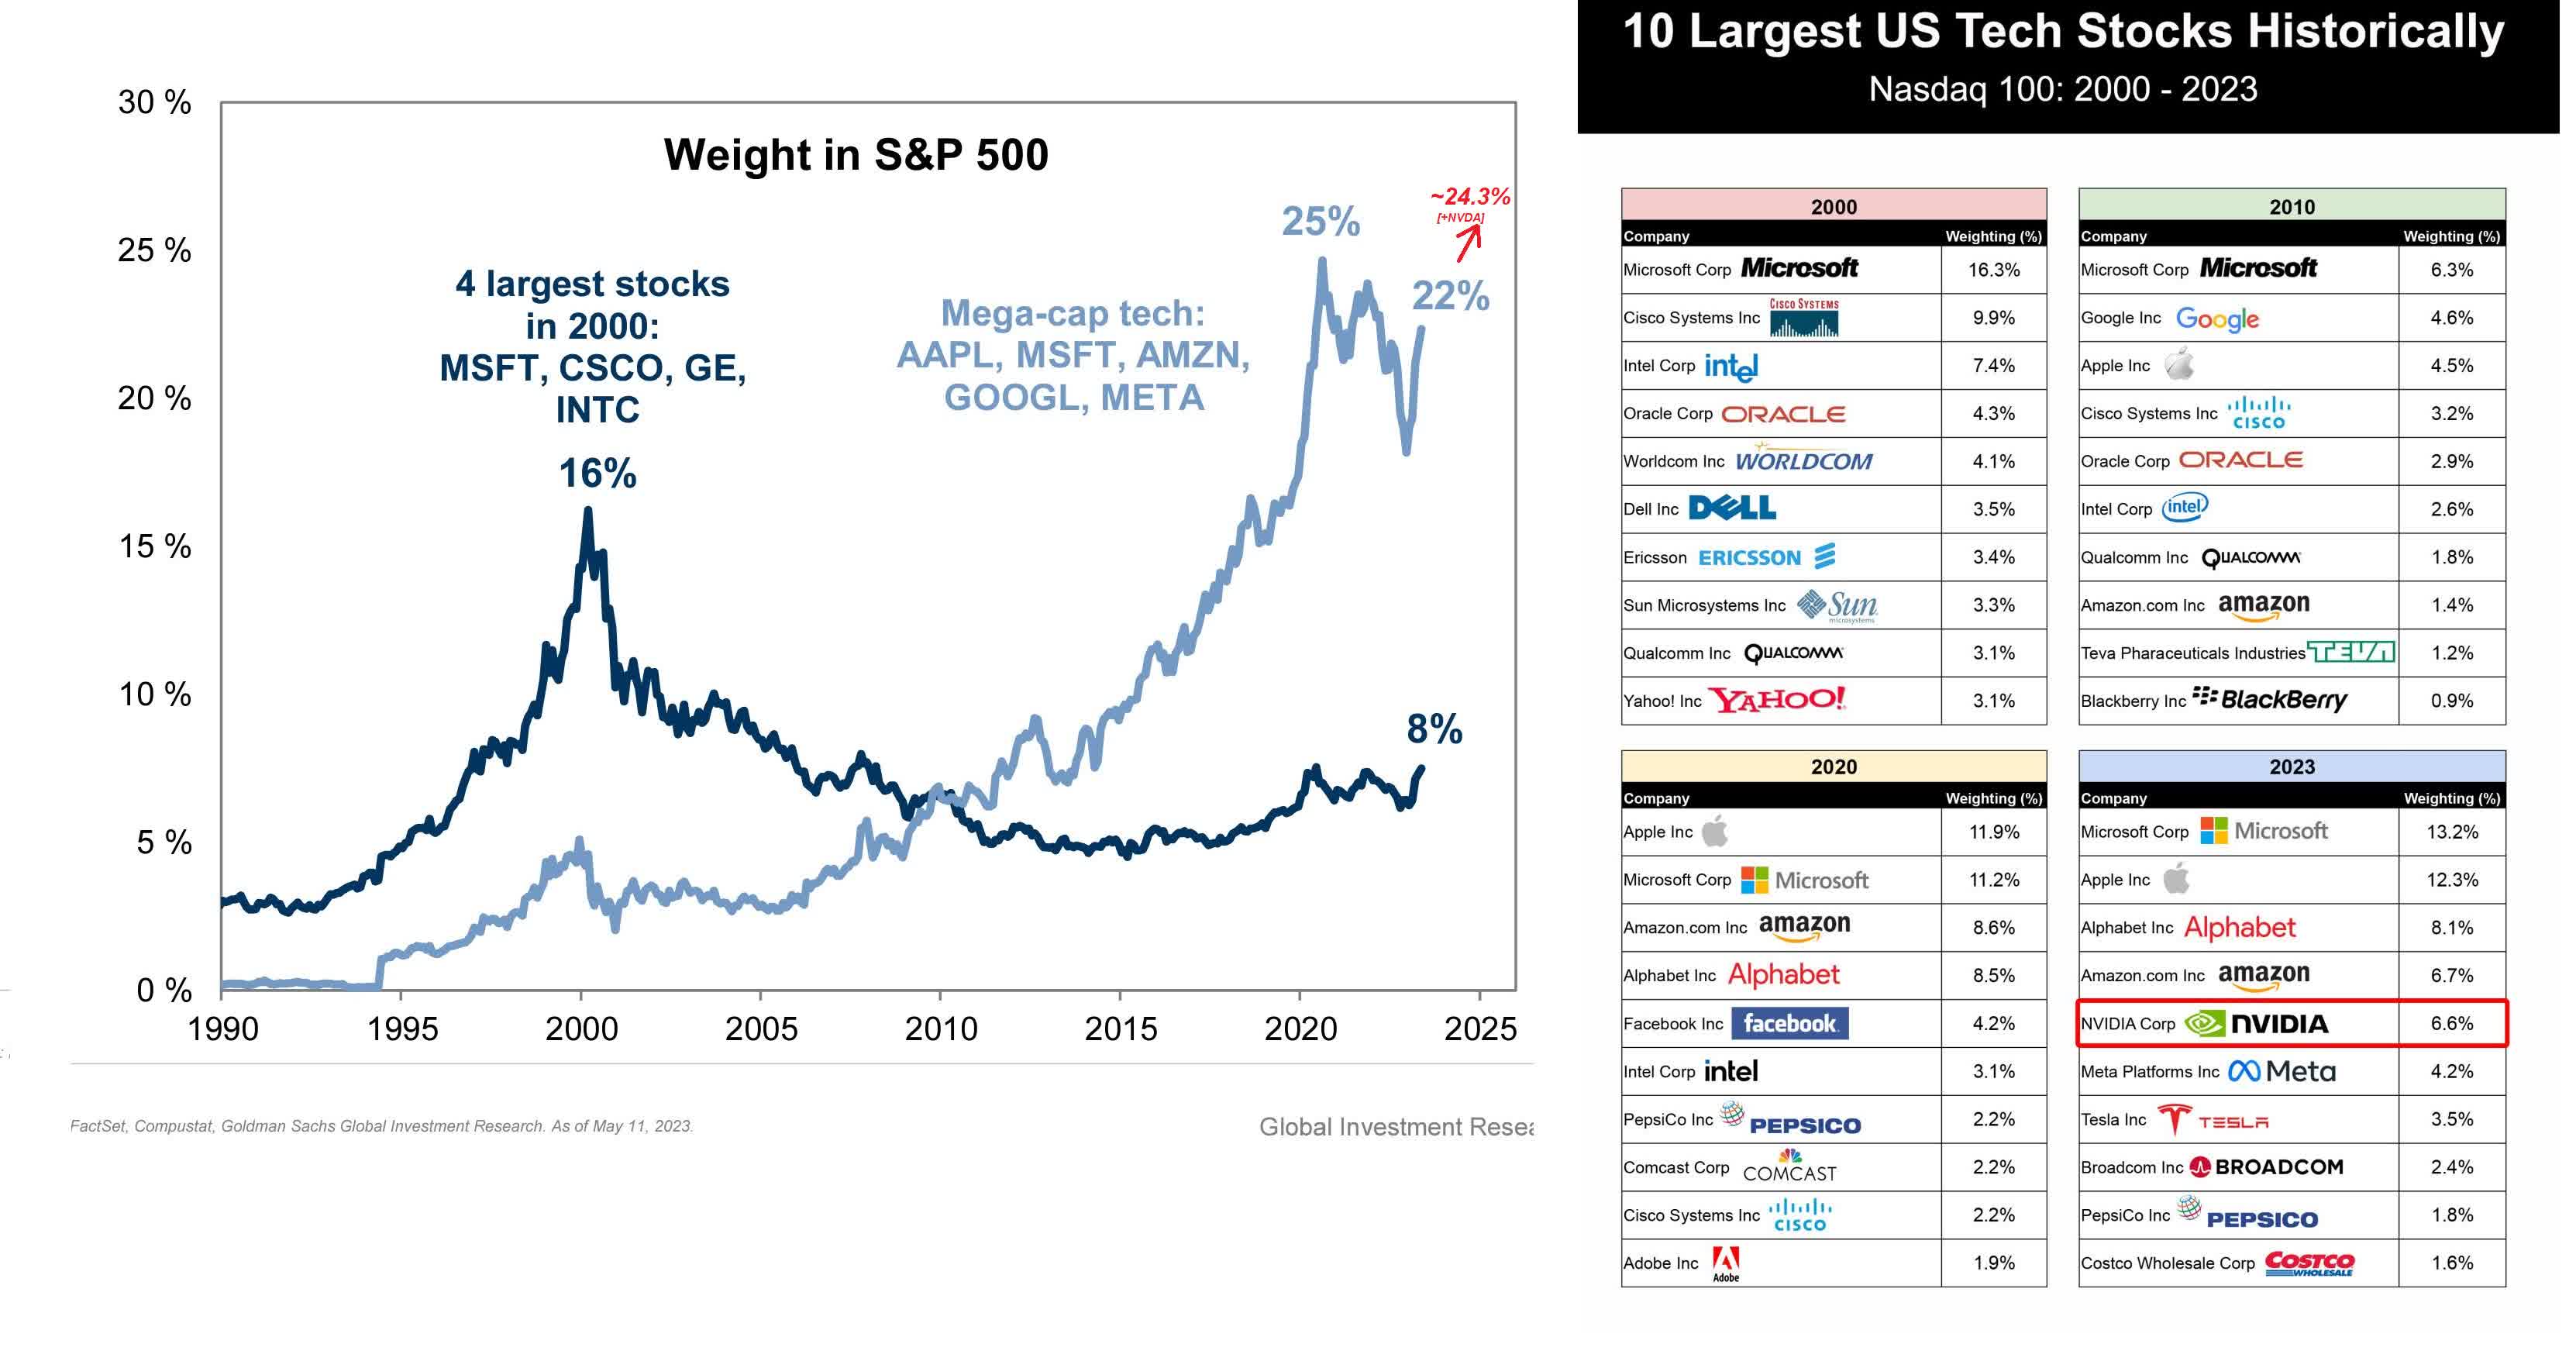
Nothing wrong with subsiding fears - however, the repricing that took place proved to be too large, resulting in the share of the fastest recovering sector [tech] rising to the highest share of the SP500:
Goldman Sachs [updated by the author], Ken Shih's data [shared on LinkedIn]
The main conclusion I draw from the current situation is that the SP500 and other tech-rich indices have formed a kind of bubble with their structure, which, after not having time to deflate in 2022, has been re-inflated thanks to the new trendy investment theme [AI]. When I say "bubble", I mean that the share of a single sector is far above its historical norm.
And here I need to make a very important point right away. The structure of the economy and the structure of consumption have changed dramatically since 2000. Technology plays a much more important role in the world today than it did 20-25 years ago. So it just doesn't make sense to take the average technology share of the S&P 500 of 8% and say that it's fair to expect a return to that level.
But the share of the top 5 companies inside SP500 [all come from tech] with more than 24% isn't the norm. Think about how much your daily life depends on using the products of all technology companies. Do they really take up 24% of your consumption [or manufacturing]? I highly doubt it. Undoubtedly, their share should be large - the same chips are everywhere today, from space rockets to writing pens - but everything should have a limit, in my opinion.
The question I think today's investors should be asking is, what will ensure these incredibly widespread AI-related efficiency gains [margin expansions, cost optimization, new growth areas]? We need to look at the consumer to see how manufacturing activity is changing under the influence of demand. And here I see some unresolved issues.
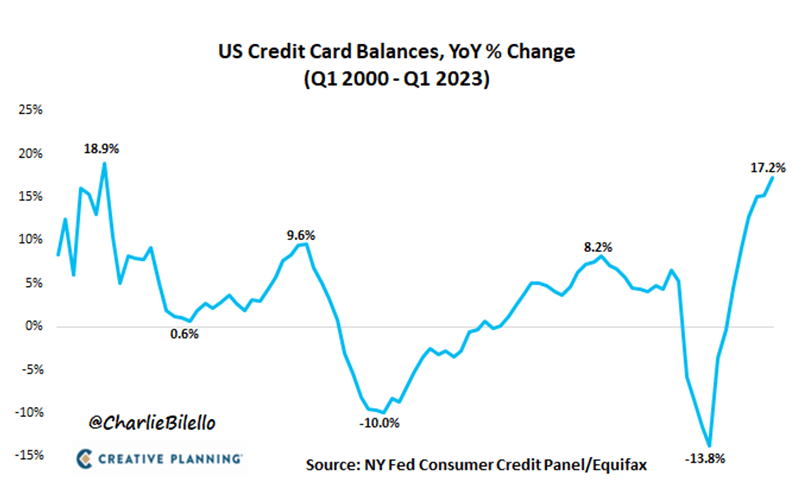
First , it seems clear to me that most of the U.S. population is financially strapped in some way-otherwise credit card usage wouldn't be increasing so rapidly against a backdrop of rising interest rates.
Rising credit card balances should eventually lead to a decline in consumer spending. As individuals devote a larger share of their income to debt service, their ability to spend on discretionary and non-essential goods and services declines. As a result, the overall consumer spending decreases.
Second , the negative impact on consumer spending is already evident from various surveys, such as the one I cited last month. Now we have more new data confirming the earlier findings. On May 30, 2023, Morgan Stanley's AlphaWise U.S. Consumer Pulse Survey [Wave 43, proprietary source] released the following key points that we should all be aware of:
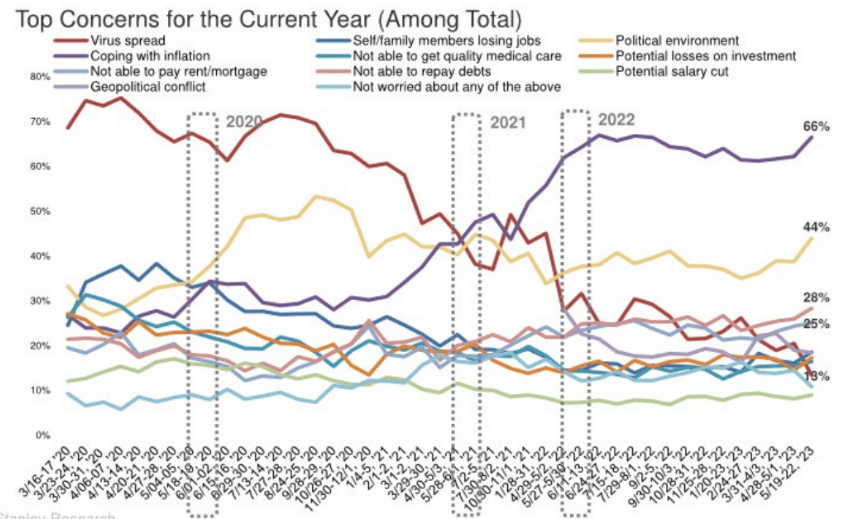
Increasing Job Concern : Consumers' concerns about job loss increased from the previous month, with 28% expressing more concern. Nearly 1/5 of consumers (66%) cited job loss as their top concern for this year.
May 30, 2023, Morgan Stanley's AlphaWise U.S. Consumer Pulse Survey [Wave 43, proprietary source]
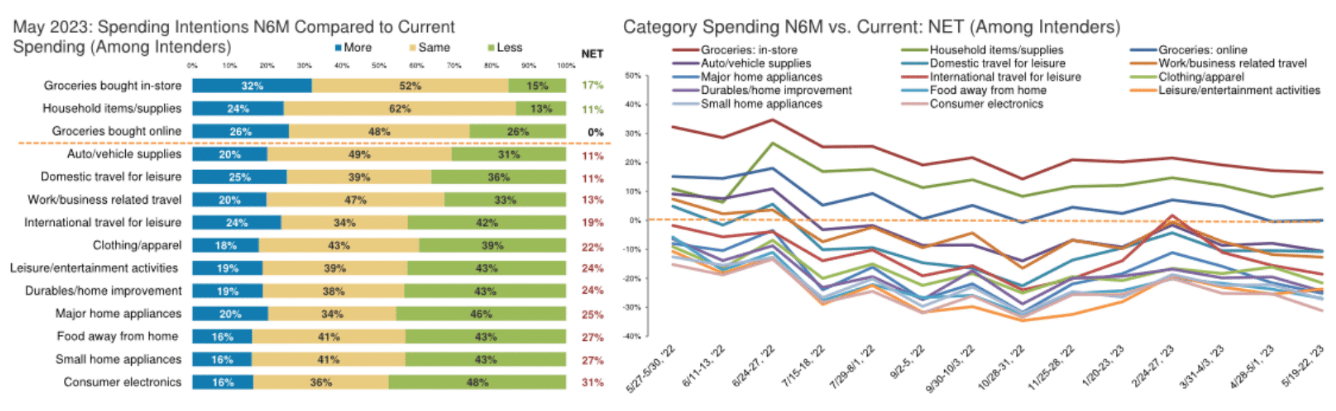
Spending outlook is deteriorating : Consumers expect to spend less on discretionary categories like electronics, home appliances, and dining-out:
May 30, 2023, Morgan Stanley's AlphaWise U.S. Consumer Pulse Survey [Wave 43, proprietary source]
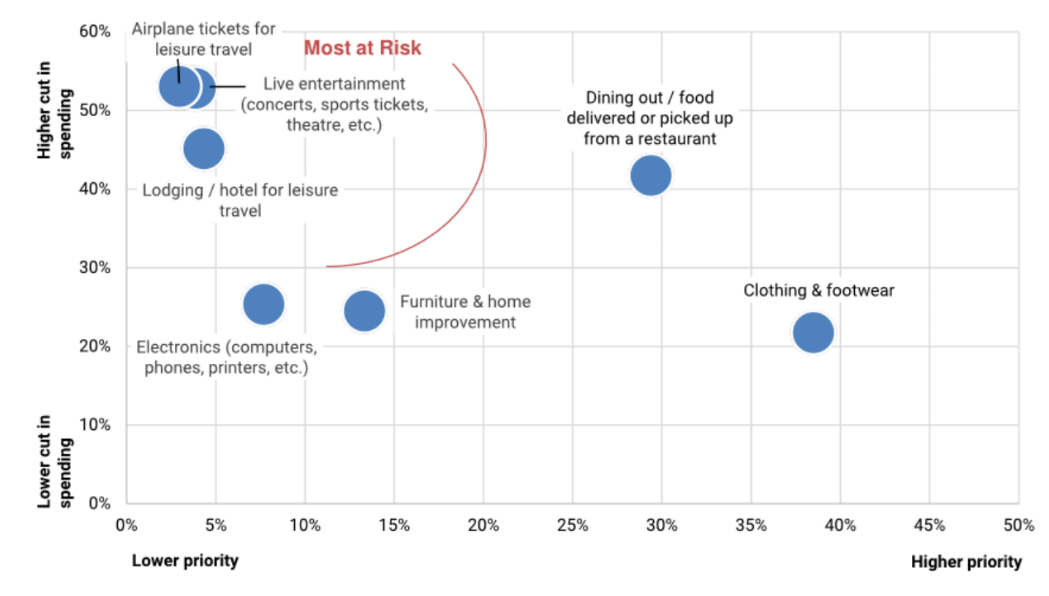
Travel and live entertainment are high-risk categories for spending cuts : Consumers cited travel (airfare and lodging) and live entertainment as the categories where they're most likely to cut back on spending. Apparel and restaurants were seen as more resistant categories.
May 30, 2023, Morgan Stanley's AlphaWise U.S. Consumer Pulse Survey [Wave 43, proprietary source]
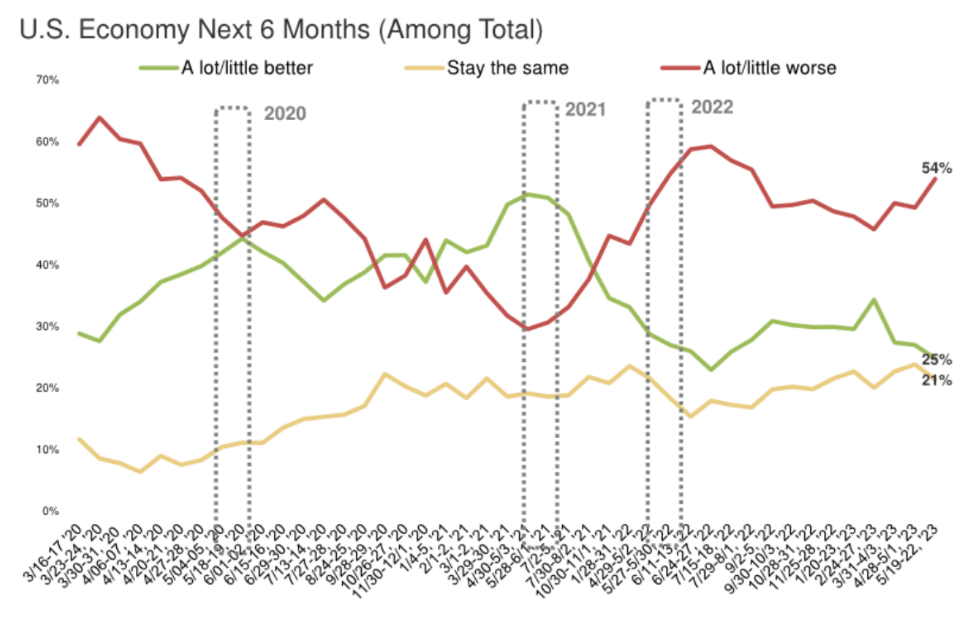
Dwindling confidence in the U.S. economy and household finances : Consumer confidence in the U.S. economy is deteriorating, with 54% expecting the economy to worsen over the next six months, compared to 25% who expect it to improve. Confidence in household finances is also on a downward trend: 26% expect finances to deteriorate in the next six months.
May 30, 2023, Morgan Stanley's AlphaWise U.S. Consumer Pulse Survey [Wave 43, proprietary source]
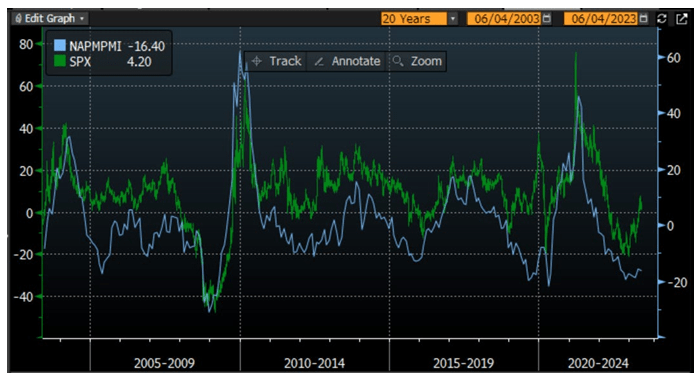
Third , manufacturing activity is struggling as a result of the weak demand [I suppose]. The ISM data provides a forward-looking measure of growth that aligns with the equity market and usually leads them, which is now not the case:
This disconnect is likely due to a few influential stocks driving the market while the majority of stocks are pricing in a slowdown. The ISM New Orders Data and the New Orders to Inventory ratio tend to anticipate economic trends. And the new orders have weakened recently , causing the new orders to inventory ratio to decline, indicating potential challenges ahead. The regional Fed data, including the Dallas Fed data and the MNI Chicago PMI data, also suggest that the bottom of the ISM has not yet been reached, according to Richard Excell from the Stay Vigilant newsletter. He thinks that the surprisingly strong jobs numbers may lead to a "job-full recession," where the majority of people do well while the top earners struggle.
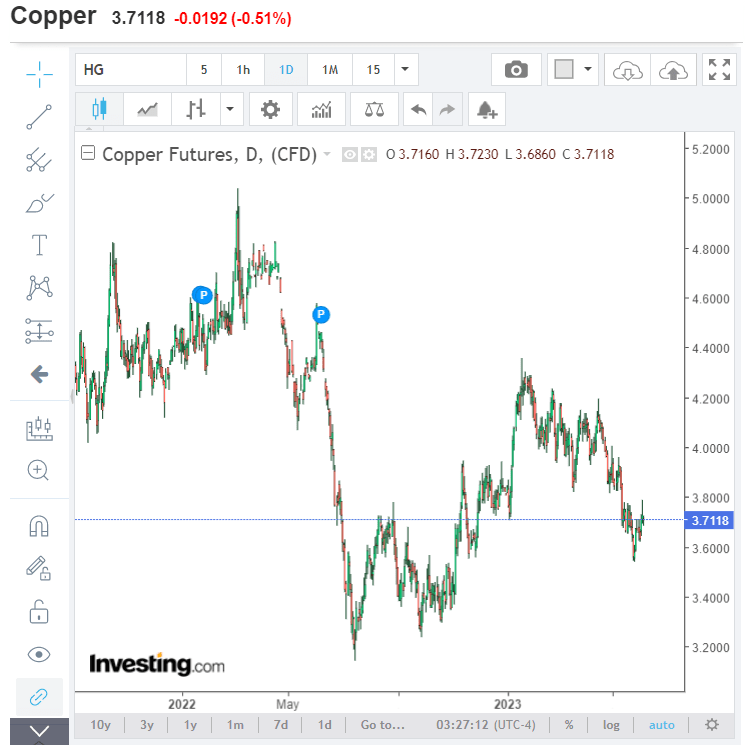
Be that as it may, what we see in commodity prices doesn't look like healthy corporate demand. Goldman Sachs' Commodities Research team revised down its previous demand projections for iron ore citing challenges in global steel demand caused by China's property contraction and manufacturing headwinds [June 4, 2023 - proprietary source]. Copper at the same time keeps rolling down:
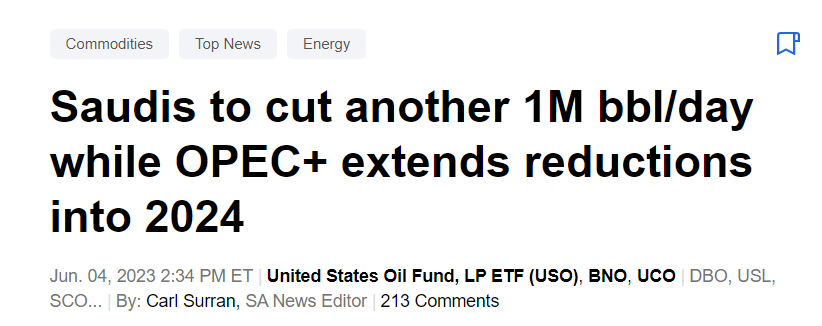
The Saudis have decided to cut production by another 1 million barrels per day in July in light of developments in China and the global economy. Bloomberg writes that global oil demand will hit a record high this year - maybe, but then why is Saudi Arabia cutting output to its lowest level since June 2021, when production was still recovering from the depths of the Covid-19 pandemic?
So the commodities markets and actual manufacturing activity don't support the rally in stocks we see right now.
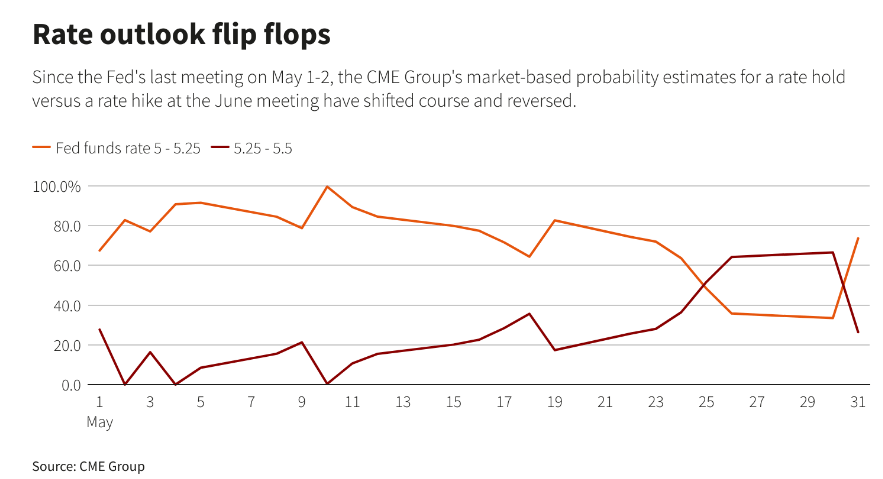
Fourth , let's focus on Fed now. Imagine that a recession does not occur in 2H 2023 as I expect. The sustained wage growth and negative productivity could force the Fed to deal with the inevitable consequences of pushing inflation back to 2%, which would require raising the funds rate to 6.5% and pushing unemployment to 4.5% - this is what Steve Blitz from TS Lombard writes in his recent note [June 2, 2023 - proprietary source]. It's important to note that the real funds rate has not yet contracted, according to the Fed's own standard. Richard Excell also mentions that Fed Chair Jay Powell intends to slow inflation through the labor channel, and the recent strong jobs data complicates this approach. The market has adjusted the odds of an interest rate hike in June and July slightly lower based on the data.
I think the Fed should continue to send negative signals to the market because its work isn't yet complete.
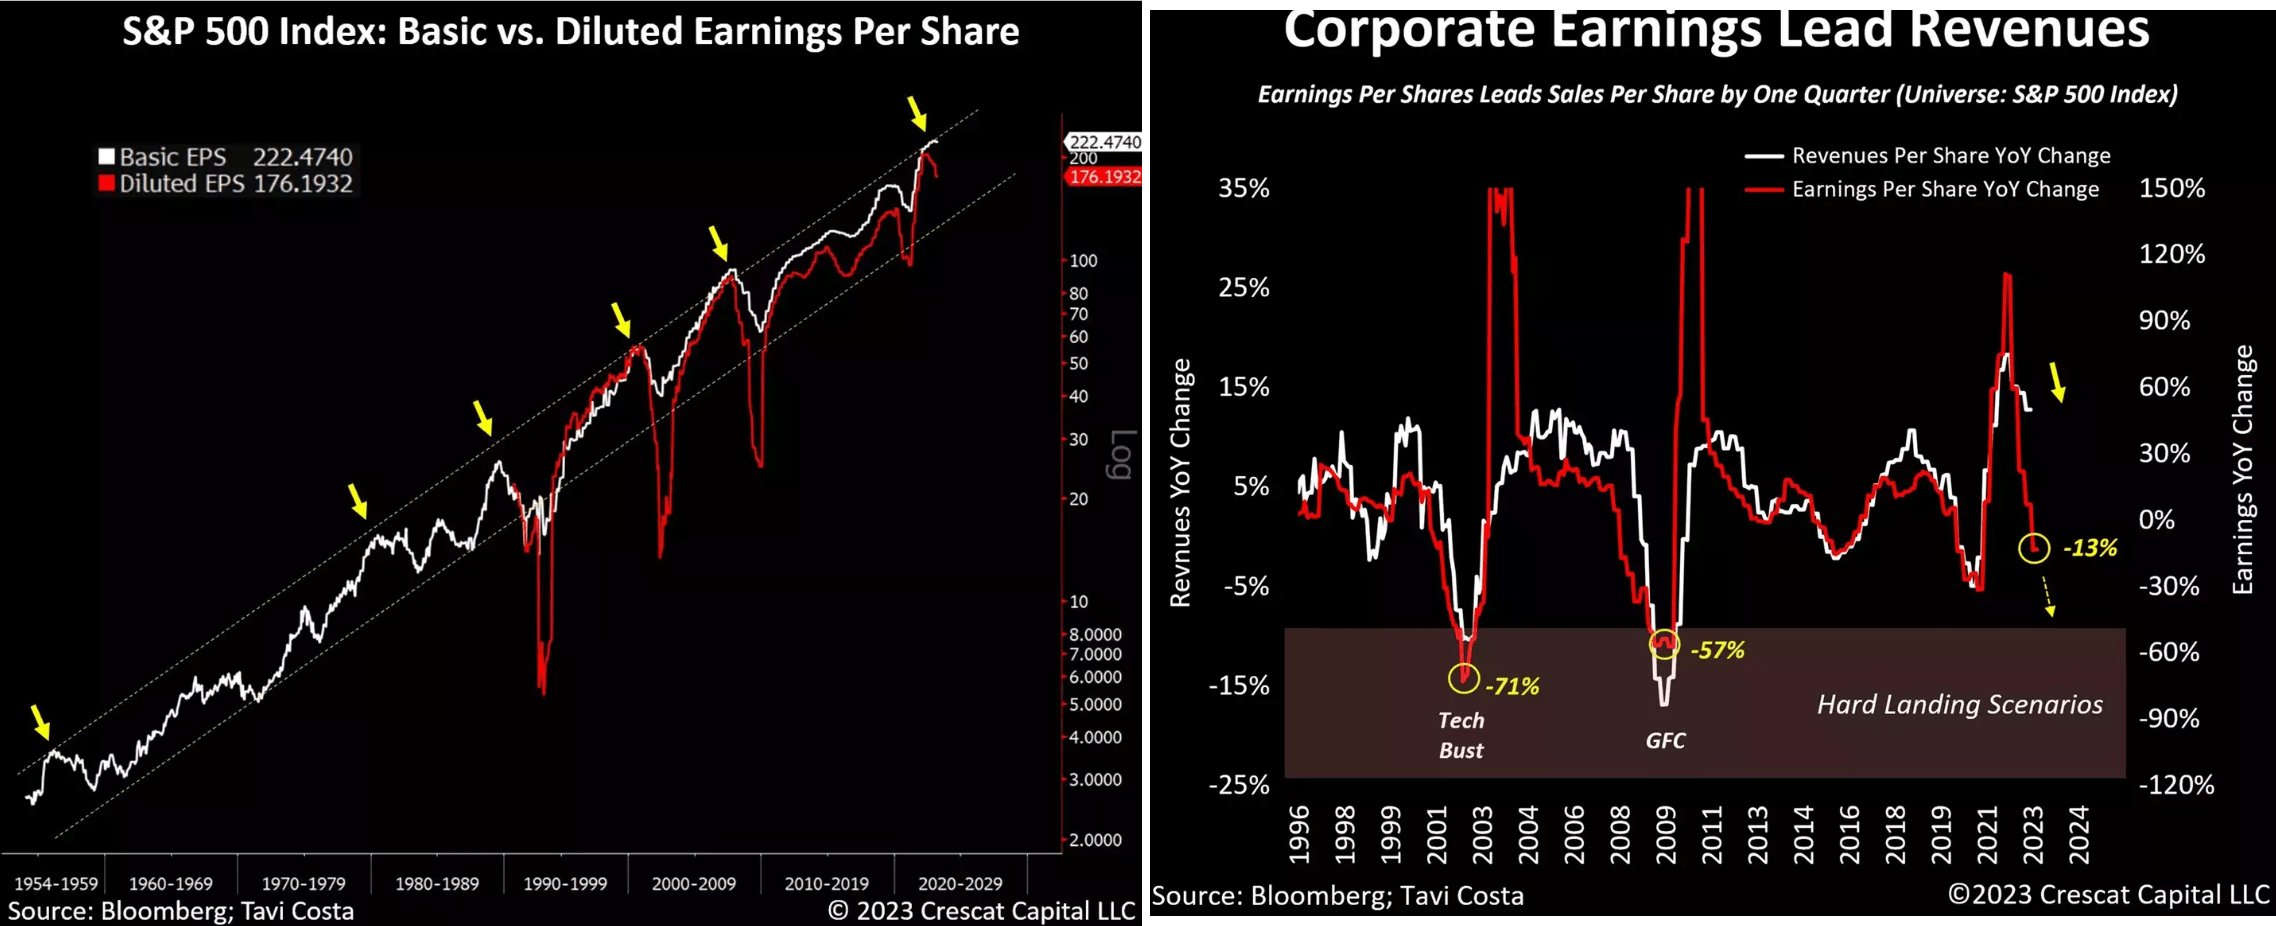
Now a few words about liquidity. The recent suspension of the US debt ceiling allows the country to accumulate new debt on a net basis. So the US Treasury is expected to issue a large number of bills in the coming weeks and months to raise funds quickly. This strategy has been used in the past when the debt ceiling was lifted or suspended, Andreas Steno Larsen writes in his most recent newsletter. However, the duration of the new debt will be gradually extended over the next few quarters to minimize its impact on the markets. But under some specified assumptions, there should be a net reduction of global liquidity of roughly $1.2 trillion for the rest of FY2023, SA fellow Pragmatic Value Investing writes in his recent article on the subject. All in all, such an outflow is a very negative premise for the SP500, which now seems grossly overvalued in terms of its ability to generate inflation-adjusted EPS figures:
And that's against the backdrop of a probable peak cycle in EPS growth, where changes in EPS typically precede changes in revenue growth by about a quarter. Recent reports show that corporate earnings are down 13%. Comparing this trend to previous slump scenarios such as the tech bust and the global financial crisis, Crescat Capital notes that profits have fallen 71% and 54%, respectively. May AI hype hold the sales growth where it's now this time around? I doubt it.
The Bottom Line
In my article, I've tried to look at leading indicators that give an indication of the future macroeconomic situation. I'm not trying to time the market as many have suggested in the comments under my last macro article. I'm just pointing out things that could cause big problems with your long positions in the foreseeable future. I'm not calling for shorting the bubble that has been created - that is too dangerous. But to scale positions in such a market environment I think is absolutely crazy.
Of course, I could be wrong again with my updated sell thesis, as has been the case the last few times. The history of the various bubbles in the history of the stock market shows that the burst doesn't occur when everyone expects it but at the most unexpected moment. The approaching recession has been called the most anticipated in history - perhaps the resulting positioning will become a kind of "contrarian protection" for the bulls for many months forward.
But looking at the fundamental picture, I see no evidence that we should be buying now. I'm mostly concerned about consumer behavior and their spending plans - they're the main driver of the economy, the state of which doesn't bode well at the moment. So I rate the broader stock market as "Sell" again today.
Thank you for reading! Please, let me know what you think in the comment section below!
For further details see:
SPY: The Bubble Keeps Swelling