MCD - Starbucks: Some Reasons To Rethink Your Position
2023-12-01 05:45:52 ET
Summary
- Starbucks grew its global store count at a CAGR of 6.6% over the past decade and targets 6% growth until 2030.
- The company was able to increase prices slightly above global GDP growth (3.5%), while same-store traffic declined since FY14.
- Revenue grew at a CAGR of 8.2% since FY17 while net income only grew at 5.2% due to declining margins.
- Future growth is heavily reliant on the Chinese market.
- My DCF calculation indicates that SBUX might be overvalued at the current price.
Introduction
I bought my first Starbucks (SBUX) shares in the middle of March 2022, the time when headlines about unionization fears were present every day, at around $84 per share. I will be completely transparent: My investment case back then was that Starbucks has a strong brand, generates solid returns on capital, has quite some runway for growth through opening new stores and traded at a dividend yield of above 2.3% which is higher than the historical average. That was it. I only bought a small position and planned to (a) do a more thorough analysis in case it dropped lower and (b) increase my position if that analysis came to a positive conclusion. Due to work-related time constraints throughout the remainder of 2022, I did neither of these two things. I recently reviewed my portfolio and the now still small SBUX position came up for a review. In this article, I want to take you along on my thoughts about what to do with this position.
Business Overview
Since most people should be aware of SBUX, at least the brand, I will keep this short. SBUX divides its segment reporting into three segments: (1) North America, (2) International and (3) Channel Development.
North America and International form what SBUX is known for: The stores all around the world where SBUX sells beverages (mainly coffee) and food. SBUX operates in 86 markets, with the most restaurants in the U.S., China, Korea and Japan. As of right now, SBUX operates 19,592 stores itself while having another 18,446 stores being managed by franchisees. So the total store count stands at 38,038 right now. The company-operated stores are limited to the U.S., Canada, China, Japan and the U.K. while the franchisees operate all over the world.
In Channel Development, SBUX sells roasted whole beans, Starbucks-branded single-serve products and other ready-to-drink beverages. Here is what SBUX says about this segment in the most recent 10-K report:
A large portion of our Channel Development business operates under a licensed model of the Global Coffee Alliance with Nestlé, while our global ready-to-drink businesses operate under collaborative relationships with PepsiCo, Inc., Tingyi-Ashi Beverages Holding Co., Ltd., Arla Foods amba, Nestlé and others.
Source: SBUX 10-K report - Item 1. Business - Segment Financial Information
I will dedicate a short chapter to this segment later. For now, let's start with my first topic: Footprint Growth.
Footprint Growth
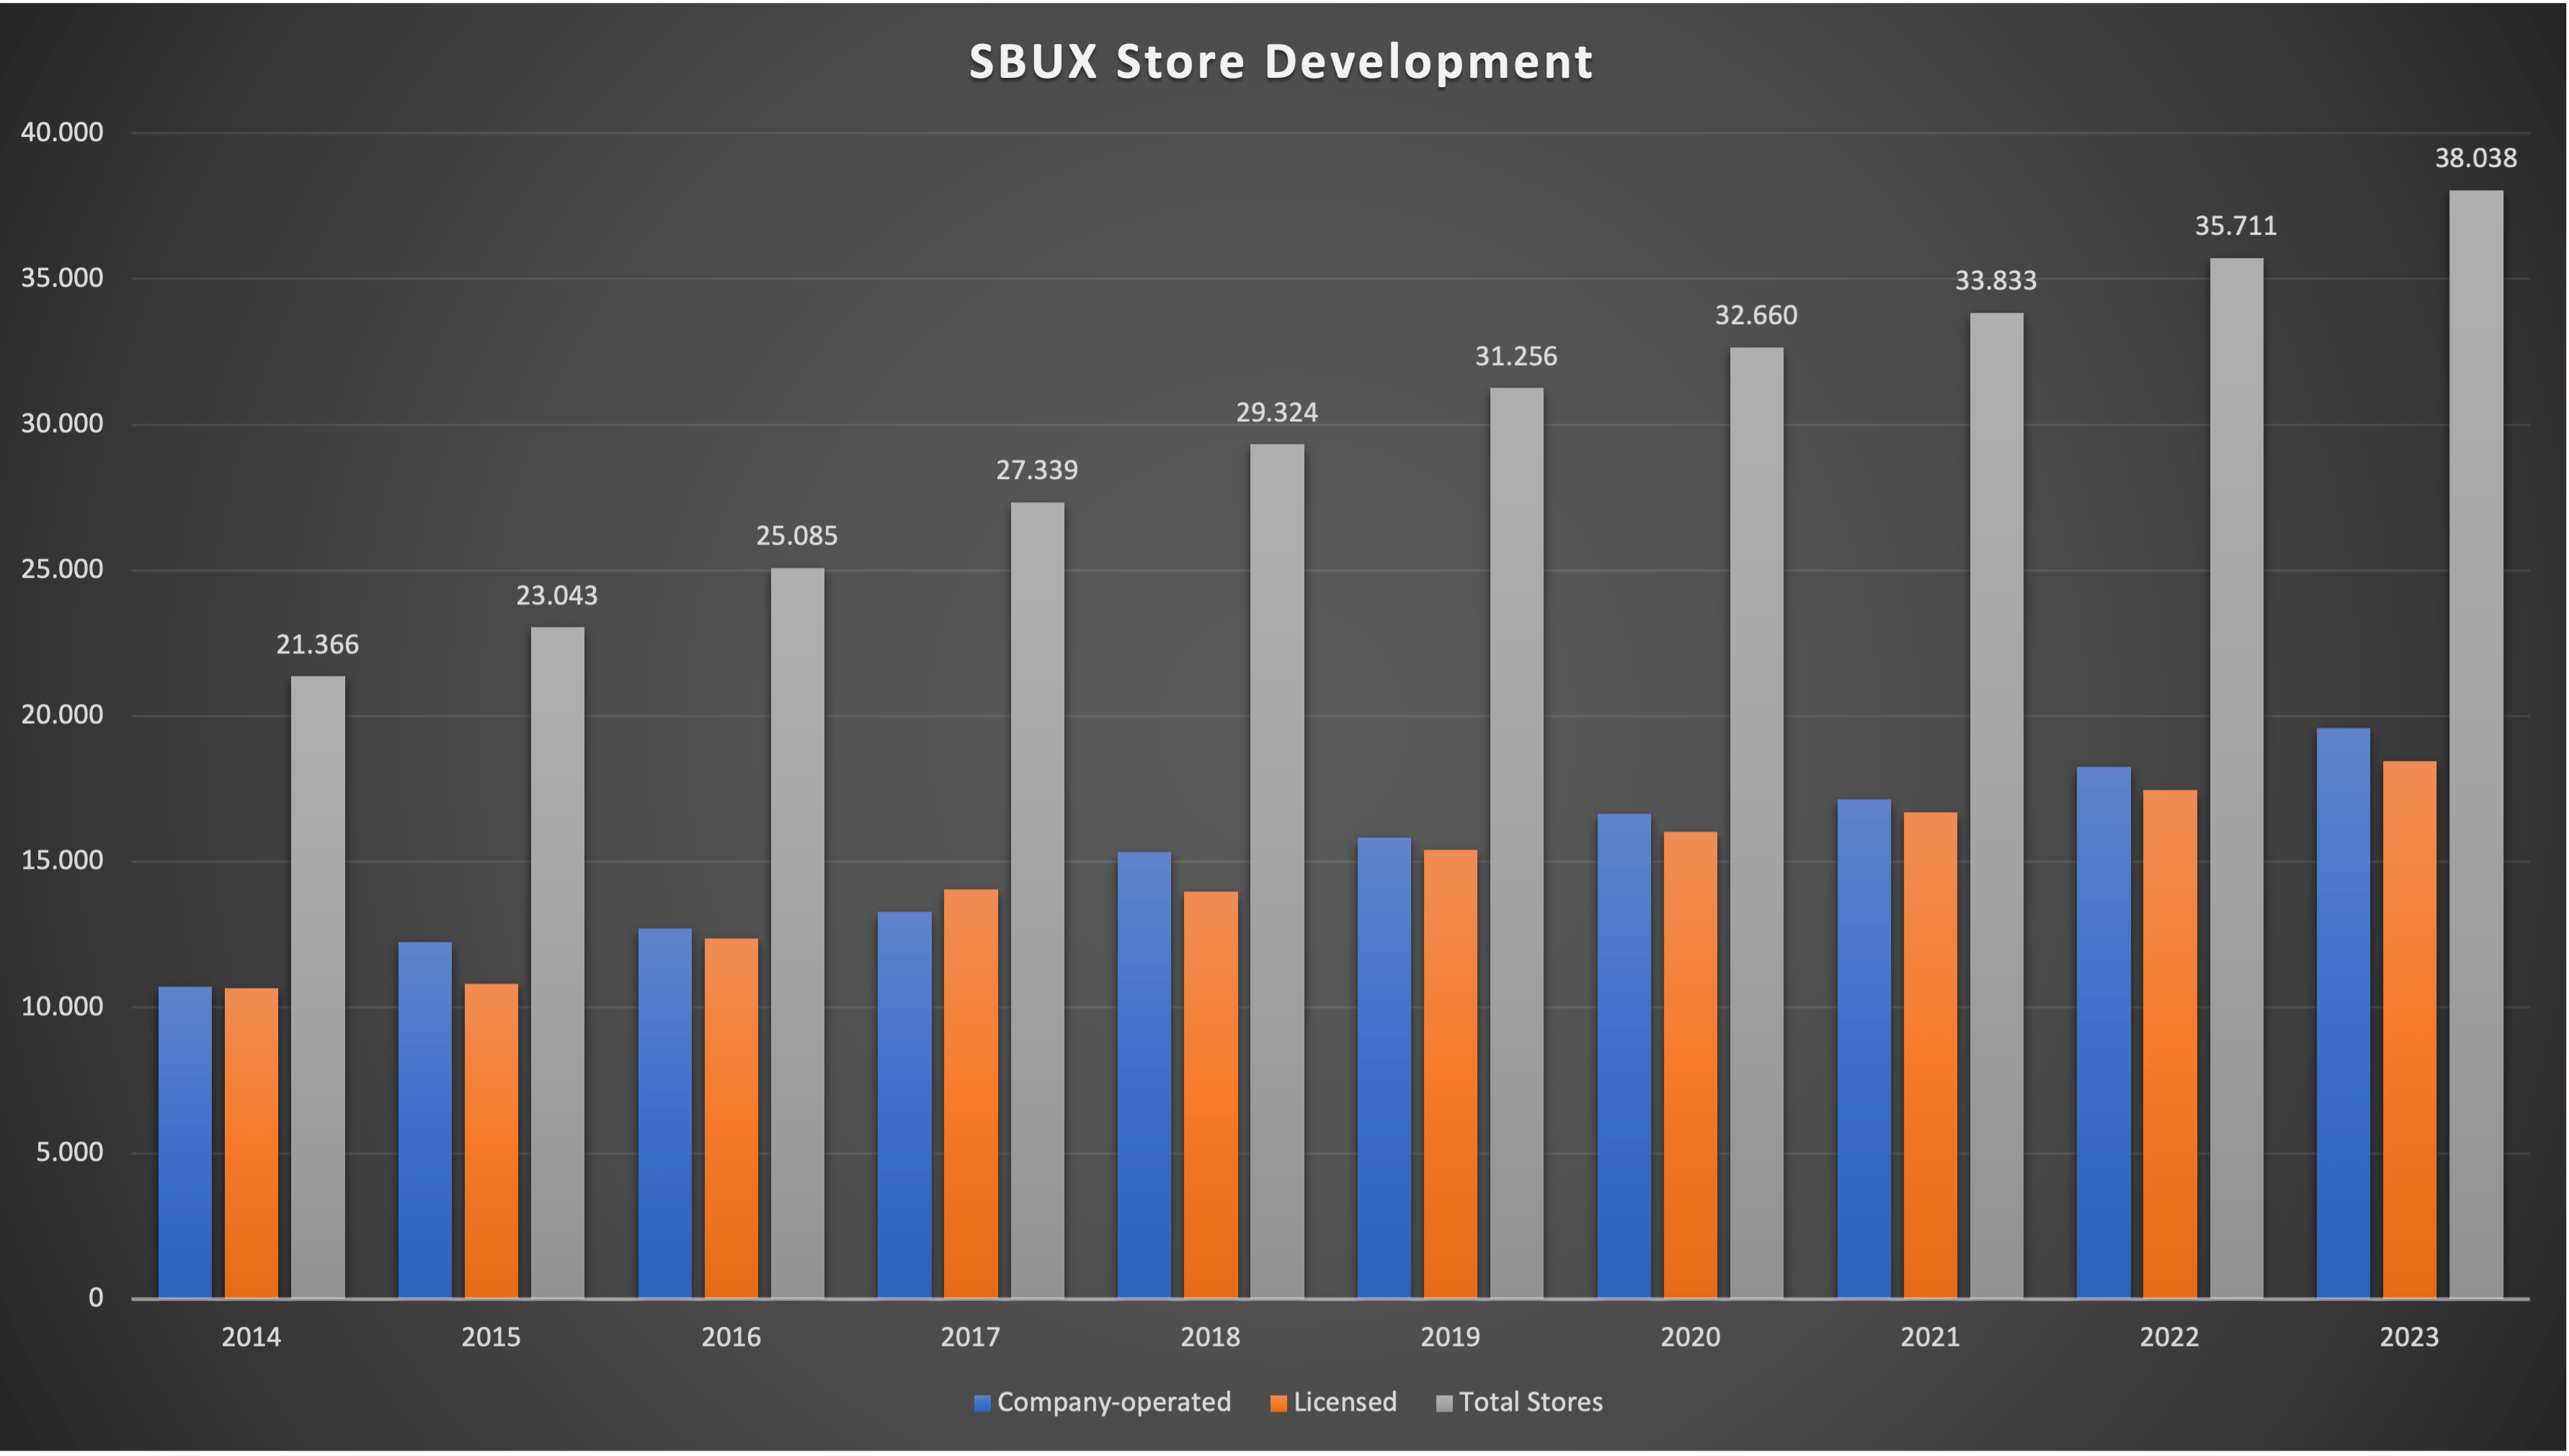
When I talk about "Footprint Growth", I am referring to store or square feet growth. In this case, I will only refer to store growth. I want to start with a chart showing SBUX store growth, differentiated by company-operated and licensed stores:
SBUX Total Stores since FY14 (Company 10-K - compiled by Author)
SBUX was able to consistently grow its store count throughout the last decade. The growth rate came in at 6.9% CAGR for company-operated stores, 6.3% for Licensed stores and 6.6% for total stores.
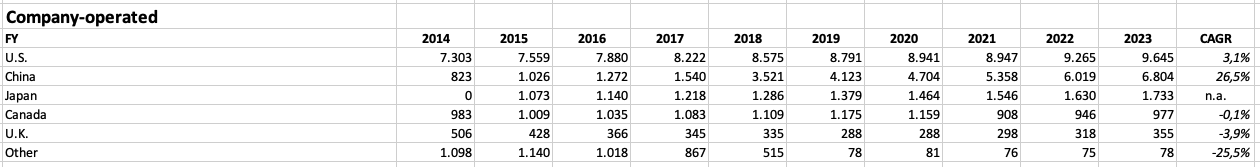
Here is a table showing the composition of company-operated stores by region since 2014:
SBUX Company-operated Stores by Region (Company 10-K - compiled by Author)
Some more information for this table: In 2018, SBUX bought the East China Joint Venture which led to a large increase in Chinese company-operated stores. In 2015, SBUX acquired Starbucks Japan and started to operate the Japan stores itself. In 2019, the stores in Thailand , France and the Netherlands were transferred to franchisees, leading to a drop in "Other" stores.
We can see that Canada stores are flat and U.K. stores declined (the franchised U.K. stores tripled over the same timeframe as we will see later), so for now we won't bother with them. SBUX focuses on footprint growth in company-operated stores in the U.S., China and Japan. U.S. stores grew at a CAGR of 3.1%, at half the rate of total company-operated stores. Japan stores grew at a CAGR of 6.2% since 2015, in line with the total company-operated store growth rate. What stands out is China, with store count increasing eight-fold since 2014 (partly due to the aforementioned East China JV acquisition). So in conclusion, company-operated store growth was and still is heavily reliant on the growth in the Chinese market. I am not sure if I like this. While China seems to be a huge growth opportunity, I don't want any of my portfolio companies to be too reliant on it. Let's keep going for now and take a look at the licensed stores.
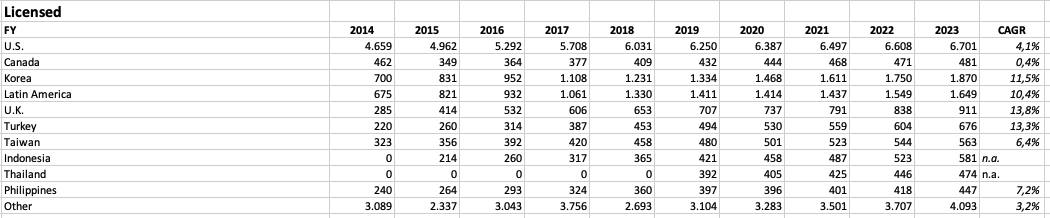
Here is a table showing the development of licensed stores since 2014:
SBUX Licensed Stores by Region (Company 10-K - compiled by Author)
Again some additional information: The drop in "Other" stores in 2015 was a result of the aforementioned acquisition of Starbucks Japan (the stores transitioned to company-operated stores). The 2018 drop in "Other" stores was due to the aforementioned acquisition of the East China JV.
Here we can see again that U.S. stores grew by only 4.1%, below the growth rate of total stores. We can already see a pattern here. SBUX is heavily reliant on International store growth. Subsequently, the highest store growth rates came from International markets: 11.5% CAGR in Korea, 10.4% CAGR in LATAM, 13.8% CAGR in the U.K. and 13.3% CAGR in Turkey.
So there is one really simple conclusion to make. SBUX future store growth will be dependent on International markets.
And what does SBUX expect? In early November, SBUX gave an investor presentation called "Starbucks 2023 Reinvention Update and Holiday Launch " where they presented the outlook over the next years. I will refer back to this as "the Investor Day" throughout this article so keep this presentation open if you want to follow along. SBUX expects the following going forward:
- 4% annual store growth in the U.S. (slide 22)
- 10% store growth in International over the next 3 years (slide 51)
- 35,000 stores in International by 2030 (slide 65), indicating 8% annual store growth from 2023 to 2030
If we combine the 4% annual store growth in the U.S. and the 8% store growth in International, overall store growth should be a bit above 6% because the International store count is higher than the U.S. store count. In conclusion, the longer-term growth outlook for stores is a bit lower than store growth in the past (6.6%), albeit still on a high level.
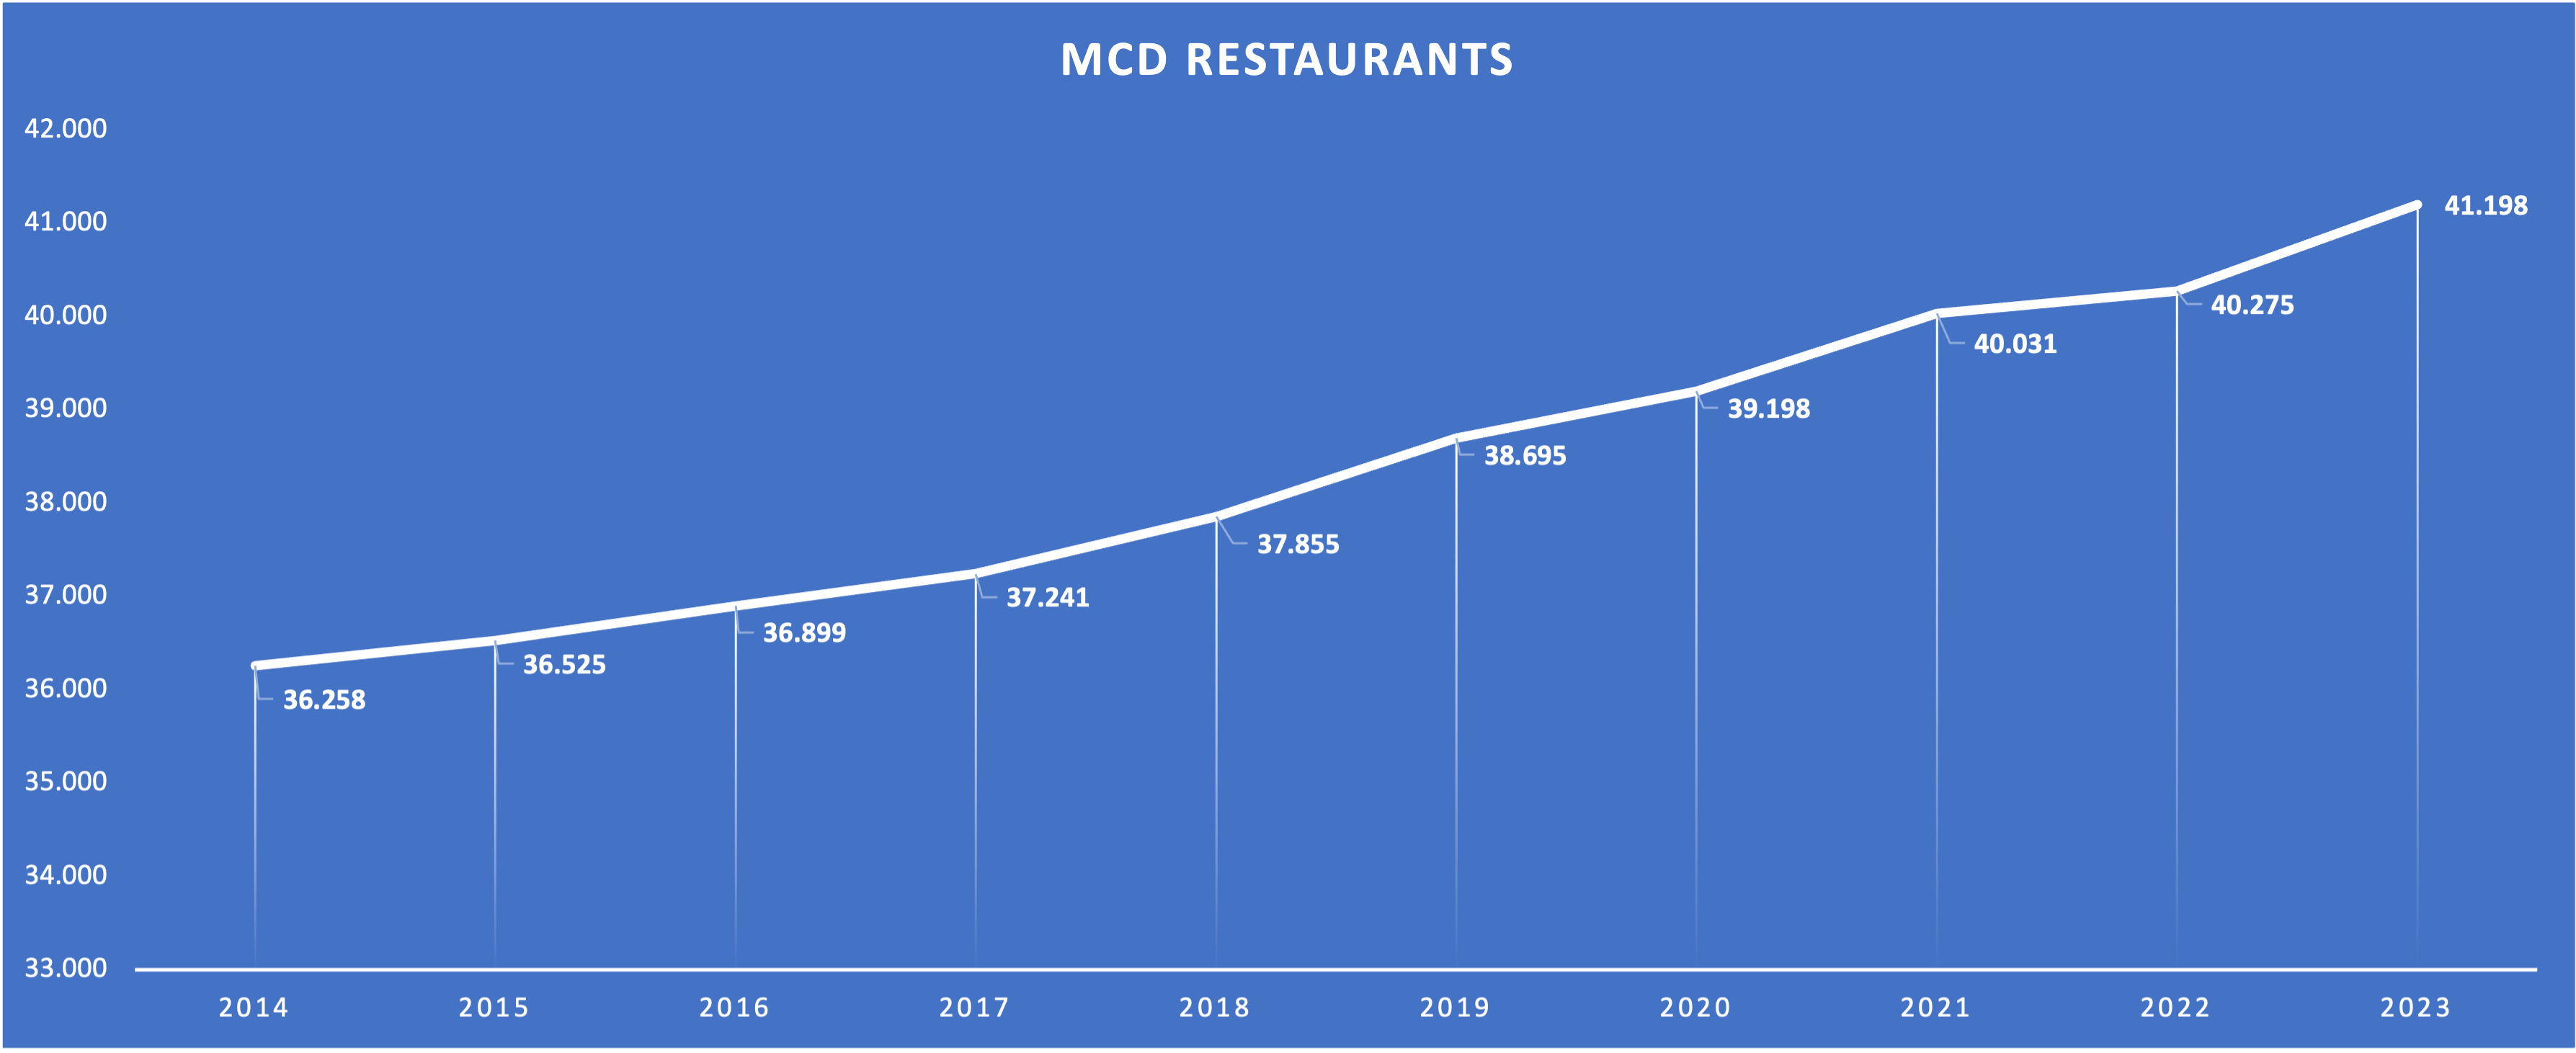
Now let's change gears and talk about the achievability of these goals. Here is a chart showing the development of restaurants for McDonald's (MCD):
MCD Restaurant Count since 2014 (MCD 10-K - compiled by Author)
MCD grew its restaurant count at a CAGR of only 1.4% over the past decade. SBUX's current total store count (38,038) is a bit above 2014 levels for MCD. I know this isn't the best comparison but still, I think that SBUX store growth targets might be too optimistic. Hence, I will assume 5% store growth going forward (which is still optimistic in my opinion). Even if they achieve these ambitious numbers, there will come a time when store count growth will be closer to what MCD has shown over the past decade. What happens then? This is where other factors come into play. Mainly what I will call "Price" and "Traffic", usually known as same-store sales growth.
Same-Store Sales Growth
As I mentioned above, I will differ between Price and Traffic. Price refers to growth through price increases. Traffic refers to same-store foot traffic, expressed by what the company calls an "increase/decrease in comparable transactions". Let's start with a simple chart showing overall same-store sales growth over the past decade:
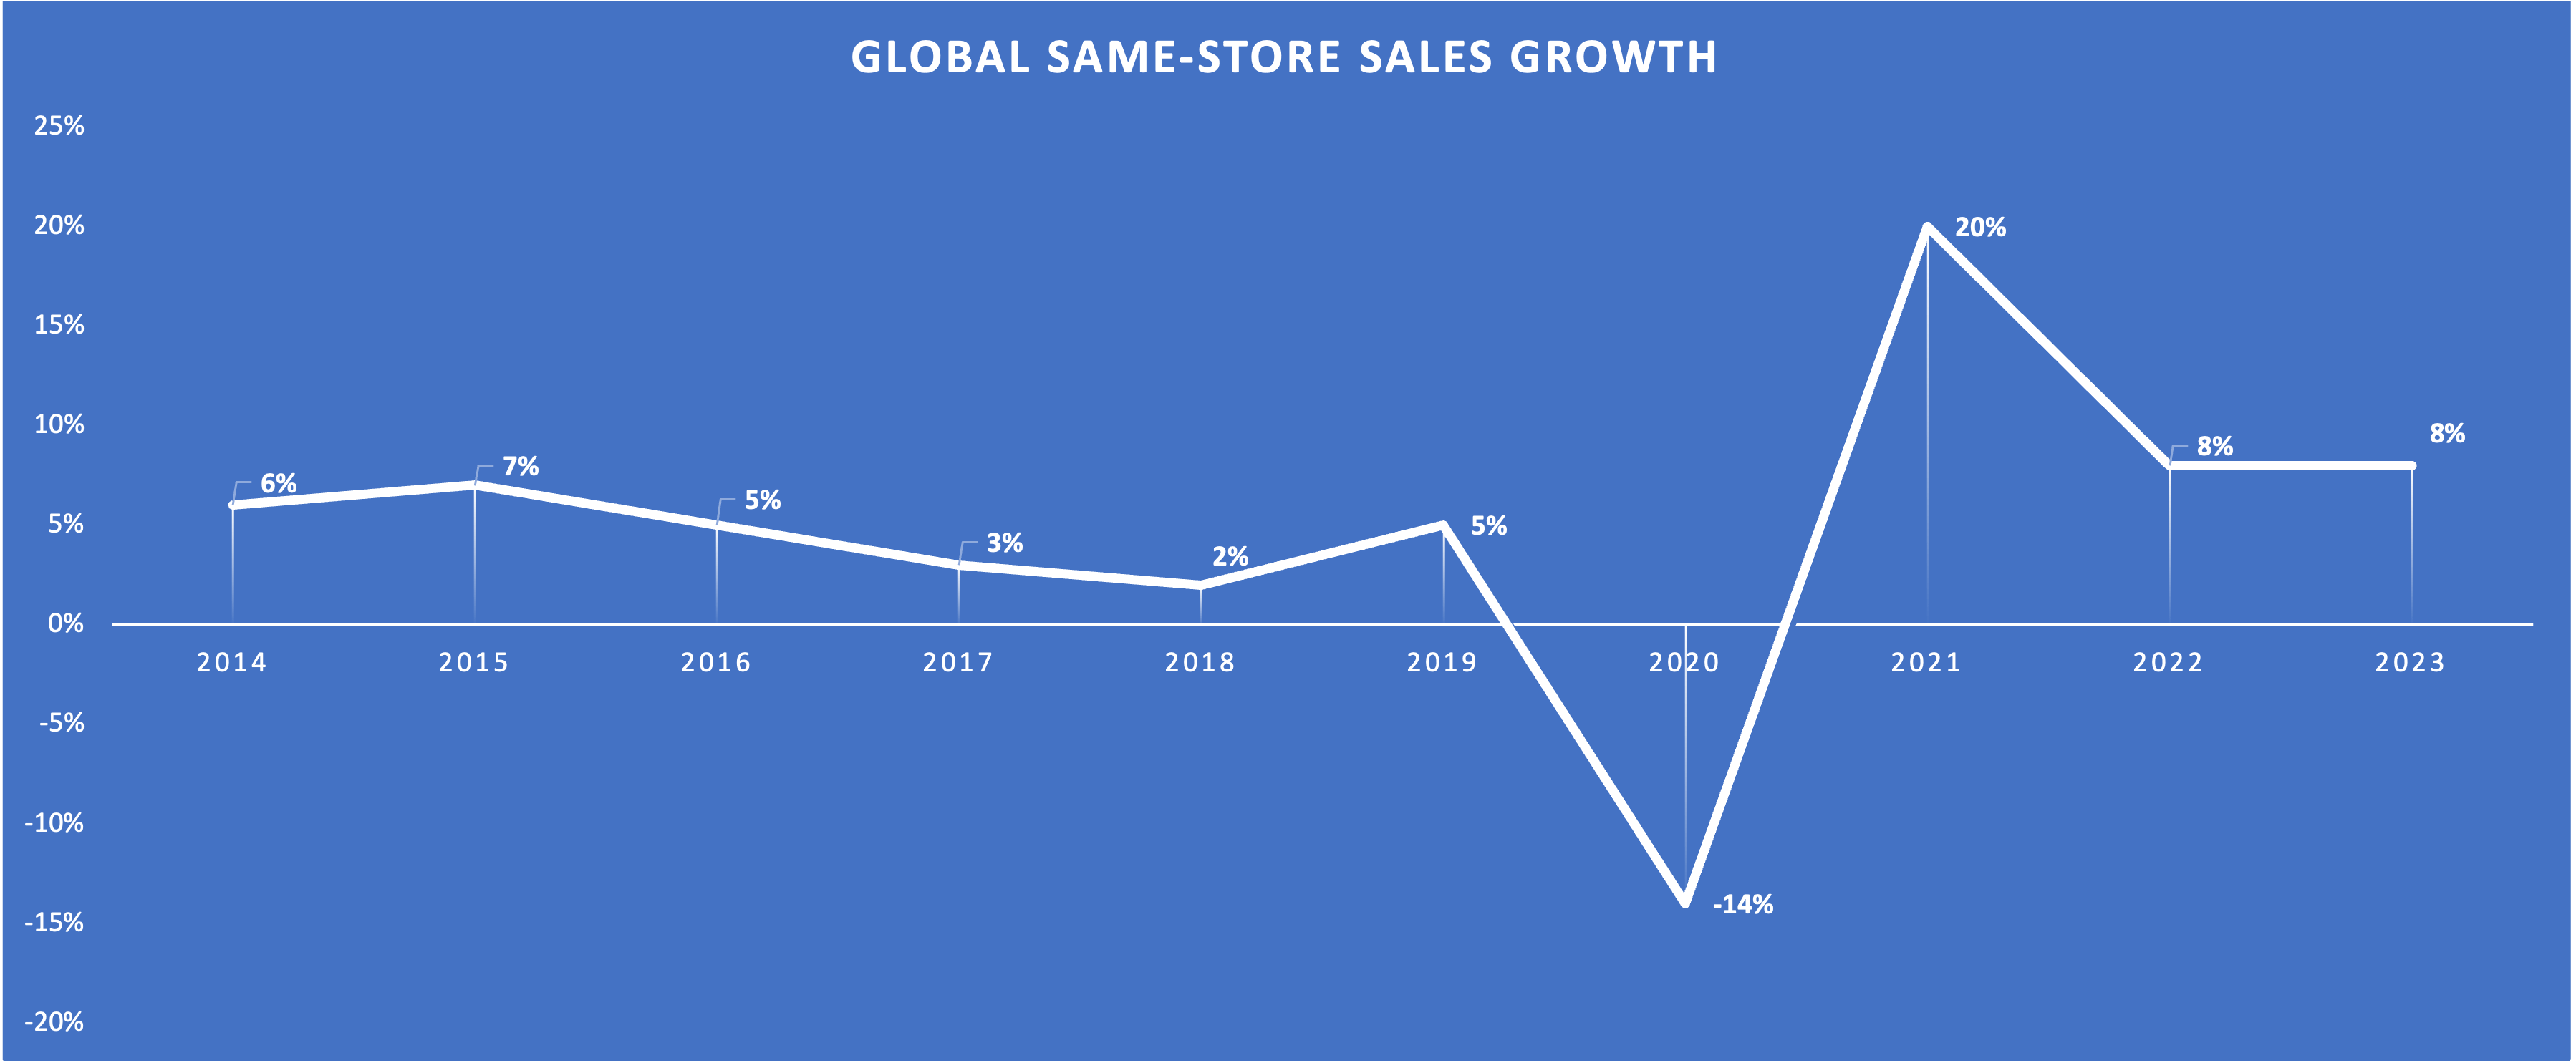
Global Same-Store Sales Growth (Company Reports - Compiled by Author)
We can see that the growth has been in the mid-single-digits before taking the hit of the pandemic. There was a rebound in 2021 and in 2022/2023 we saw decent growth due to heightened inflation.
This is where it gets interesting. Let's separate the two growth drivers. Here is a chart showing the "Price" component:
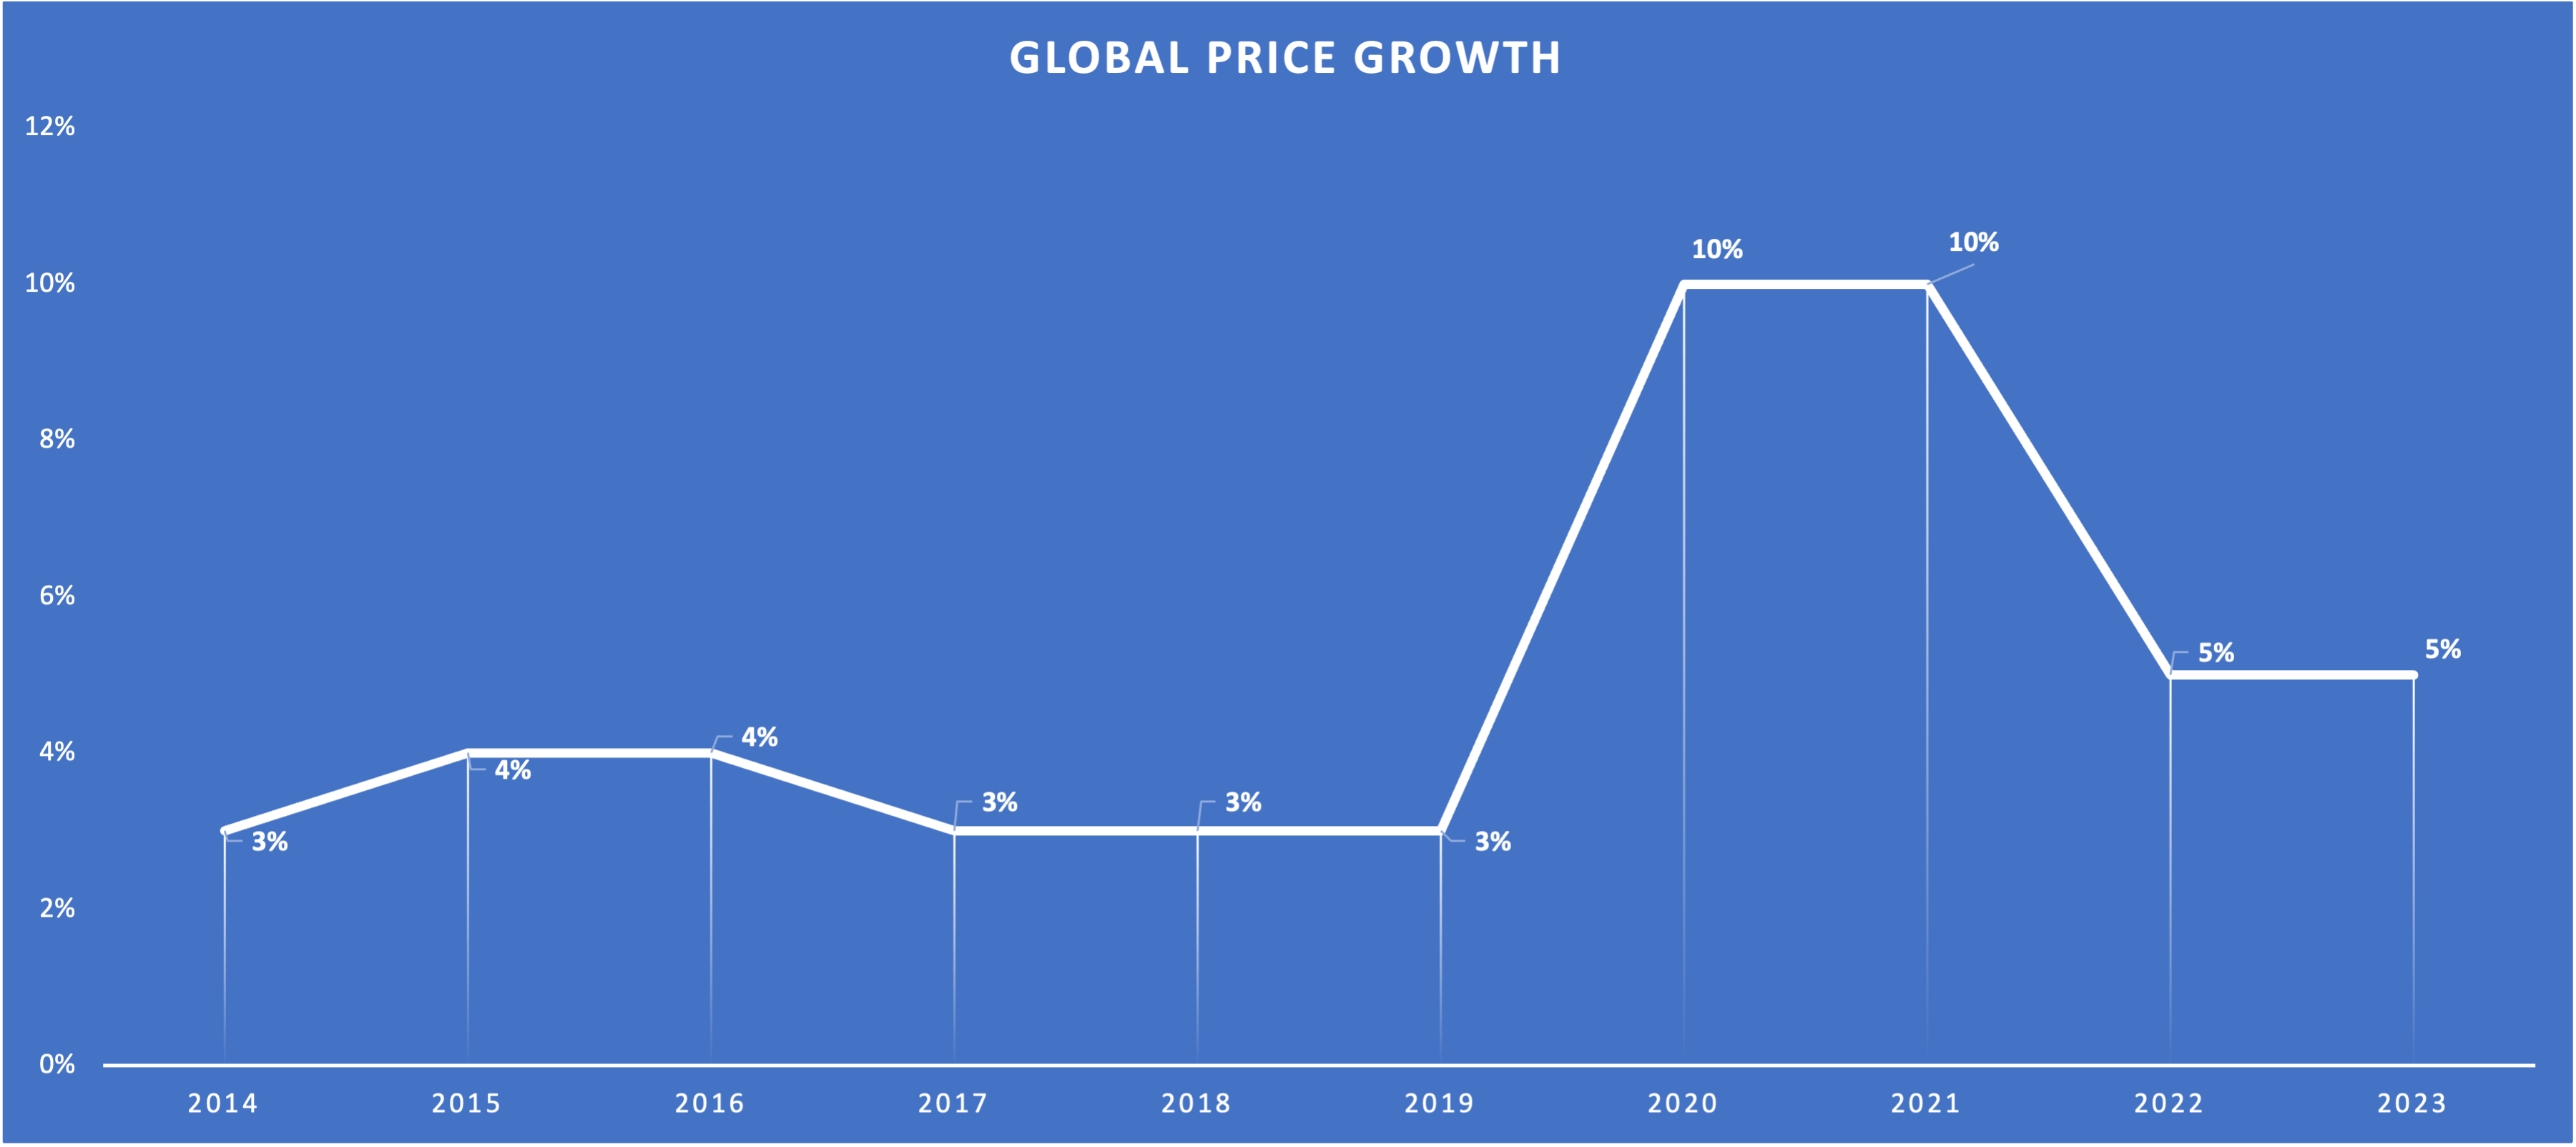
Global "Price" Growth (Company Reports - Compiled by Author)
If you had a look at my previous works on health insurance companies that I posted throughout this summer, you might have noticed that I assumed future organic growth to be the sum of (1) the insurance-eligible population and (2) pricing power. This is also the case for SBUX, only that insurance-eligible population can be replaced with "Traffic". For the insurance companies, I guessed that pricing power should be a bit above GDP growth (due to health insurance being a non-discretionary expense), so around 4%. In the chart above, we can see that the same seems to be true for SBUX. One might argue that a cup of coffee isn't non-discretionary, it seems to be for SBUX customers. The years since the pandemic were years of heightened inflation and commodity prices. If we look at the pre-pandemic numbers, SBUX pricing power seems to be in the range of 3-4%, exactly 100 basis points above the estimated GDP growth of 2-3%. In conclusion, growth through pricing power should track or slightly exceed GDP growth. I will just assume 3.5% for now.
Now let's take a look at the same chart for the "Traffic" component:
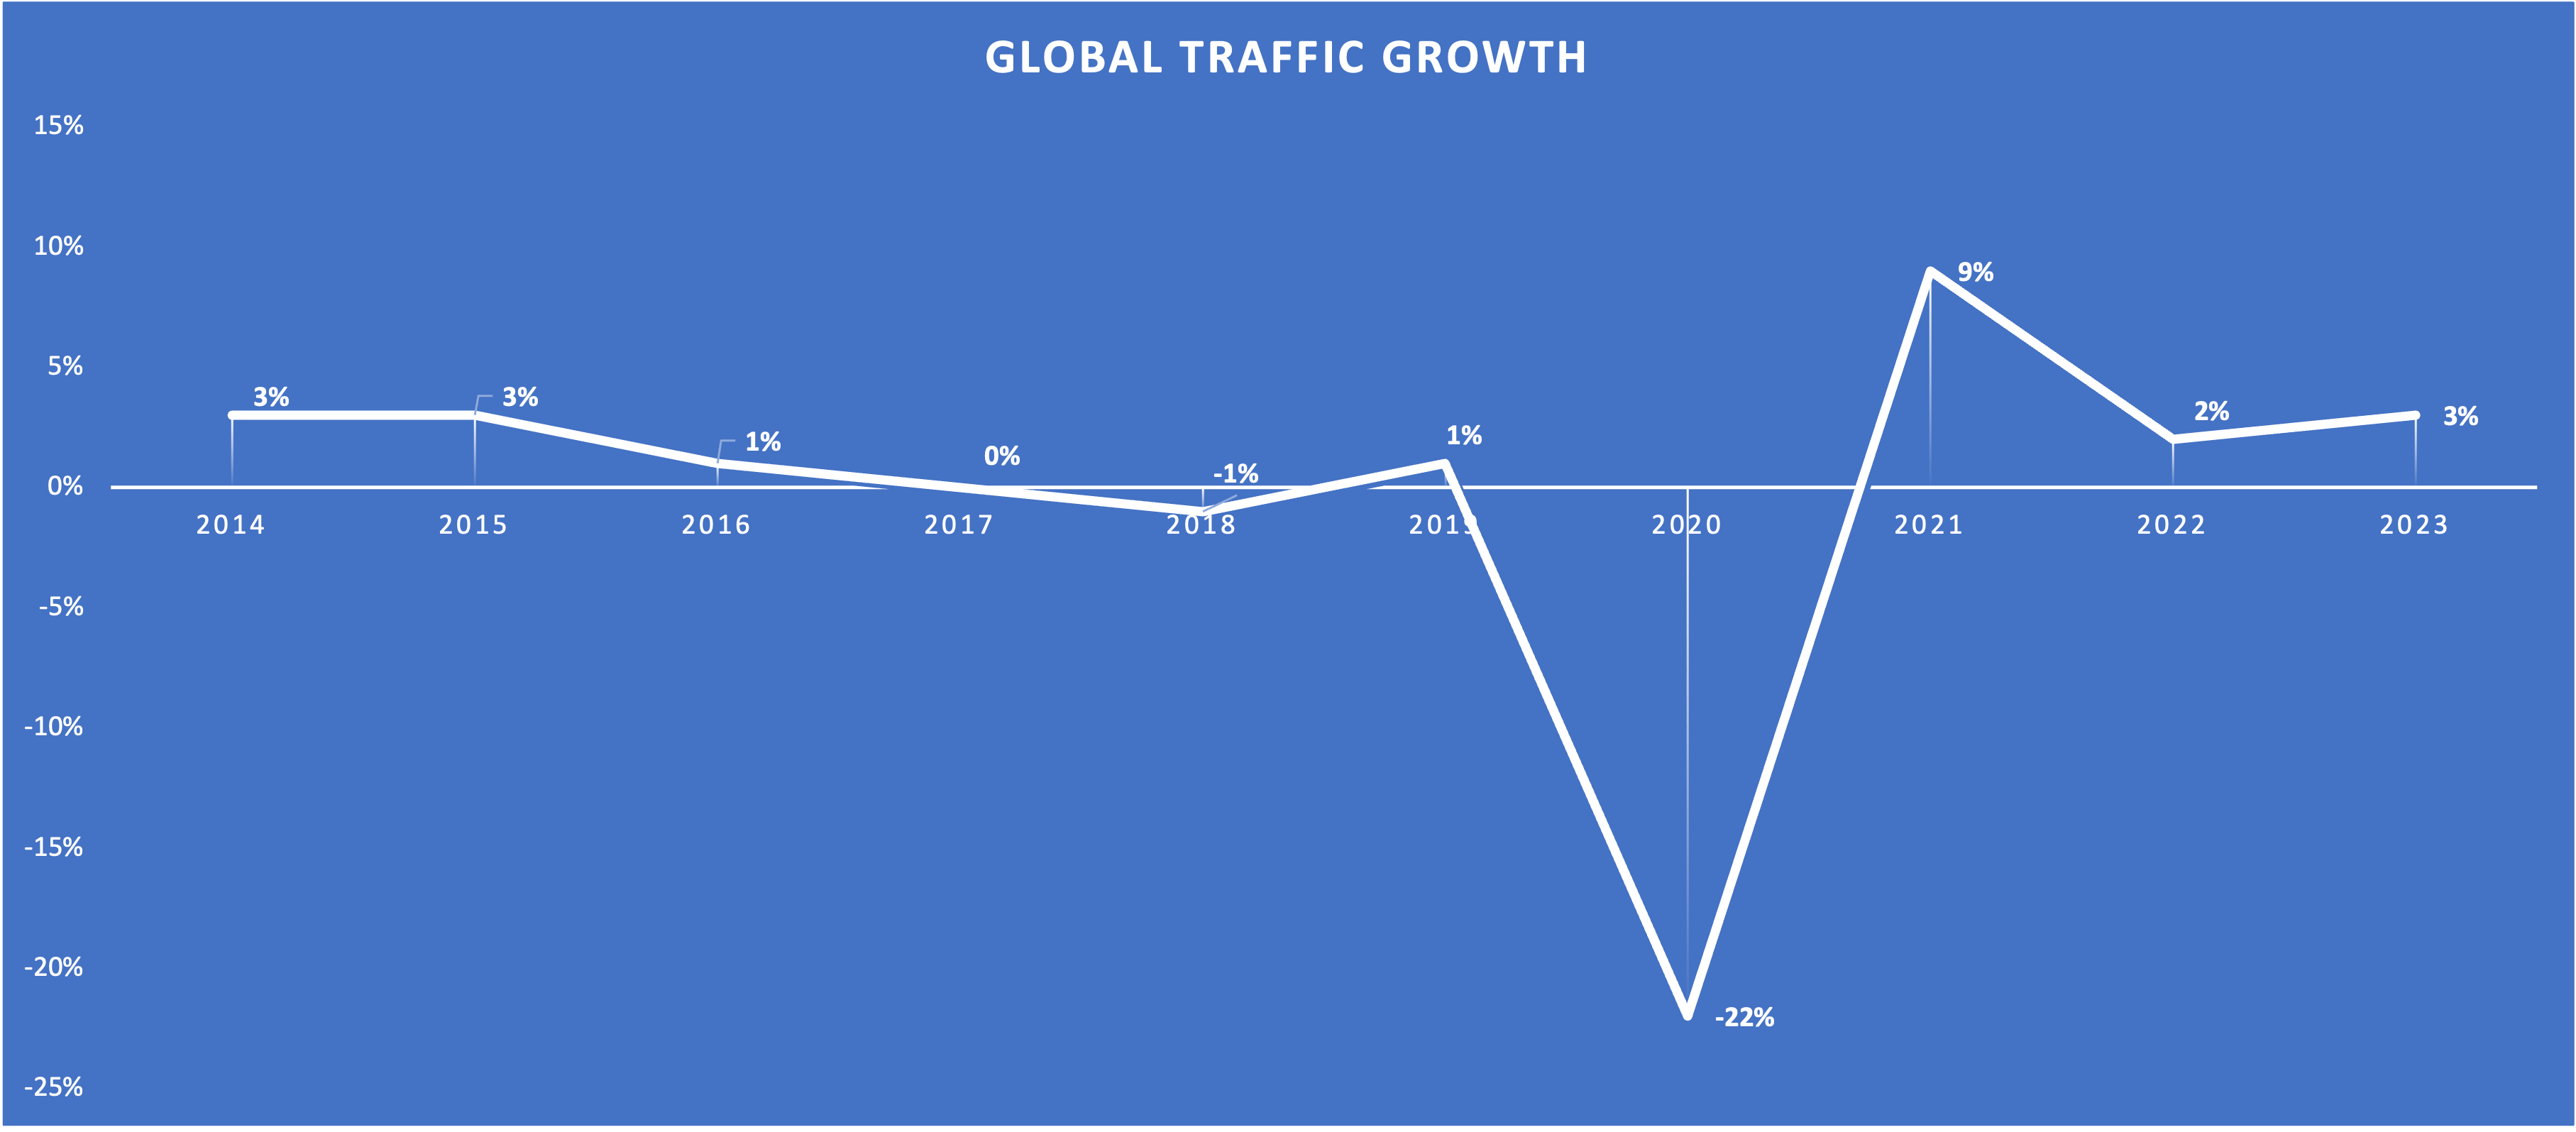
Global "Traffic" Growth (Company Reports - Compiled by Author)
This was an eye-opening chart for me. Here we can see that Traffic growth has been close to non-existent over the past decade. Let's assume SBUX made 1,000 transactions in FY2014. If we apply the above Traffic YoY growth rates, FY2023 transactions would be 929, 7% lower than FY2014. This means that over the long term, traffic for older stores declined. This is not healthy at all. We can also see that the customers SBUX lost due to the pandemic restrictions in FY2020 didn't come back (at least not all), indicating that the SBUX brand might not be that strong after all and that a cup of coffee from SBUX might be a discretionary expense for some. In conclusion, declining same-store traffic is a bad sign for the future.
I will further prove my point about declining traffic growth and make the issues that arise from this even clearer by looking at the operating margin. I took a look at the relationship between operating expenses (OPEX) and revenues. Here is the chart (limited to company-operated stores):
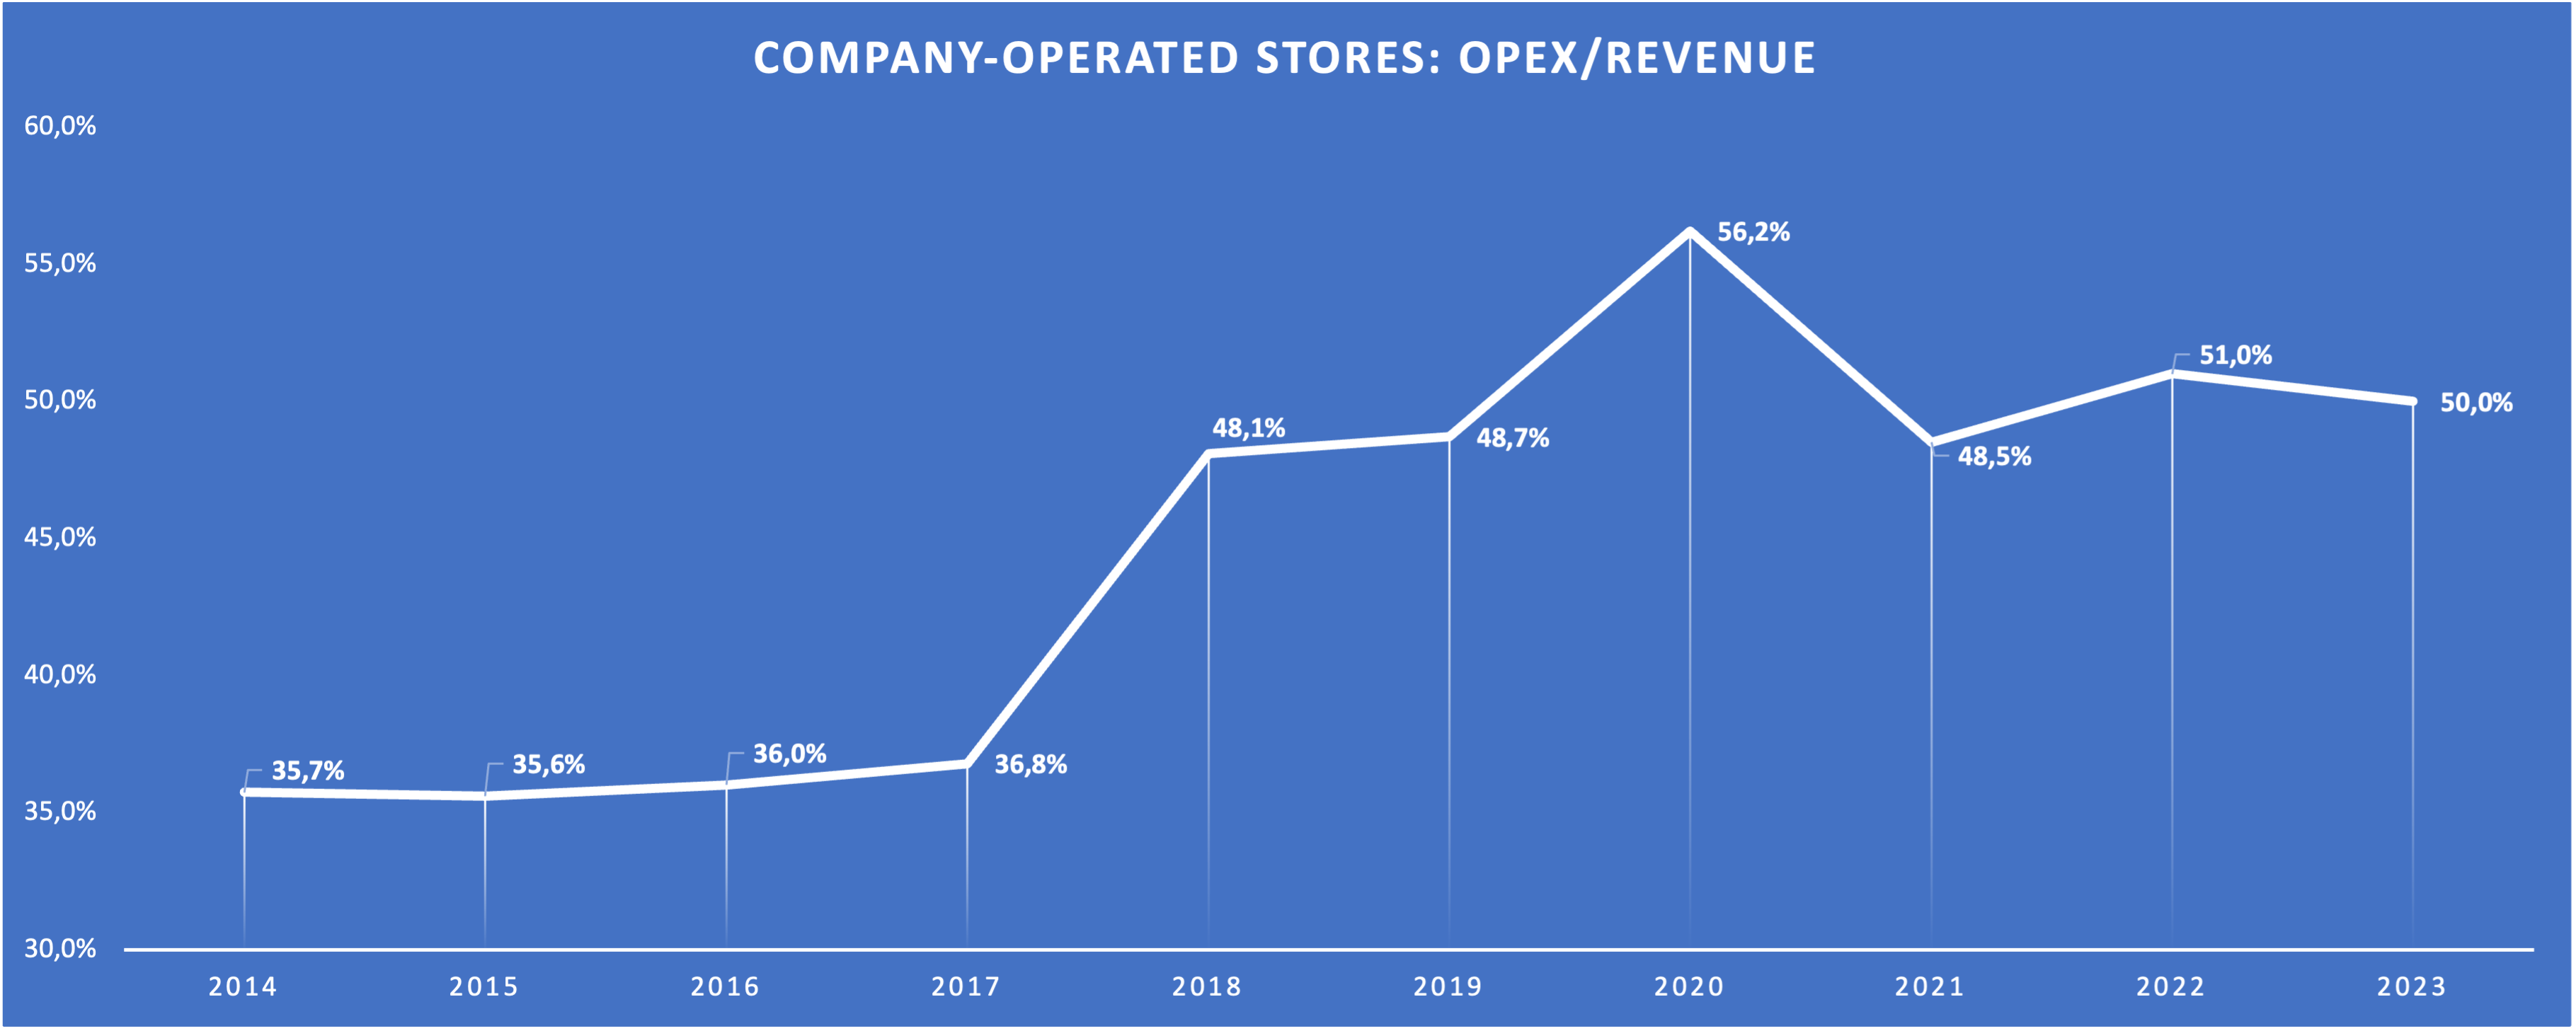
OPEX/Revenue for Company-Operated Stores (Company Reports - Compiled by Author)
Please note that there were accounting changes in FY2018 (SBUX moved some cost of sales to OPEX, I don't know why) so the transition from FY2017 to FY2018 is distorted. What we can see here is that (factoring out FY2020 as a pandemic outlier) SBUX operating expenses as a percentage of revenue increased over time (+100 basis points from FY14 to FY17; +190 basis points from FY18 to FY23). If we combine this information with my statements about declining same-store traffic above, this makes sense. If prices rise (revenue as well as OPEX) while same-store traffic declines, older stores will automatically become less profitable.
Let's again look at what SBUX has to say about this. At the Investor Day, SBUX highlighted the 100 basis points margin expansion (slide 68) that you can also see in my above chart. Here is the slide from the presentation which shows future margin targets:
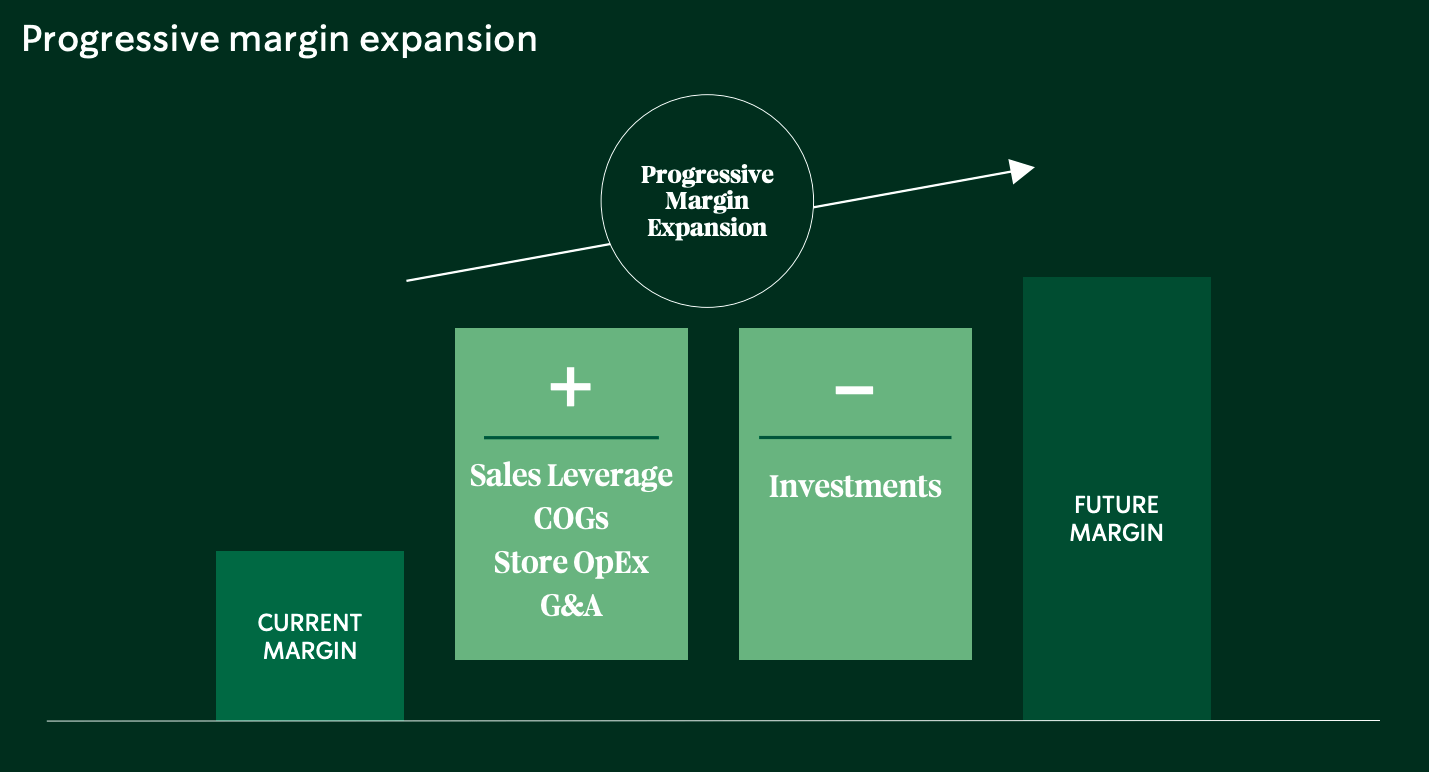
This is it. No numbers. SBUX CFO Rachel Ruggeri said that OPEX + cost of sales grew faster than revenue over the past three years due to the high inflationary environment. As I have shown in the chart above, the same was true from FY14 to FY17. SBUX plans to improve the margin on every level (COGS, OPEX, G&A). I wouldn't bet on that happening though. To be conservative, I will assume no margin expansion going forward.
Channel Development as the Savior?
I want to briefly address the "Channel Development" segment. As I highlighted in the Business Overview chapter, a large portion of this segment stems from a licensed model of the Global Coffee Alliance with Nestlé. SBUX only allows other companies to use the brand while collecting a royalty fee. This is by nature a great business model. This becomes clear when we look at the segment reporting in the 10-K filing:
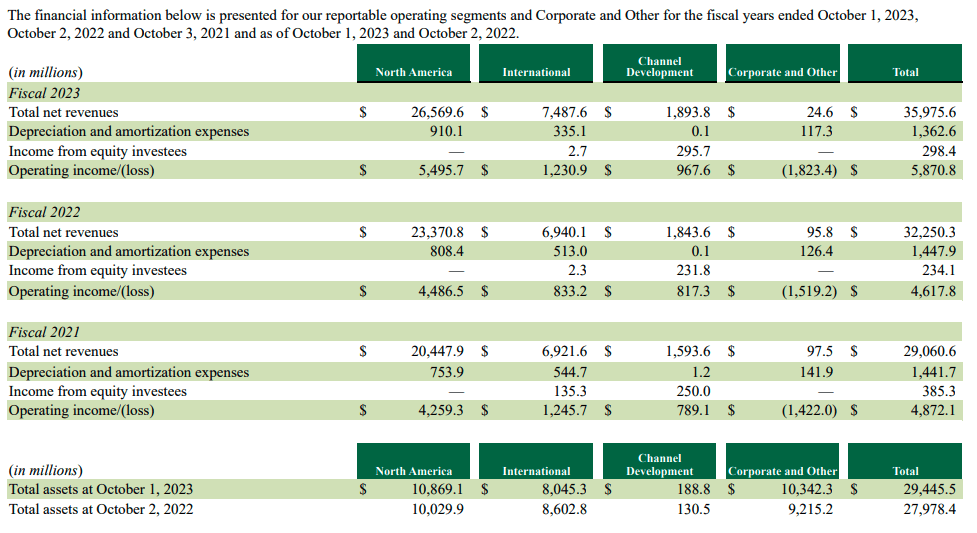
Here we can see that Channel Development contributed $967.6 million EBIT on $188.8 million of assets in FY23. That equates to a 512.5% Return on Assets (RoA), an incredible number. I have to add that SBUX assigns a large part of assets to the "Corporate and Other" segment (which is something that I don't like to see). This distorts numbers like RoA but it is still impressive. With $1,894.8 million in revenue and $967.6 million EBIT, the EBIT margin for this segment came in at 51.1%, again an impressive number. As I initially thought, this is a great business model.
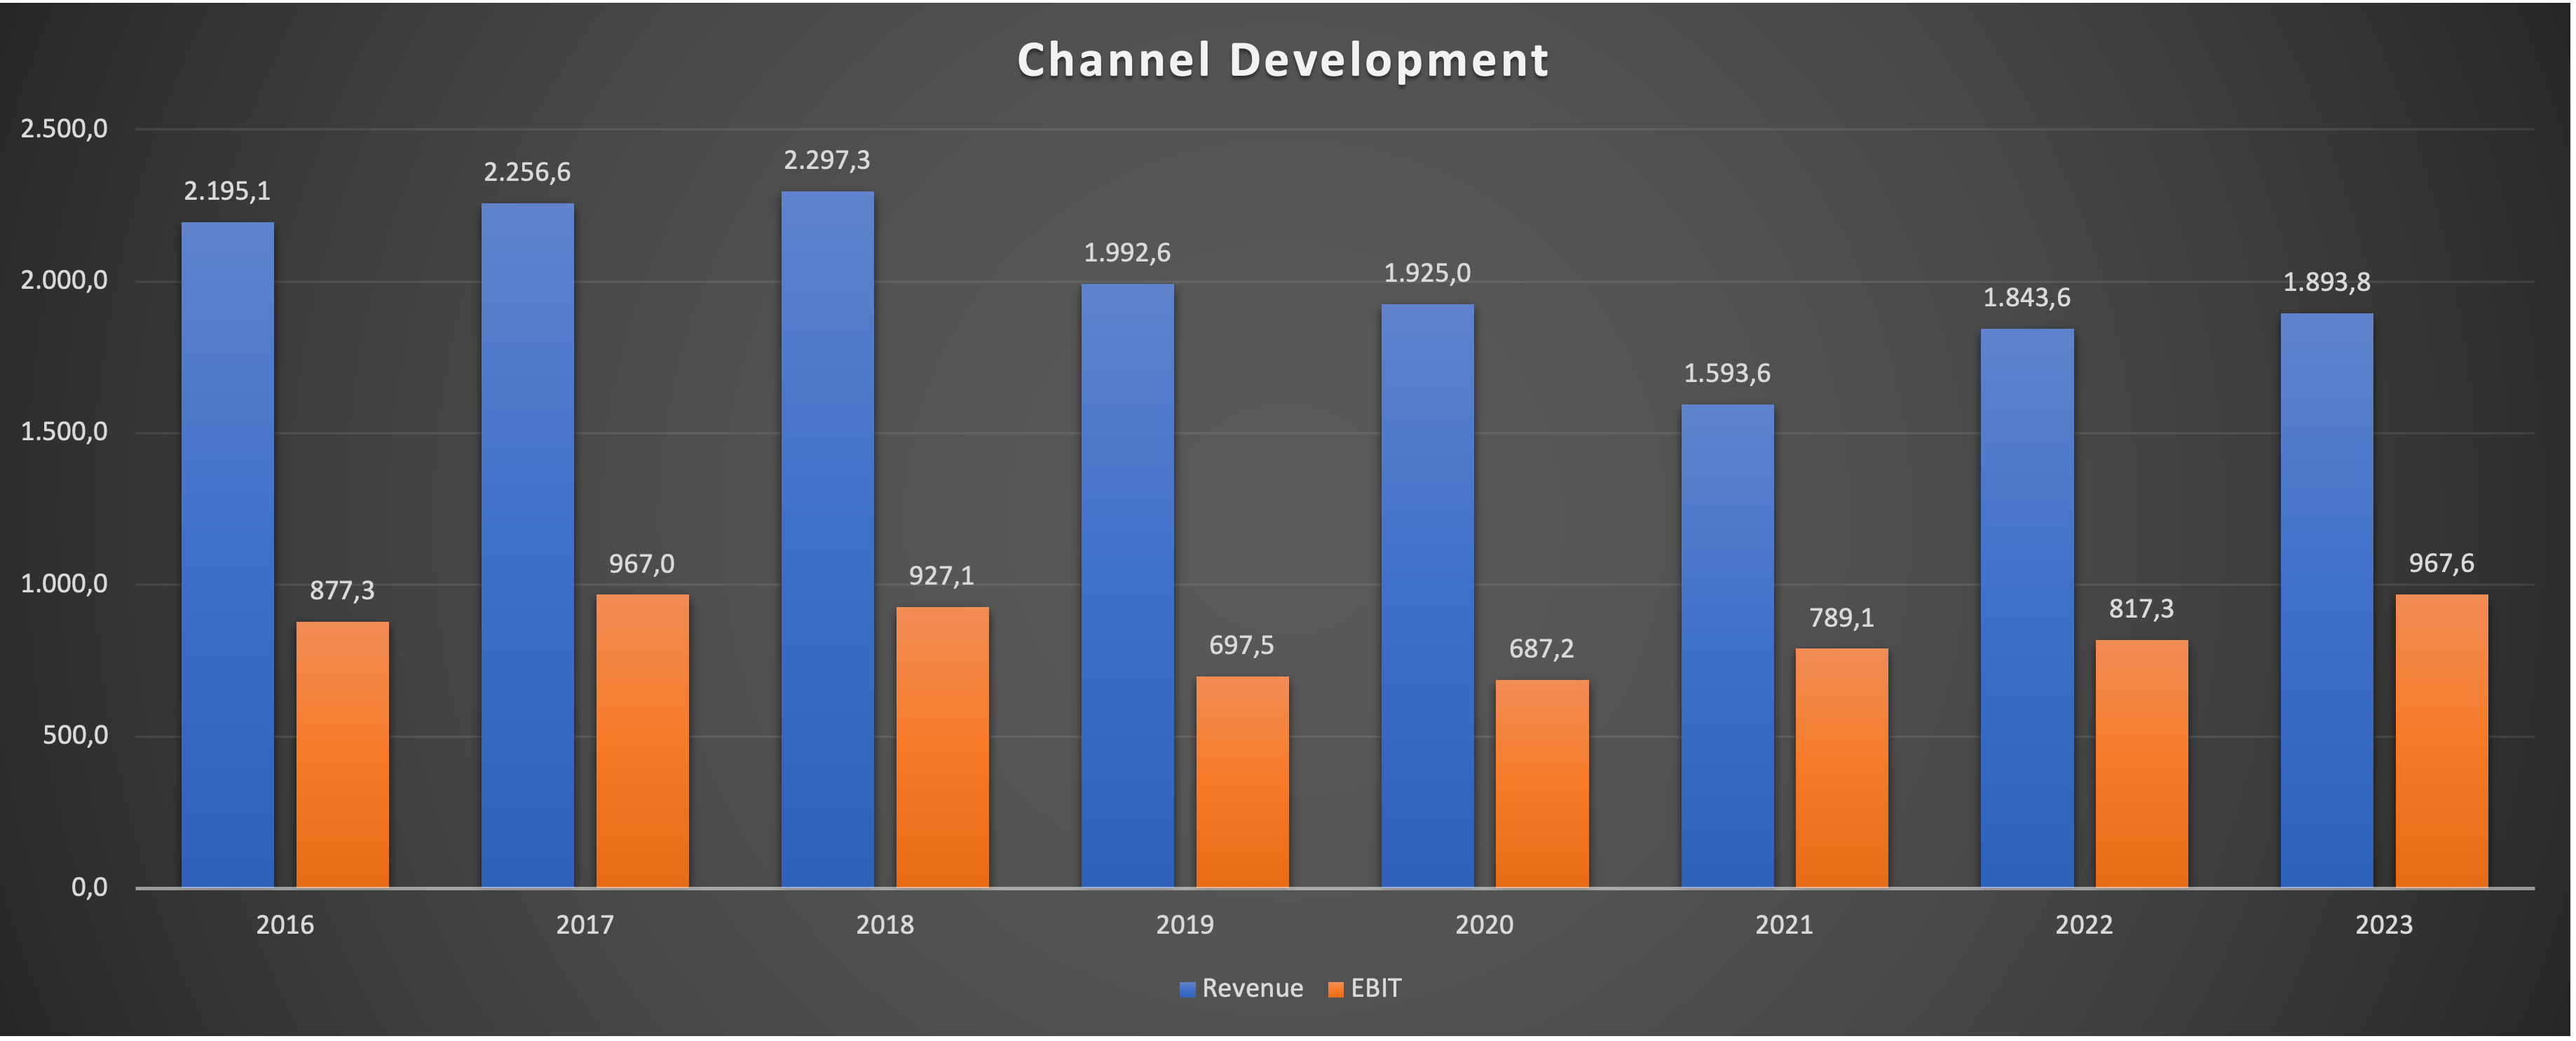
But there is a problem. Here is a chart showing revenue and EBIT since FY16, the year SBUX started reporting this segment the way it does today:
Channel Development Financials (Company 10-K Reports - Compiled by Author)
What a depressing chart. Revenue is lower than it was in FY16 and EBIT is close to flat. The problem is that while collecting royalties off of a strong brand is a very profitable and asset-light business, it has zero reinvestment opportunities. SBUX is completely dependent on how the companies it collaborates with grow sales and profits (with SBUX products). These companies will naturally have a higher incentive to improve sales and profits of their own brands. So Channel Development isn't a game changer either.
Financials
Now let's take a look at the financial performance of SBUX. As always, I will start by looking at the current state of the balance sheet:
SBUX has $3,952 million in cash, cash equivalents and short-term investments. Short-term debt amounts to $1,852 million (short-term debt + current portion of long-term debt) and long-term debt to $13,548 million. If we add the lease liabilities of $9,200 million, the net debt position stands at around $20.6 billion right now. The debt position seems high but we have to look at the earnings side as well.
FY23 Free Cash Flow ((FCF)) came in at $3,372 million while EBIT came in at $5,802 million. So SBUX's net debt is 6.1x FCF and 3.5x EBIT. In conclusion, the net debt level is high in absolute ($20 billion) and relative terms.
We can also see that the equity is negative $8 billion. This looks alarming at first but I don't consider this a big issue. Accumulated depreciation of SBUX's Property, Plant and Equipment (PPE) amounted to $9.9 billion at the end of FY23. A lot of this depreciation is related to SBUX's stores. Again, we can compare this to MCD. MCD reported negative $4.8 billion equity in the latest balance sheet with accumulated depreciation on PPE of $18 billion. The difference between accumulated depreciation and negative equity is far worse in the case of SBUX. However, still, the point is that SBUX stores probably have a market value that is much higher than the depreciated book value on SBUX's balance sheet. Still, SBUX's balance sheet is more worrying than reassuring.
Now I want to turn to earnings metrics and I want to start with a less exciting topic, non-GAAP reconciliations. Here is a screenshot from SBUX's most recent earnings report showing the adjustments to GAAP earnings for FY23/FY22:
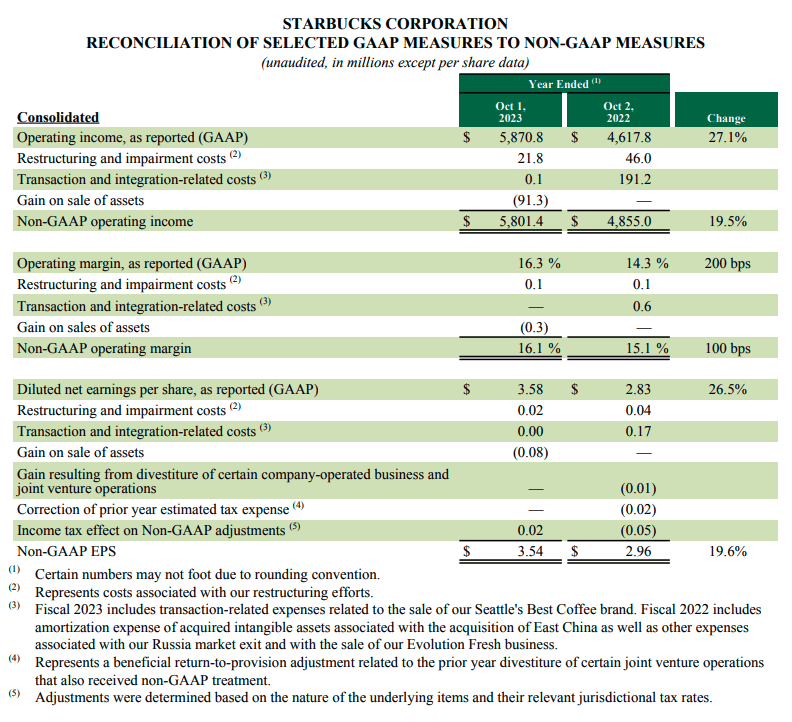
We can see that adjustments had little effect for these two years. I am not a fan of the adjustment for restructuring costs but it is negligible so I won't bother with it. The other adjustments are fine, especially since SBUX is transparent and describes that the $191.2 million adjustment for Transaction and integration-related costs stems from the amortization of intangible assets and the Russia exit (both adjustments are totally fine). Since I have no complaints, I will continue with non-GAAP metrics.
I will focus on revenue and non-GAAP net income. Here are two charts showing both metrics over the past few years:
SBUX Revenue since FY17 (Company Reports - Compiled by Author)
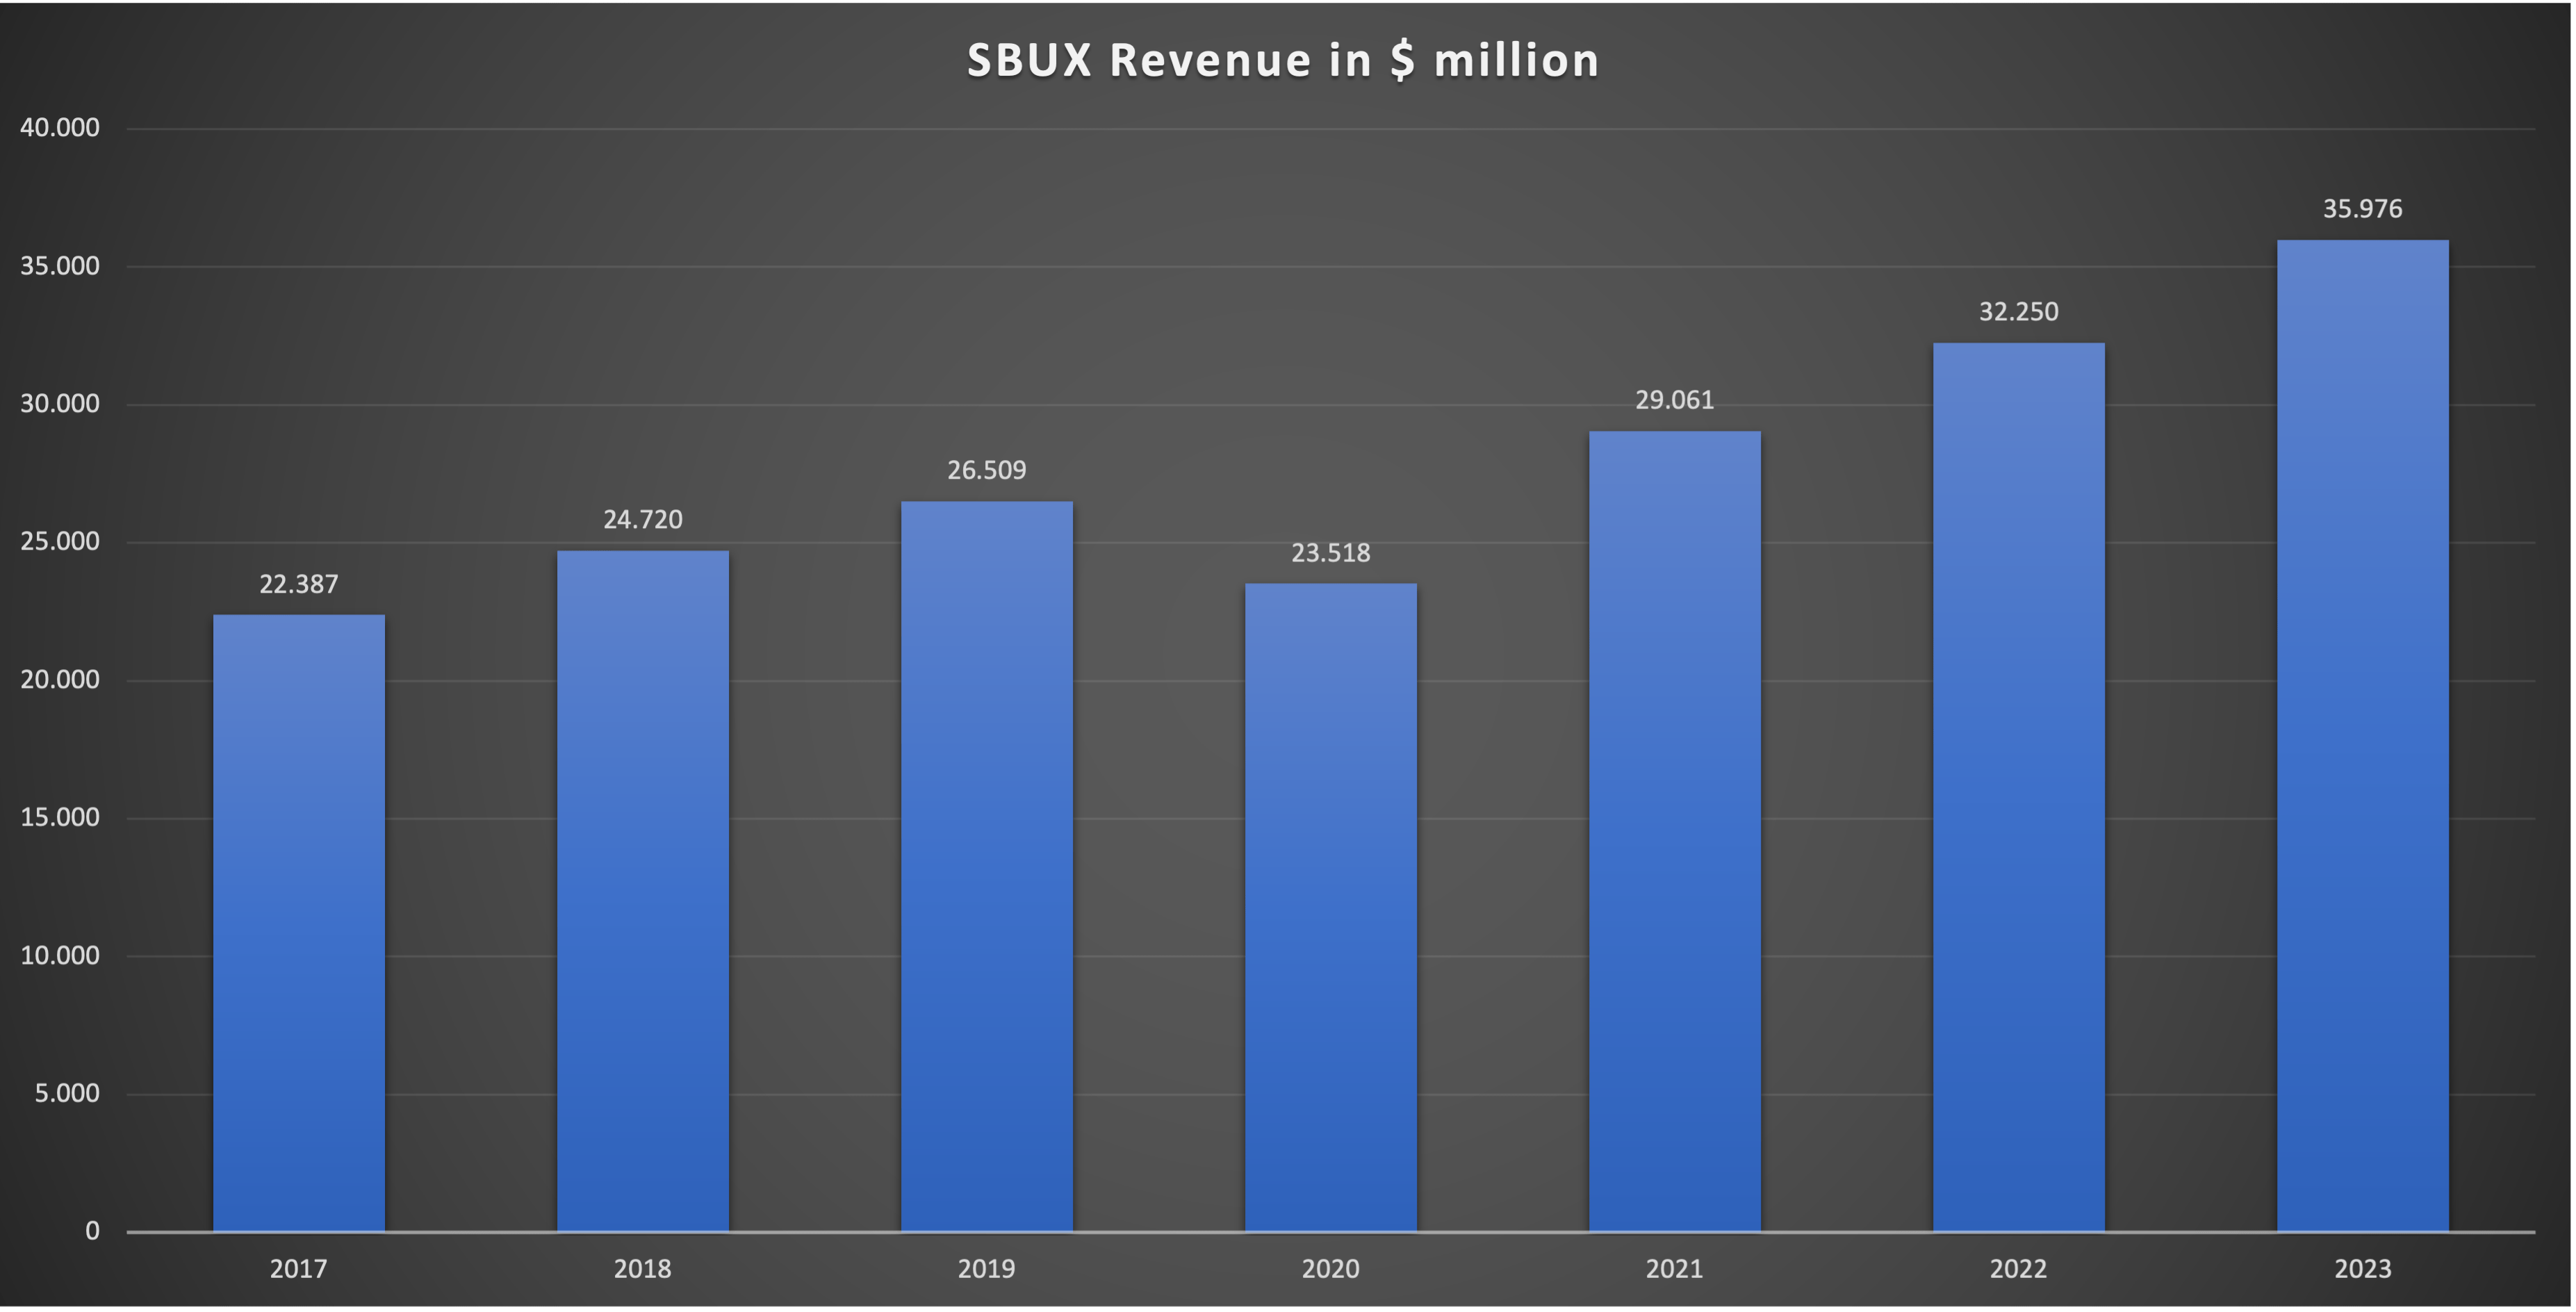
SBUX has been able to grow revenues consistently (except FY20 due to the pandemic) over the past few years. The growth CAGR since FY17 comes in at 8.2%. Remember my earlier assumptions. I assumed SBUX might grow stores at 5% and prices at 3.5% for a total of 8.5% revenue growth (assuming zero same-store traffic growth). The achieved growth rate is a bit lower than my assumption going forward.
SBUX Non-GAAP Net Income since FY17 (Company Reports - Compiled by Author)
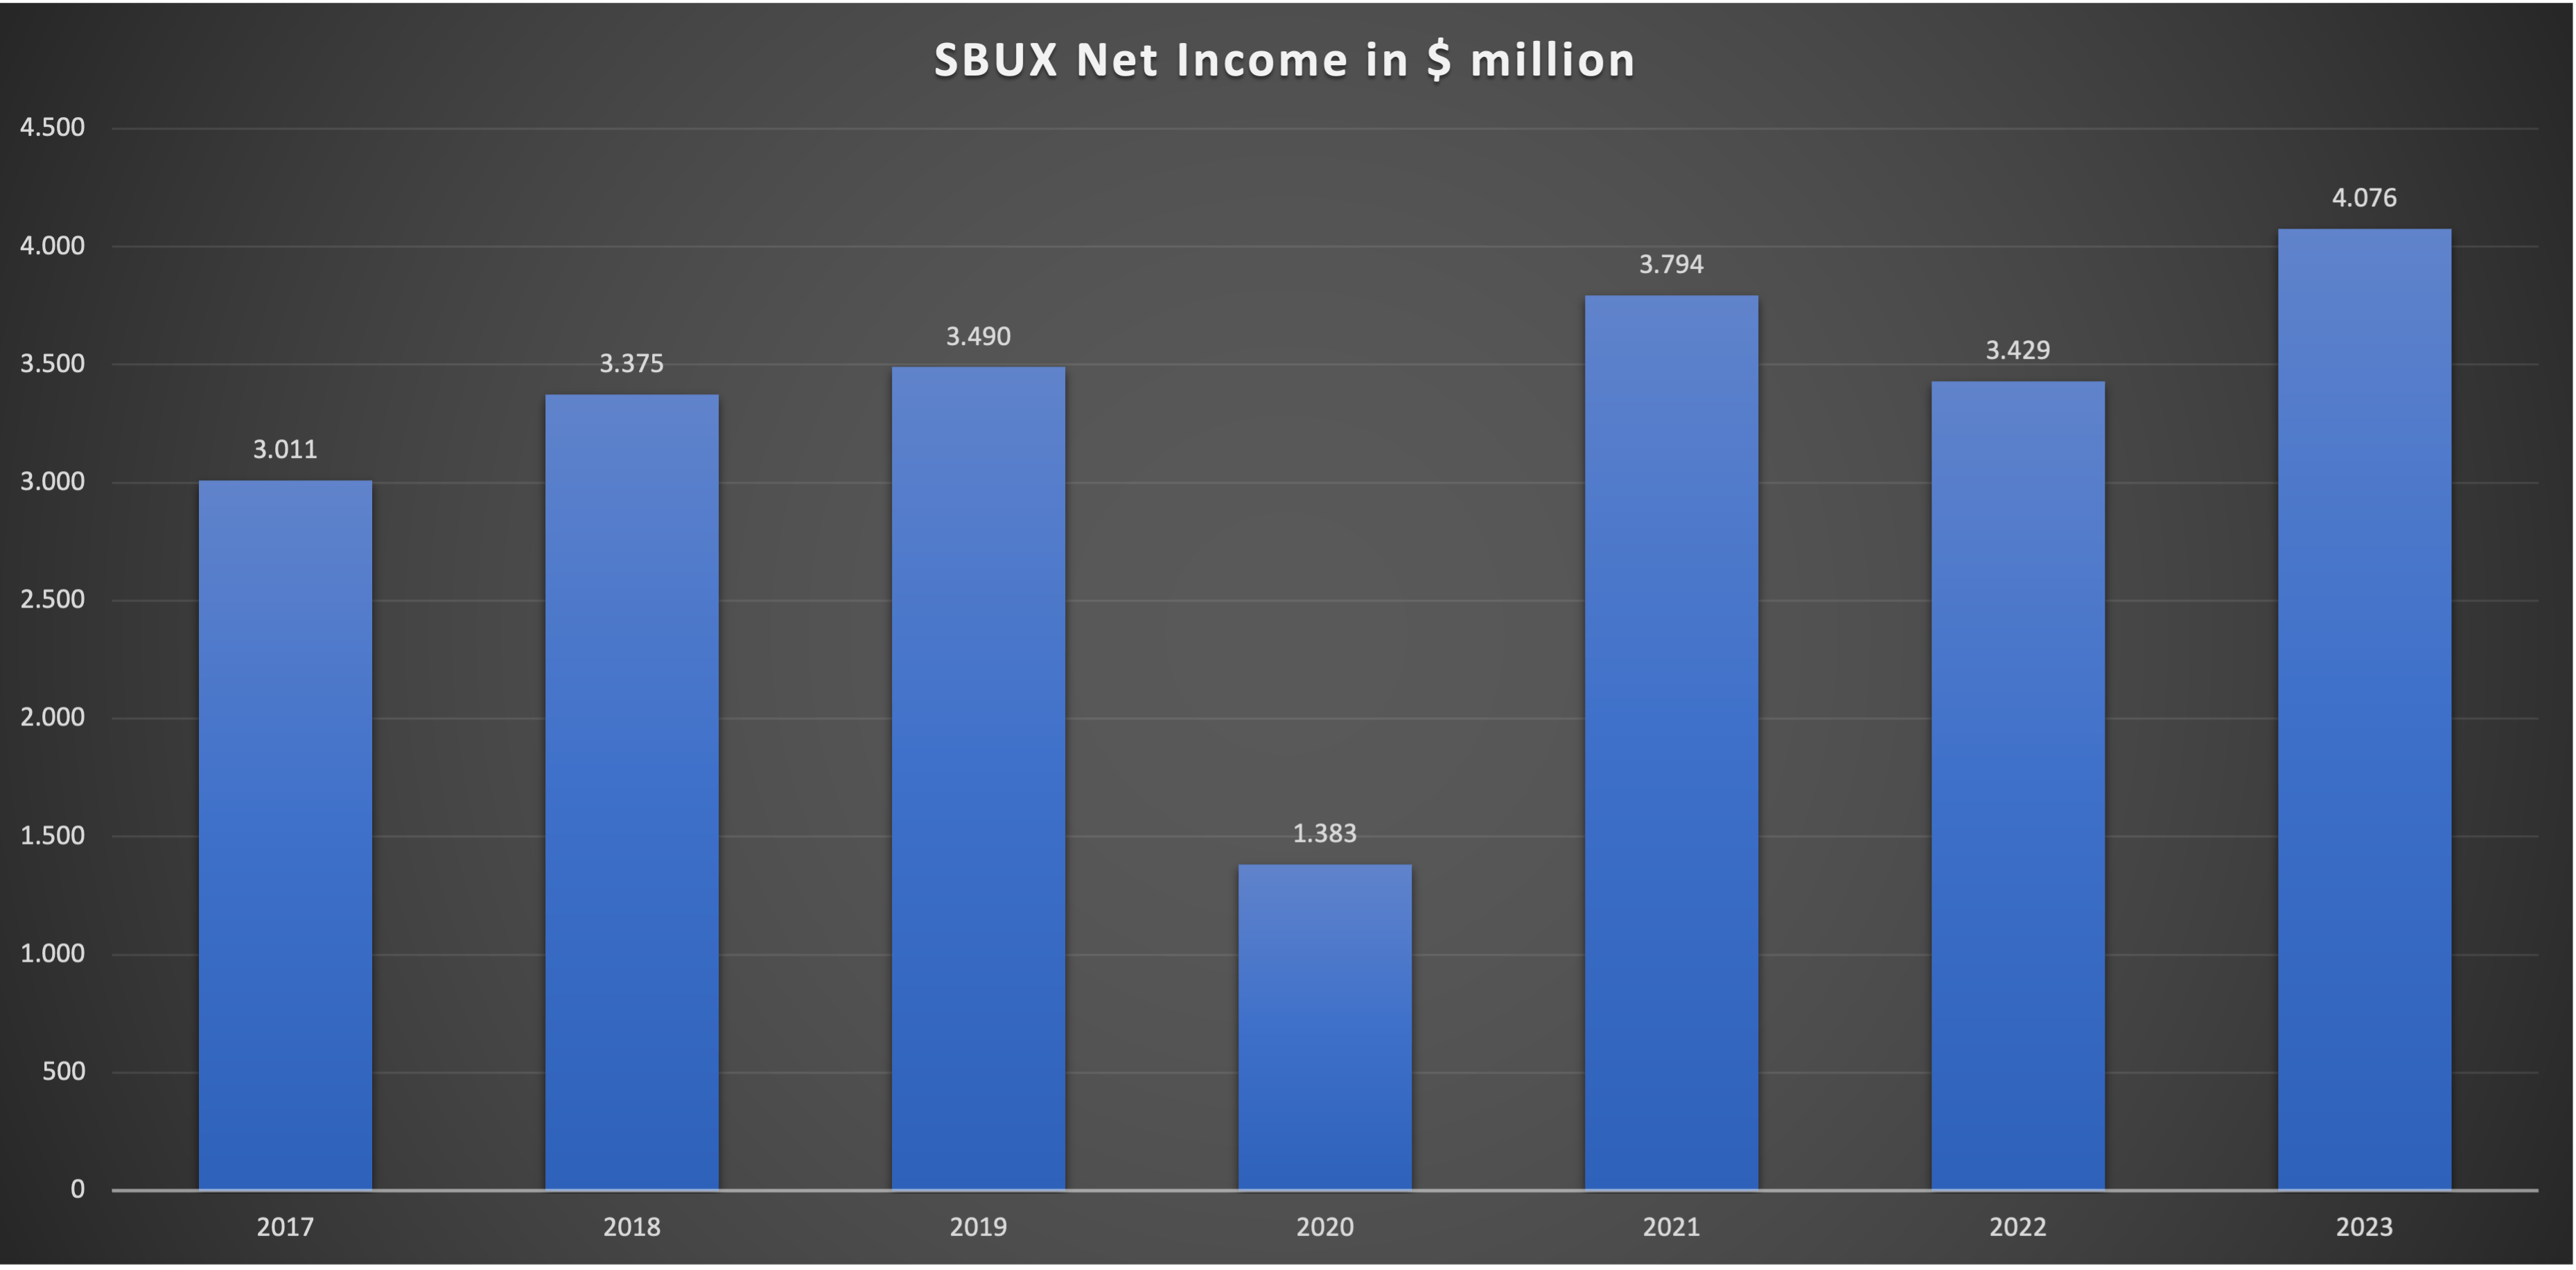
Here we can see that while net income grew as well, it did so at a slower pace. The CAGR since FY17 comes in at 5.2%, well below the revenue growth rate. Again, remember what I said earlier: Increasing prices of sold products, cost of sales and operating costs due to inflation, coupled with declining same-store traffic, leads to less profitable "older" stores. This is what we can see here.
We can also look at SBUX's FCF:
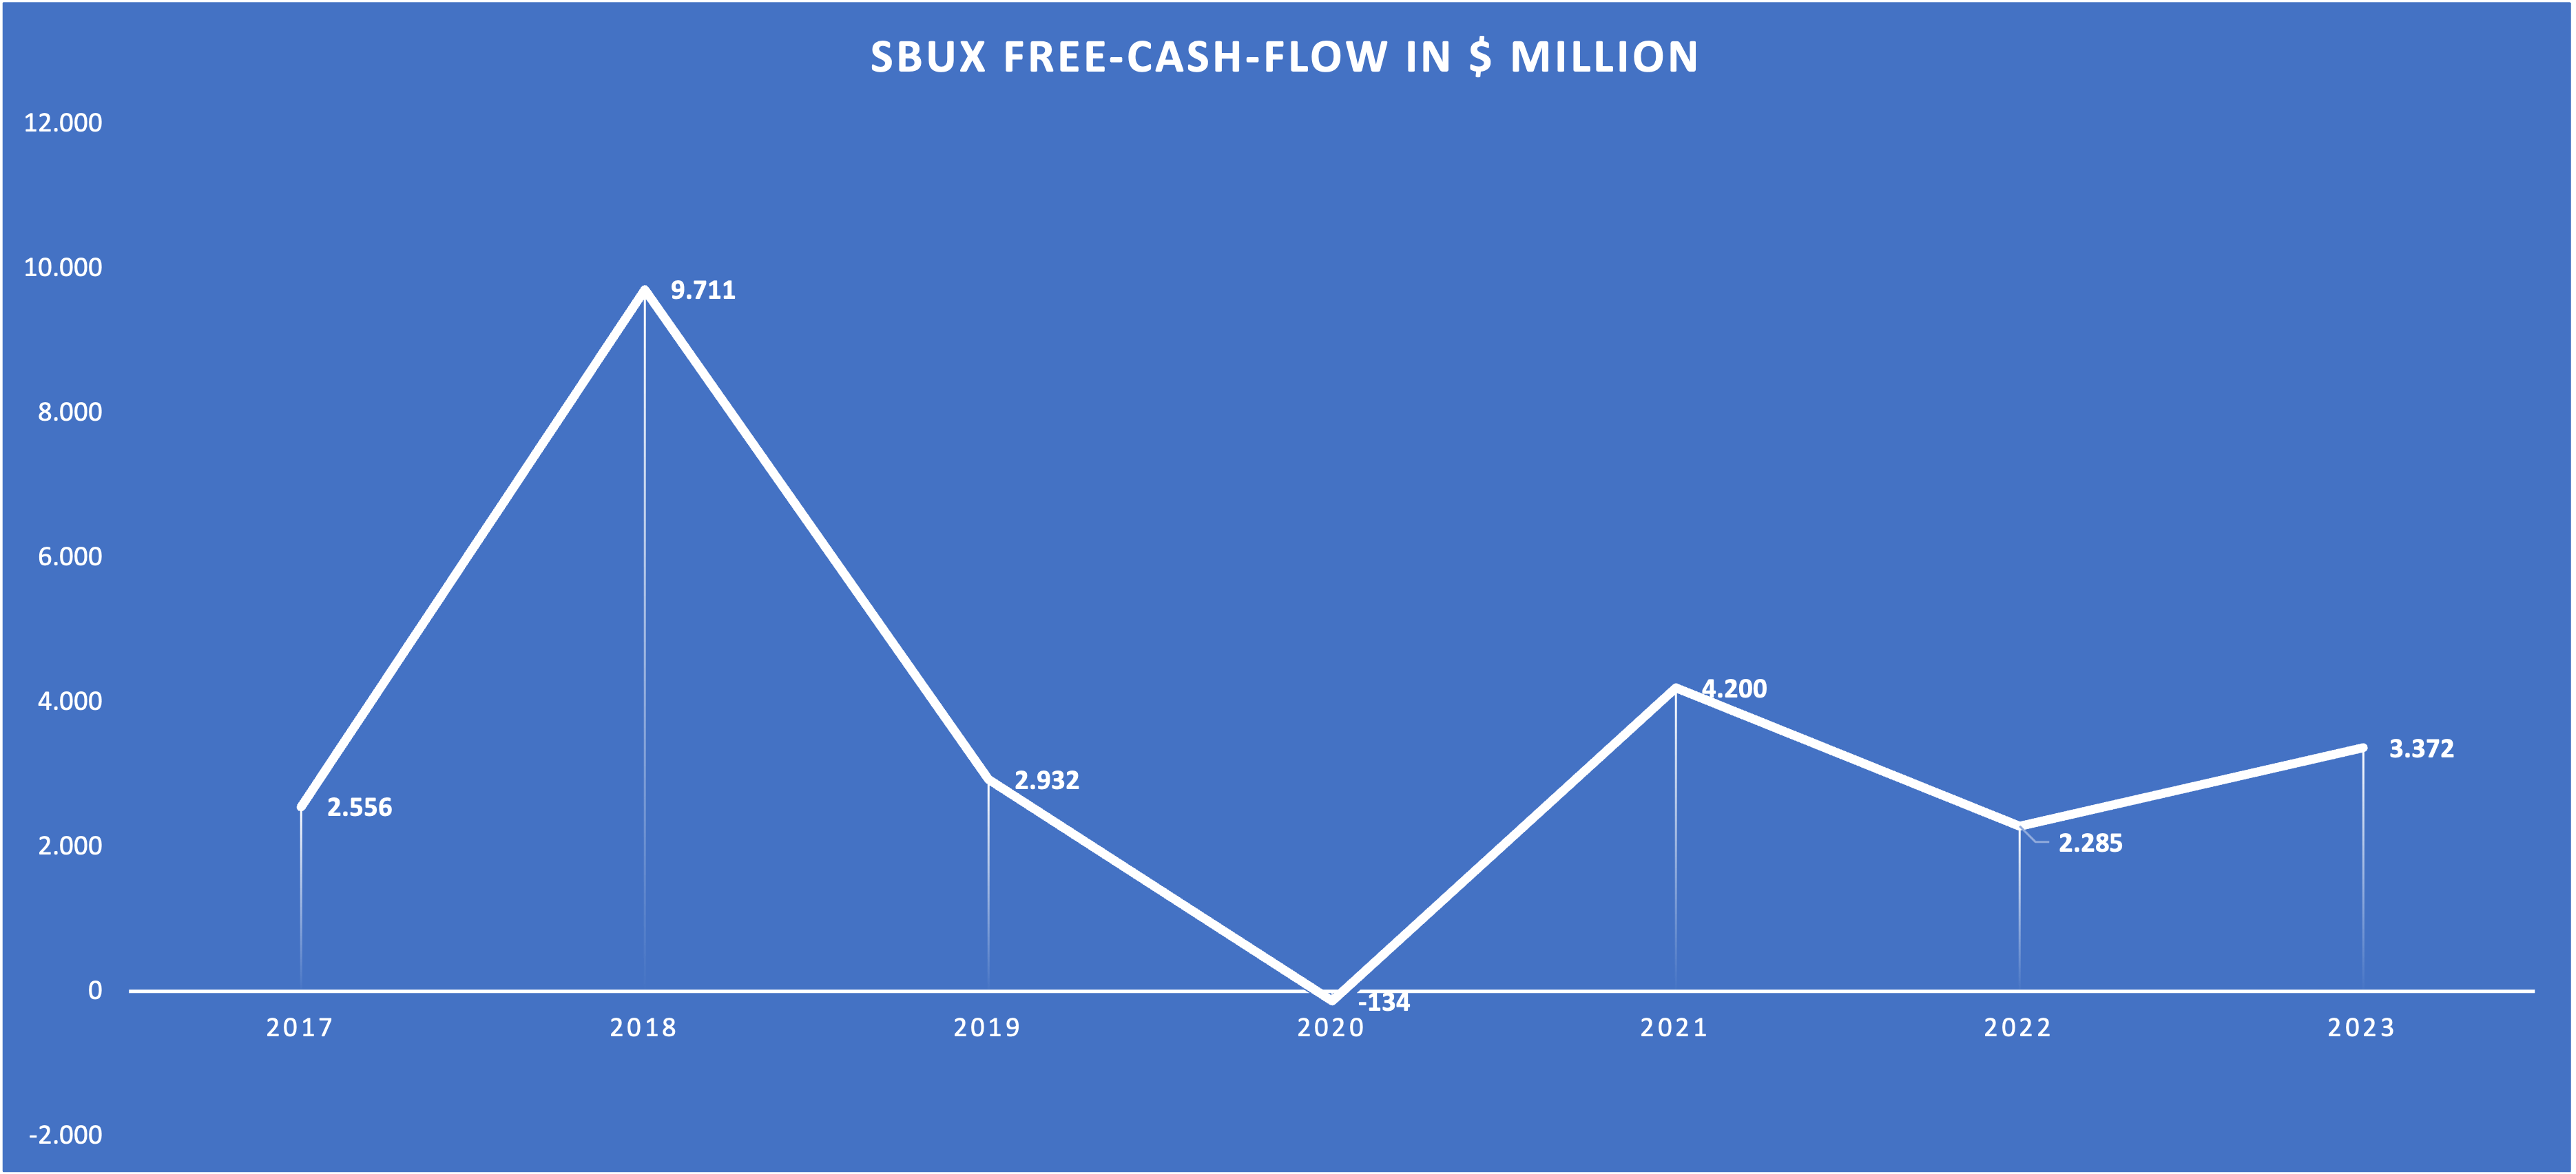
Please note that I treat stock-based compensation as a cash expense. FY18 is an outlier because SBUX was paid an upfront prepaid royalty of around $7 billion from Nestle. This was accounted as deferred revenue and found its way into the operating cash flow. So FY18 adjusted FCF would be around $2.7 billion. From FY17 to FY23, FCF grew with a CAGR of 4.7%, even slower than net income (while cash conversion was the same in both years). In a "normal" year (excluding FY20-FY22 due to pandemic effects), SBUX cash conversion (FCF divided by Non-GAAP net income) always hovered a bit above 80%. Keep this in mind because we will need this number again when we value SBUX.
Lastly, I want to turn to one of my favorite metrics, Return on Capital Employed (ROCE). As a quick reminder, I calculate ROCE in the following way:
Operating Profit (EBIT) / (Long-term debt + Shareholders' Equity - net cash (if there is any))
Other Analysts might use other formulas but for me, this one usually yields reasonable results.
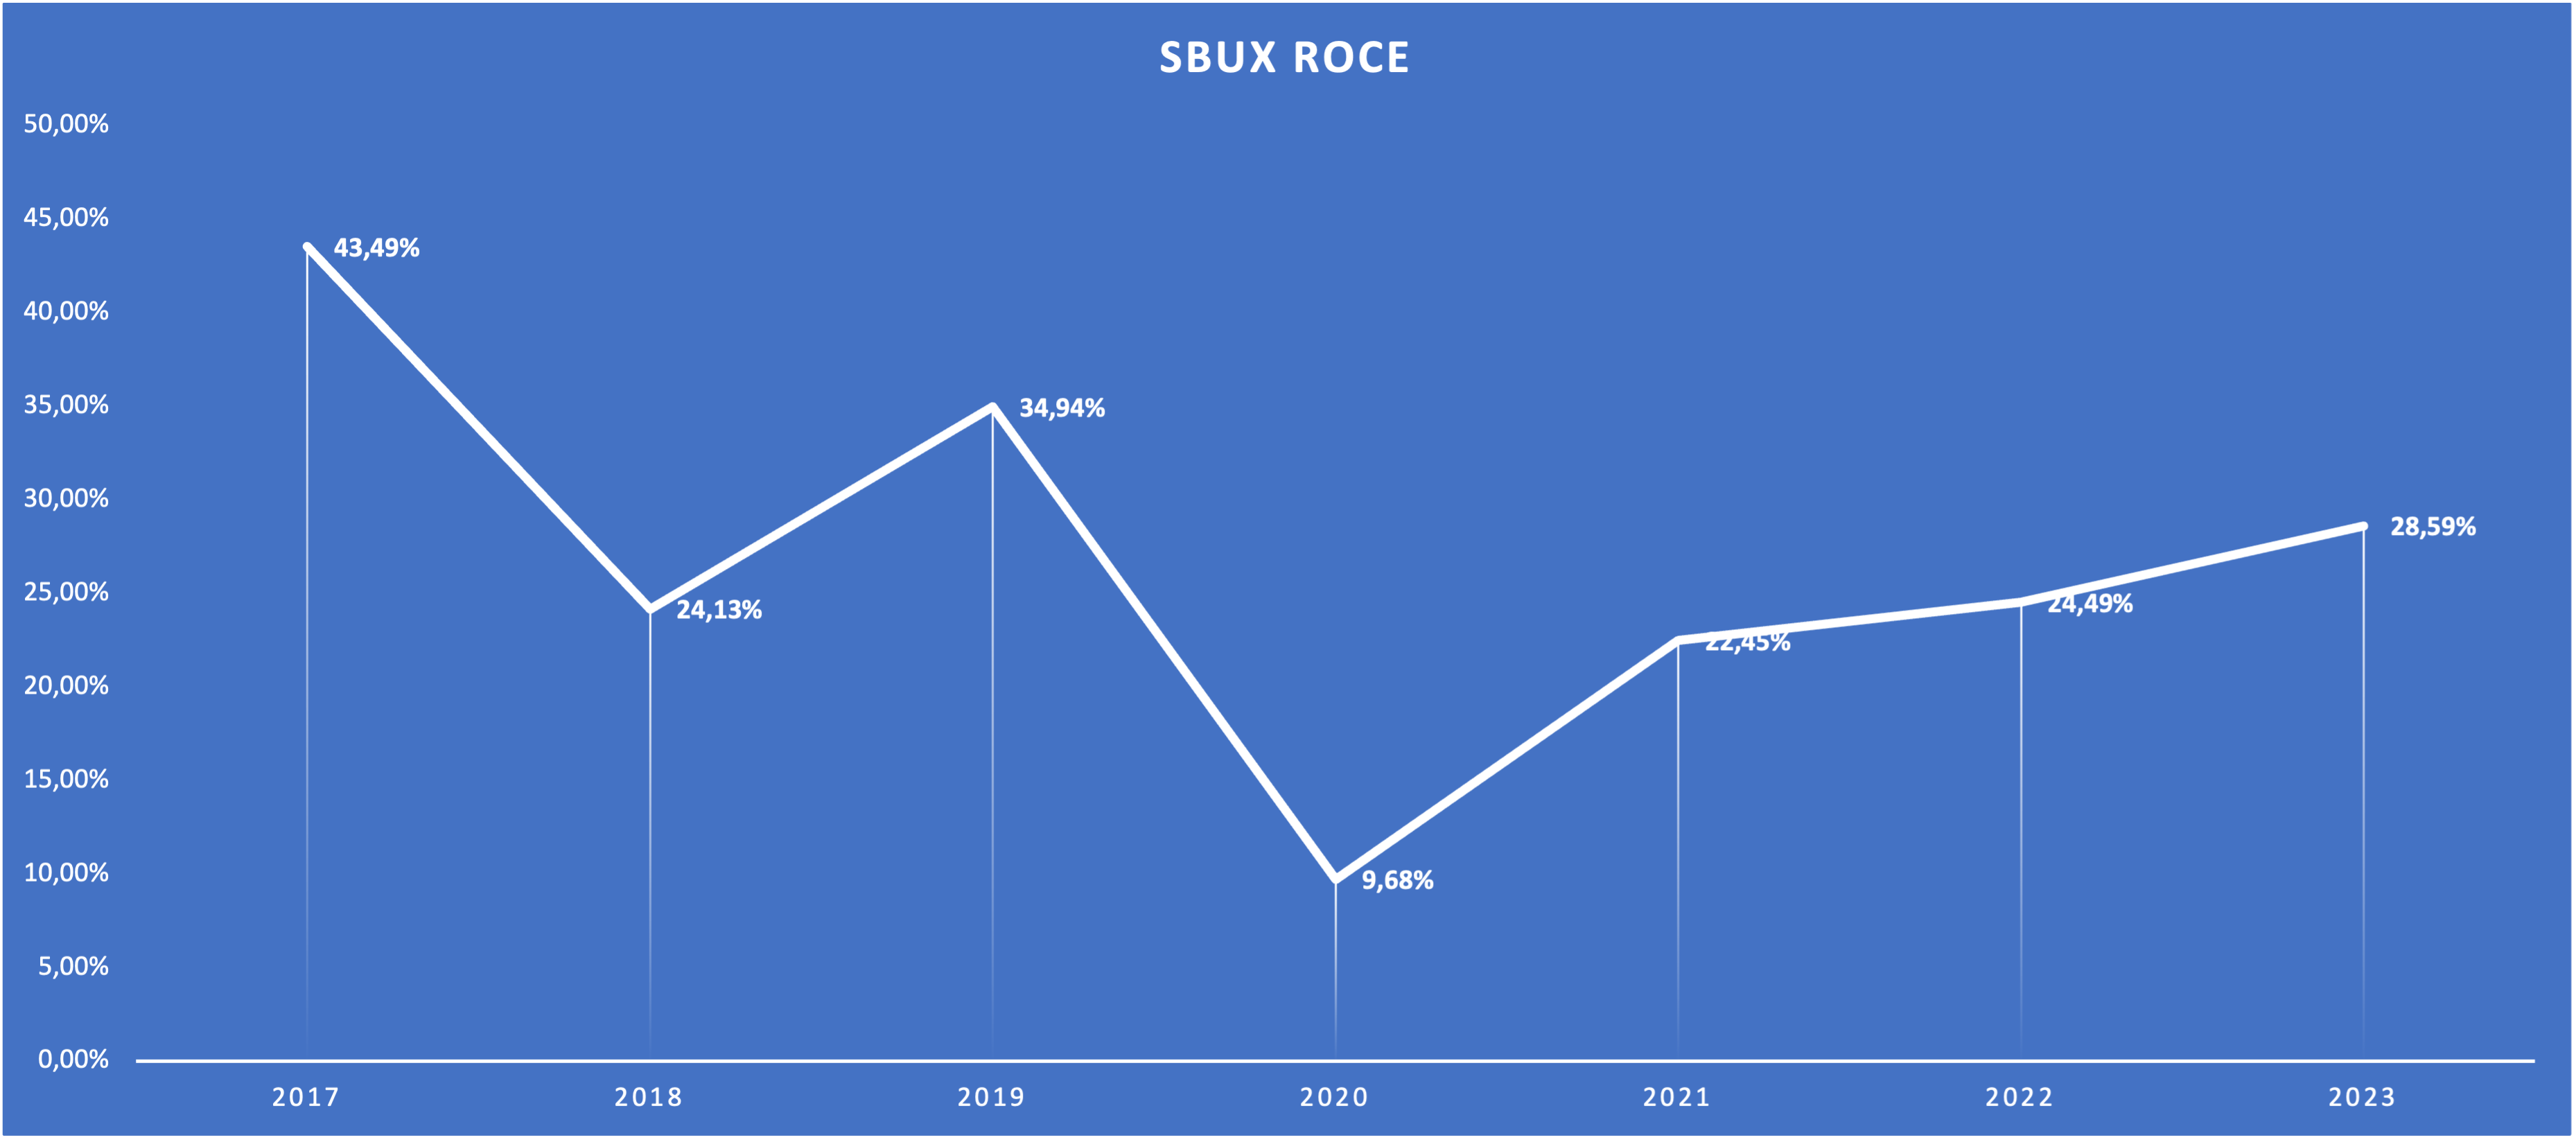
Here is a chart showing SBUX's ROCE per my definition:
SBUX ROCE since FY17 (Author's Calculations based on numbers from Company Reports)
Excluding FY20 due to the pandemic, SBUX consistently generated returns on capital exceeding 20%, a good number. If we take the FY23 ROCE as the norm, SBUX generates 28 Cents of operating earnings for every dollar invested into the business. In conclusion, SBUX can consistently create value for shareholders because the return on capital is far above the cost of capital.
Summing this chapter up:
- The balance sheet is not strong.
- Revenue grew in the range I expect going forward since FY17.
- Net Income and FCF grew slower than revenue, probably due to declining same-store traffic which caused less profitable "older" stores.
- SBUX ROCE has been above 20% in the past, indicating that SBUX can consistently create value for shareholders.
Valuation
As I am writing this, SBUX is trading at $98.91 per share. With 1,149,400,000 shares outstanding, the market capitalization stands at $113.7 billion. I will focus on net income and FCF for valuation purposes. FY23 net income came in at $4,087 million while FCF came in at $3,372 million. So SBUX is currently trading at close to 28 times earnings and an FCF yield of 3%. FY23 cash conversion came in at 82.5% ($3,372 million FCF divided by $4,087 net income), in line with the historic results I mentioned earlier (excluding outlier years due to the pandemic). So these numbers seem reasonable.
As I outlined throughout this article, I think SBUX can grow its store count with a CAGR of 5% until 2030 and prices by 3.5%. I will assume zero same-store traffic growth and no margin expansion (I explained my reasons for this throughout this article). If we add everything together we get an estimate for longer-term returns of around 11.5% (5% store count growth +3.5% pricing power +3% FCF yield) until 2030. Low double-digit returns seem good and should be able to beat the broader index.
Two things concern me though: (1) These growth assumptions are heavily reliant on store growth in China (something I don't like to see) and (2) I have no idea when SBUX's store growth rates will decline to the levels of MCD (1-2% per year). Especially risk number (2) seems concerning since store growth is the main growth driver for SBUX (and has been in the past).
As the aforementioned 11.5% return potential assumes no change in valuation (which would very likely appear as soon as store growth rates trend downwards), we should perform a supplemental DCF calculation. With $3,372 million FCF and 1,149,400,000 shares outstanding, FCF per share stands at $2.93 right now. I will assume the following:
- 8.5% growth until FY2030
- 5% growth thereafter (3.5% pricing power + 1.5% store growth)
- 10% discount rate
Here is the result:
DCF Calculation (moneychimp.com)
Based on my assumptions, SBUX should be worth around $75 per share. This would mean that SBUX is very overvalued with a downside potential of close to 25%. SBUX would need to grow FCF with 10% CAGR until 2030 and 6% into perpetuity thereafter to be fairly valued. I highly doubt that these numbers are achievable and laid out my reasons earlier in this article.
But again, let's look at what SBUX expects:
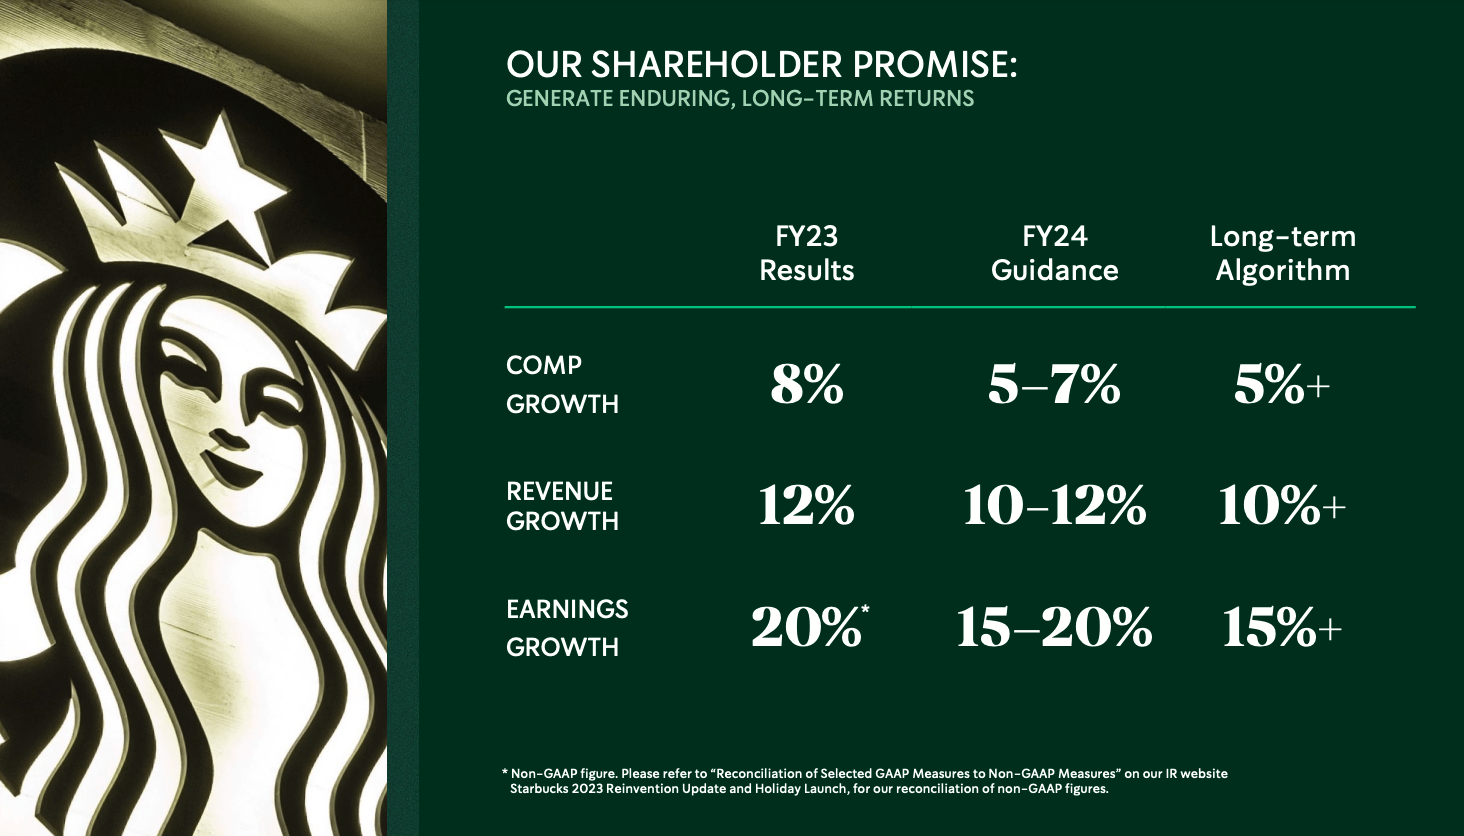
SBUX Long-term Expectations (Investor Day Presentation - Slide 96)
SBUX expects earnings growth of 15%+ with revenue growth of 10%+. Taking into account what SBUX said throughout the Investor Day, they expect efficiency improvements (= Margin improvements) and higher comparable sales growth than I do. They expect comp growth (= Same-store sales growth) of 5%+ while I only expect 3.5%. They seem to calculate with decent traffic growth. I outlined earlier that traffic growth has been non-existent in the past. I see no catalyst for this to change.
Why SBUX should magically start to improve margins after company-operates stores OPEX/Revenues have been getting worse on a clear trendline over the past ten years isn't clear to me either. I admit that they have been able to improve the margin by 100 basis points YoY in FY23, but they fail to point out that this was the first year of margin improvement we have seen in the past decade. In conclusion, I think SBUX's growth assumptions are way too optimistic and not backed by historical results.
Risks
As I will rate SBUX a "sell" ( Author's note: Sell doesn't mean that I plan to short the stock, only that I think it might be wise to think about selling since I see better opportunities ), I will have to point out risks for selling shares someone already owns.
My main bear thesis in this article was that I think (a) SBUX is too reliant on growth in the Chinese market, (b) same-store traffic growth will be close to non-existent in the future and (c) I don't see improving margins. Meanwhile, SBUX is very bullish on all three of these things.
Regarding (a), this comes down to your own opinion on China as an investment opportunity. If you don't think that the Chinese market poses some regional risks and you are bullish on Chinese coffee consumption, you don't have to worry about this point. Personally, I don't want too much portfolio exposure in the Chinese market because I can't gauge the geopolitical risks. I already outlined this in some of my earlier articles. On the other hand, if SBUX can expand in China as they plan to, this would be a great opportunity for growth. If overall coffee consumption per capita in China were to increase over the next decade (which is something that some of my fellow Analysts are very bullish about), this could also lead to improving same-store traffic (b) and therefore improving margins (c).
As for (b), I have shown earlier that same-store transactions declined over the past decade (if we take into account the decline and rebound of the pandemic). I said that this might be a sign that SBUX's brand isn't as strong as everyone thinks it is. It might as well be that this decline in traffic is still just an after-effect of the pandemic. We have seen a rebound in same-store traffic over the past three years (+9% in FY21, +2% in FY22 and +3% in FY23). If we see same-store traffic of 2-3% over the next few years, I would have to rethink my current stance which would lead to potentially higher growth assumptions, followed by a higher price target.
Regarding margins, we will have to wait and see if SBUX can pull off the margin improvement they promised at the last Investor Day. If they do, my assumptions will be far too bearish and the stock might be fairly valued or even undervalued. Ongoing margin development will be one of the main metrics to look out for in the next few years.
Conclusion
SBUX has been able to grow the store count at around a 6.5% CAGR over the past decade and expects around 6% going forward until 2030. SBUX was able to increase prices by around 3.5% every year, around 100 basis points higher than the global GDP growth of 2-3%. Meanwhile, same-store traffic declined over the past decade, partly due to a big decline due to the pandemic.
SBUX future growth is heavily reliant on the Chinese market, something that I don't like to see. Margins as defined by OPEX/Revenues for company-operated stores have been trending down over the past decade.
I think SBUX might provide low double-digit returns, stemming from 5% store growth, 3.5% pricing growth and 3% FCF yield. A supplemental DCF calculation assuming 8.5% growth until 2030, 5% thereafter and a 10% discount rate leaves me to assume that SBUX might be overvalued. SBUX would need to grow earnings with 10% CAGR until 2030 and 6% into perpetuity to be fairly valued.
As outlined in the recent Investor Day, SBUX assumes earnings growth of 15%+ due to same-store traffic growth and increasing margins. I am not sold on this promise since it is not at all backed by historical performance.
Taking everything into account, I will have to rate SBUX a "sell" and will sell my own shares in the next few days.
For further details see:
Starbucks: Some Reasons To Rethink Your Position