NVDA - Stocks Post Modest August Losses Big Data On Tap SPYV A Hold
2023-08-31 16:00:34 ET
Summary
- U.S. large-cap stocks rallied in August after earnings from Nvidia Corporation and a message from Fed Chair Jay Powell stirred up volatility for a time.
- Small caps and foreign stocks performed poorly, with drops of 5% and 4%, respectively.
- Energy was the only sector to see positive returns, while Utilities and Consumer Staples struggled.
- I outline where I see SPDR® Portfolio S&P 500 Value ETF headed as we embark on the notoriously volatile month of September.
August spooked the bulls early, but a strong rally after earnings from Nvidia Corporation (NVDA) and in the wake of Jay Powell’s Jackson Hole message brought U.S. large-cap stocks closer to the flat line by month’s end. All told, the S&P 500 (SP500) was down about 1%, while the tech-heavy Nasdaq Composite (COMP.IND) featured similar declines.
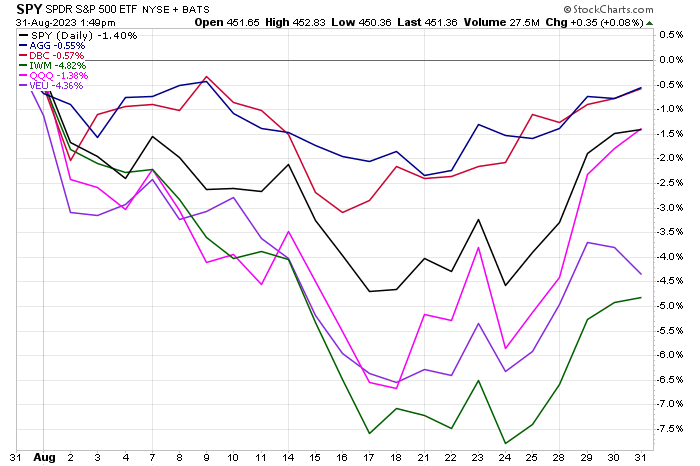
Small caps, as measured by the iShares Russell 2000 ETF (IWM), endured a tougher time, dropping 5%. Likewise, foreign stocks were beaten up with a 4% negative return – you can thank a rising dollar for at least a portion of the Vanguard FTSE All-World ex-US Index ETF’s (VEU) decline, as the dollar was higher by more than 2%. It was a bit of a “sell everything month” as both the Aggregate Bond ETF (AGG) and the broad Commodities tracking fund (DBC) ended August in the red.
Stocks Down Slightly in August, Small Caps & Foreign Equities Particularly Weak
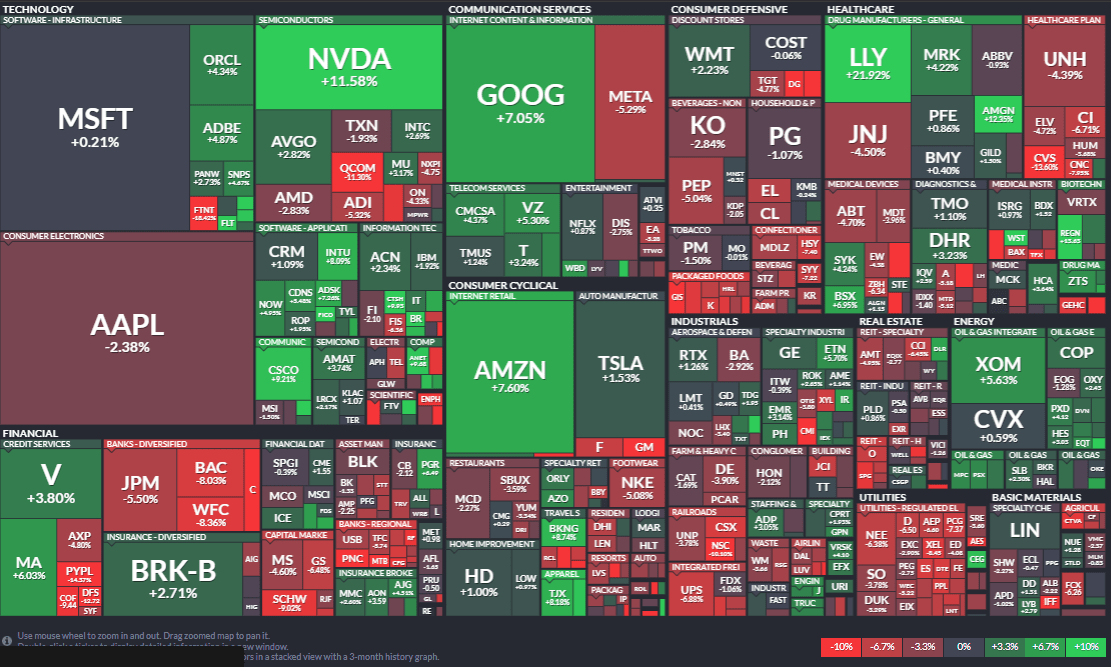
As for the S&P 500’s components, the standouts were NVDA and Eli Lilly (LLY). Those two companies have enjoyed massive market-cap growth in 2023. The former’s story is well known, as NVDA is the world’s leader in the semiconductor space, fueling the AI boom as the primary picks and shovels chips firm. The latter, meanwhile, has enjoyed fat profits and a beefy price-to-earnings multiple care of its strong pair of drugs – one for weight loss and another used to fight Alzheimer's.
Elsewhere, Amazon (AMZN) snapped back following news of a strong Prime Day back in July. There was weakness, however, among many retailers amid growing fears of a weakening consumer. Bigger picture, higher interest rates pressured equities in August.
August S&P 500 Index Component Returns: A Mixed Bag
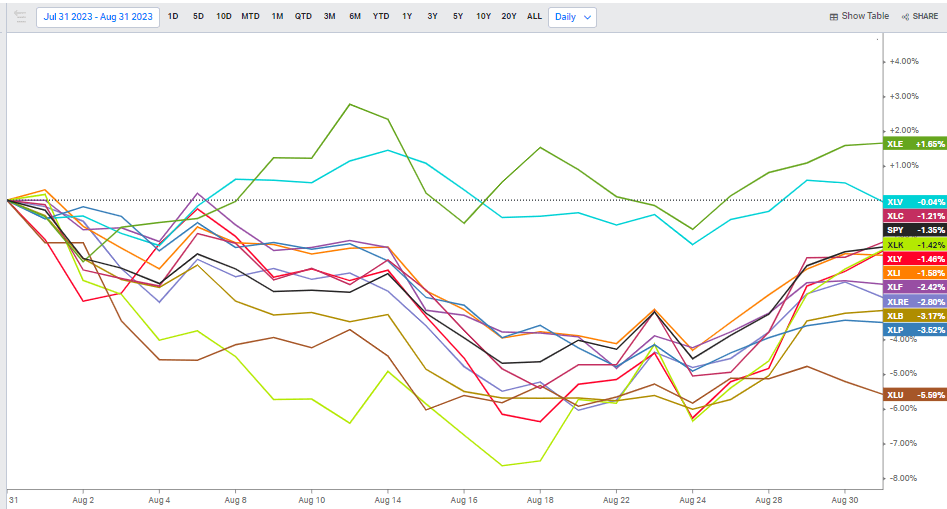
Sector-wise, Energy led the way and was the only area in the black. Health Care, led by LLY, buffered the flat line but ultimately finished slightly in the red with dividends included. Not surprisingly, Utilities were the worst-performing sector amid higher interest rates, which often pressure debt-heavily power producers.
Another notable weak spot was the Consumer Staples space, as the relatively expensive sector came under pressure given concerns over much lower inflation, which could hamper top-line sales compared to how easily those companies were able to pass through higher costs to cash-rich consumers in 2022.
Energy Leads in August
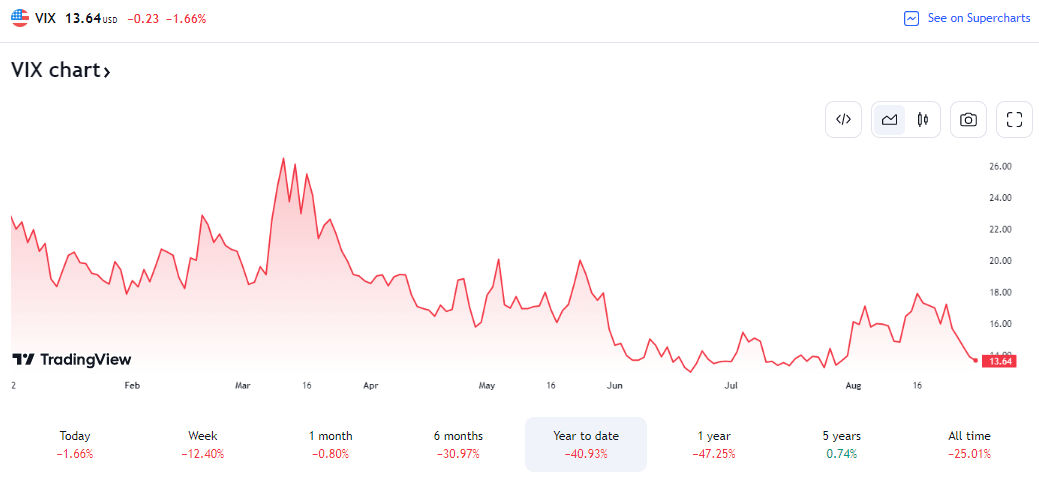
Volatility snuck a peak at the 20 level on the Cboe Volatility Index (VIX) mid-month, but the index finished under 14 – very close to the softest reading since before the pandemic. Expectations for low volatility looking ahead 30 days come as traders set their eyes on the notorious month of September – historically, the worst-performing month on the calendar.
Muted Volatility Heading Into September
September Is Historically the Worst Month of the Year
Scotiabank
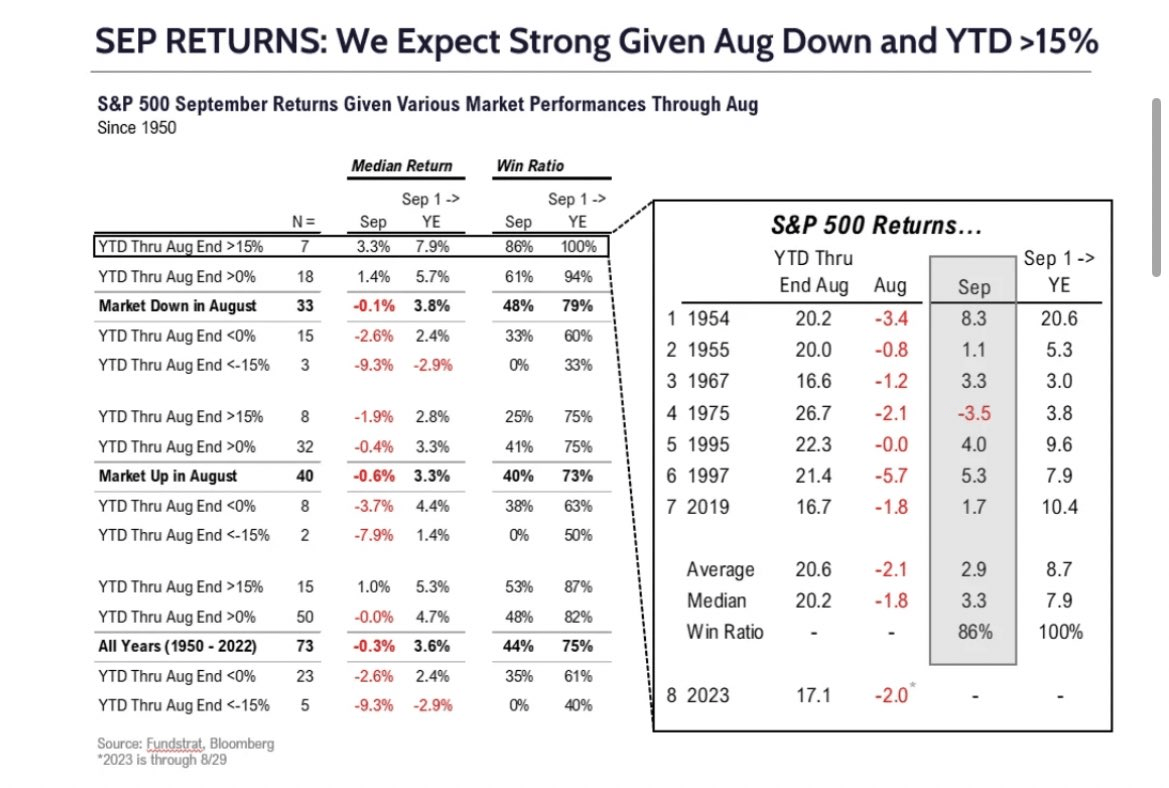
According to data compiled by the team at Fundstrat, there’s reason for some optimism. When returns are positive through July, and the S&P 500 experiences a down August, performance from September 1 through year-end tends to be quite strong. As always, you must perform an independent analysis, and seasonality is just a secondary indicator to price action and fundamentals.
Spooky September? Not Always the Case.
Along with a bevy of big data points to be released on the first of the month, all eyes will be on the September 20 FOMC meeting. There remains a modest chance of a quarter-point rate hike, with a greater likelihood of an increase at the November 1 Fed gathering.
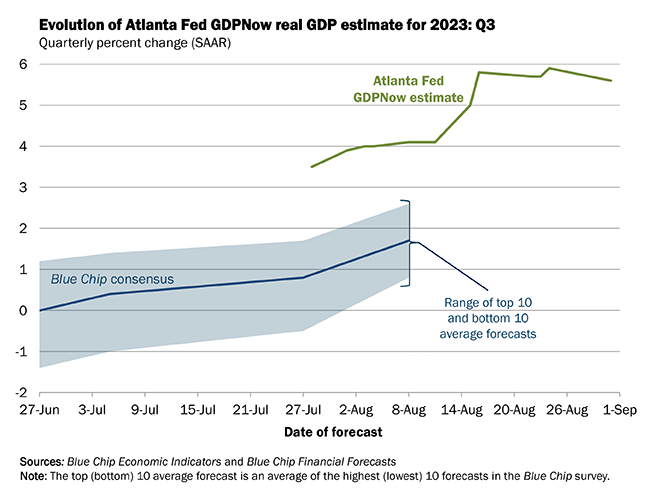
Overall, about a 45% chance of a final rate increase is the current probability. This comes as the Atlanta Fed’s GDPnow tool shows Q3 real GDP growth modeled at 5.6% as of August 31, well above the economic consensus of just 1.8%.
One More Hike? It's About A Coin-Flip's Chance.
CME FedWatch Tool
Robust Economic Expansion Continues, Per Atlanta Fed GDPnow Model
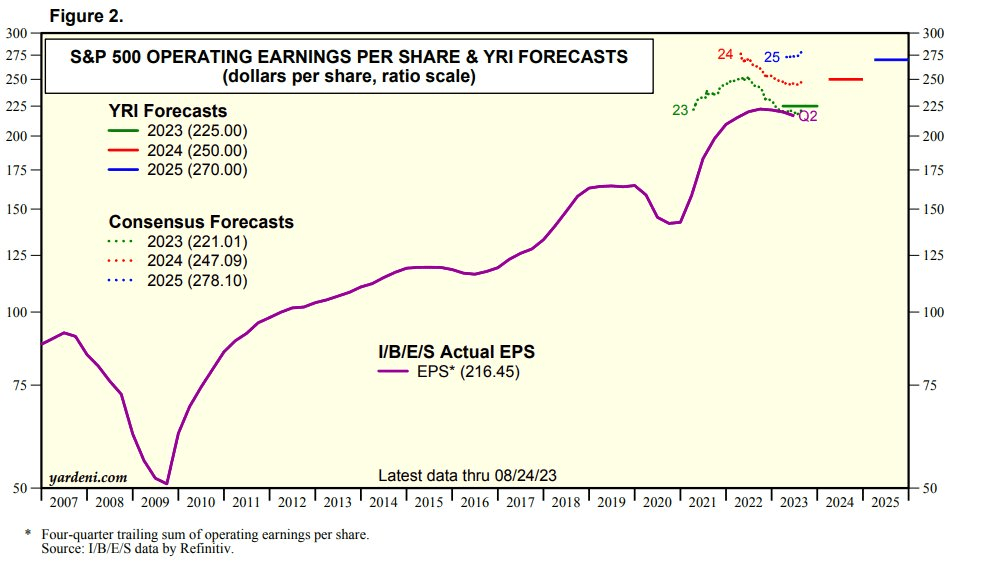
Economic strength is buttressed by rising S&P 500 earnings expectations. As it stands, this year’s SPX EPS sum is seen at $221, but $247 is the consensus for next year. Go out to 2025, and analysts project $278 of per-share profits. If we assume $247, then the S&P 500 features a reasonable 18.3 forward P/E come December using today's index level. Of course, growth trades at a premium while value sells at a discount.
S&P 500 Earnings Outlook Improves in August
With that in mind, let’s review the SPDR® Portfolio S&P 500 Value ETF (SPYV). According to SSGA Funds, SPYV offers investors access to undervalued S&P 500 companies compared to the broader market. The underlying index, the S&P 500 Value Index, gauges the performance of large-cap value stocks in the U.S. equity market. The index includes stocks from the S&P 500 that display strong value characteristics, such as favorable book value-to-price ratios, earnings-to-price ratios, and sales-to-price ratios. The index's composition is weighted based on the market capitalization of its constituents.
While the Information Technology sector is the largest sector component of SPYV, it is relatively light on tech and heavy into Financials compared to the SPX. I detailed this back in March when I had a measured stance on the fund. Value has underperformed growth since then, though the ETF has done better than I expected. Interestingly, the $17 billion assets under management fund features less than 2% in Energy – the best momentum sector right now.
I would prefer being overweight Energy as we head into the tail end of Q3, given the strength in oil this summer. SPYV features a yield slightly above that of the SPX at 1.9% and the fund has a low annual expense ratio of just four basis points along with strong liquidity . SSGA lists the forward P/E at 17.4 with expected EPS growth of 12% over the coming 3-5 years, making for a low PEG ratio near 1.4.
SPYV Composition
Seeking Alpha
The Technical Take
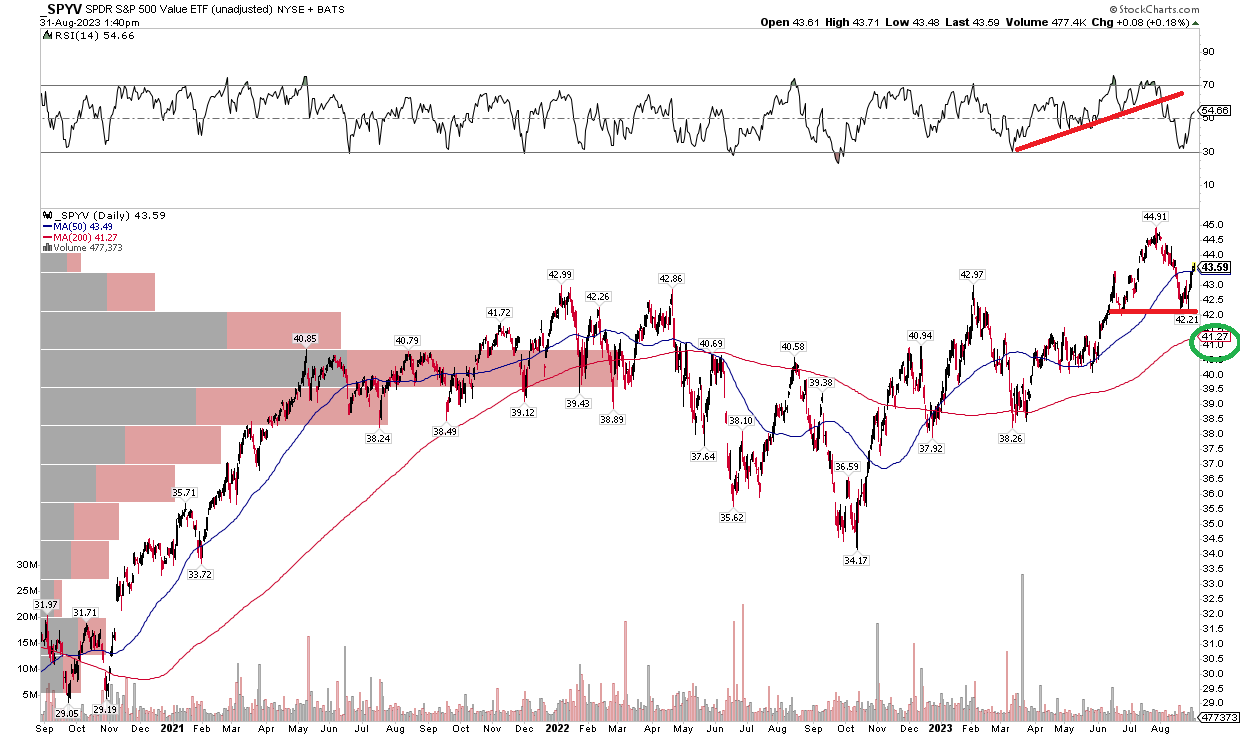
With an attractive valuation ahead of sometimes dicey seasonality, the chart has mixed signals. Notice in the graph below that SPYV put in a bullish double-bottom low after a strong rally that began in mid-October last year. But I also see that the RSI momentum indicator at the top of the chart has broken an uptrend line, so I assert that we could see a bit of weakness in September after this small relief rally in the last handful of sessions.
Long-term, I like that the 200-day moving average is upward sloping and there is a high amount of volume by price in the $40 to $41 range, which should offer support on a further pullback. So, going overweight SPYV on a dip to $41 could be a prudent play. Unlike many other index ETFs, SPYV made new highs earlier this quarter, so there’s broader momentum that should be considered.
SPYV: Momentum Weaker, But A Broader Uptrend Remains
The Bottom Line
I reiterate my hold rating on SPDR® Portfolio S&P 500 Value ETF. September has historically been a rocky month, and while some seasonal trends suggest that strength leading into the final month of Q3 often portends upside, some caution on large-cap value equities is warranted.
For further details see:
Stocks Post Modest August Losses, Big Data On Tap, SPYV A Hold