TLT - Target For The Correction In Equities Is Still The 200-Day Moving Average
2023-09-25 21:10:00 ET
Summary
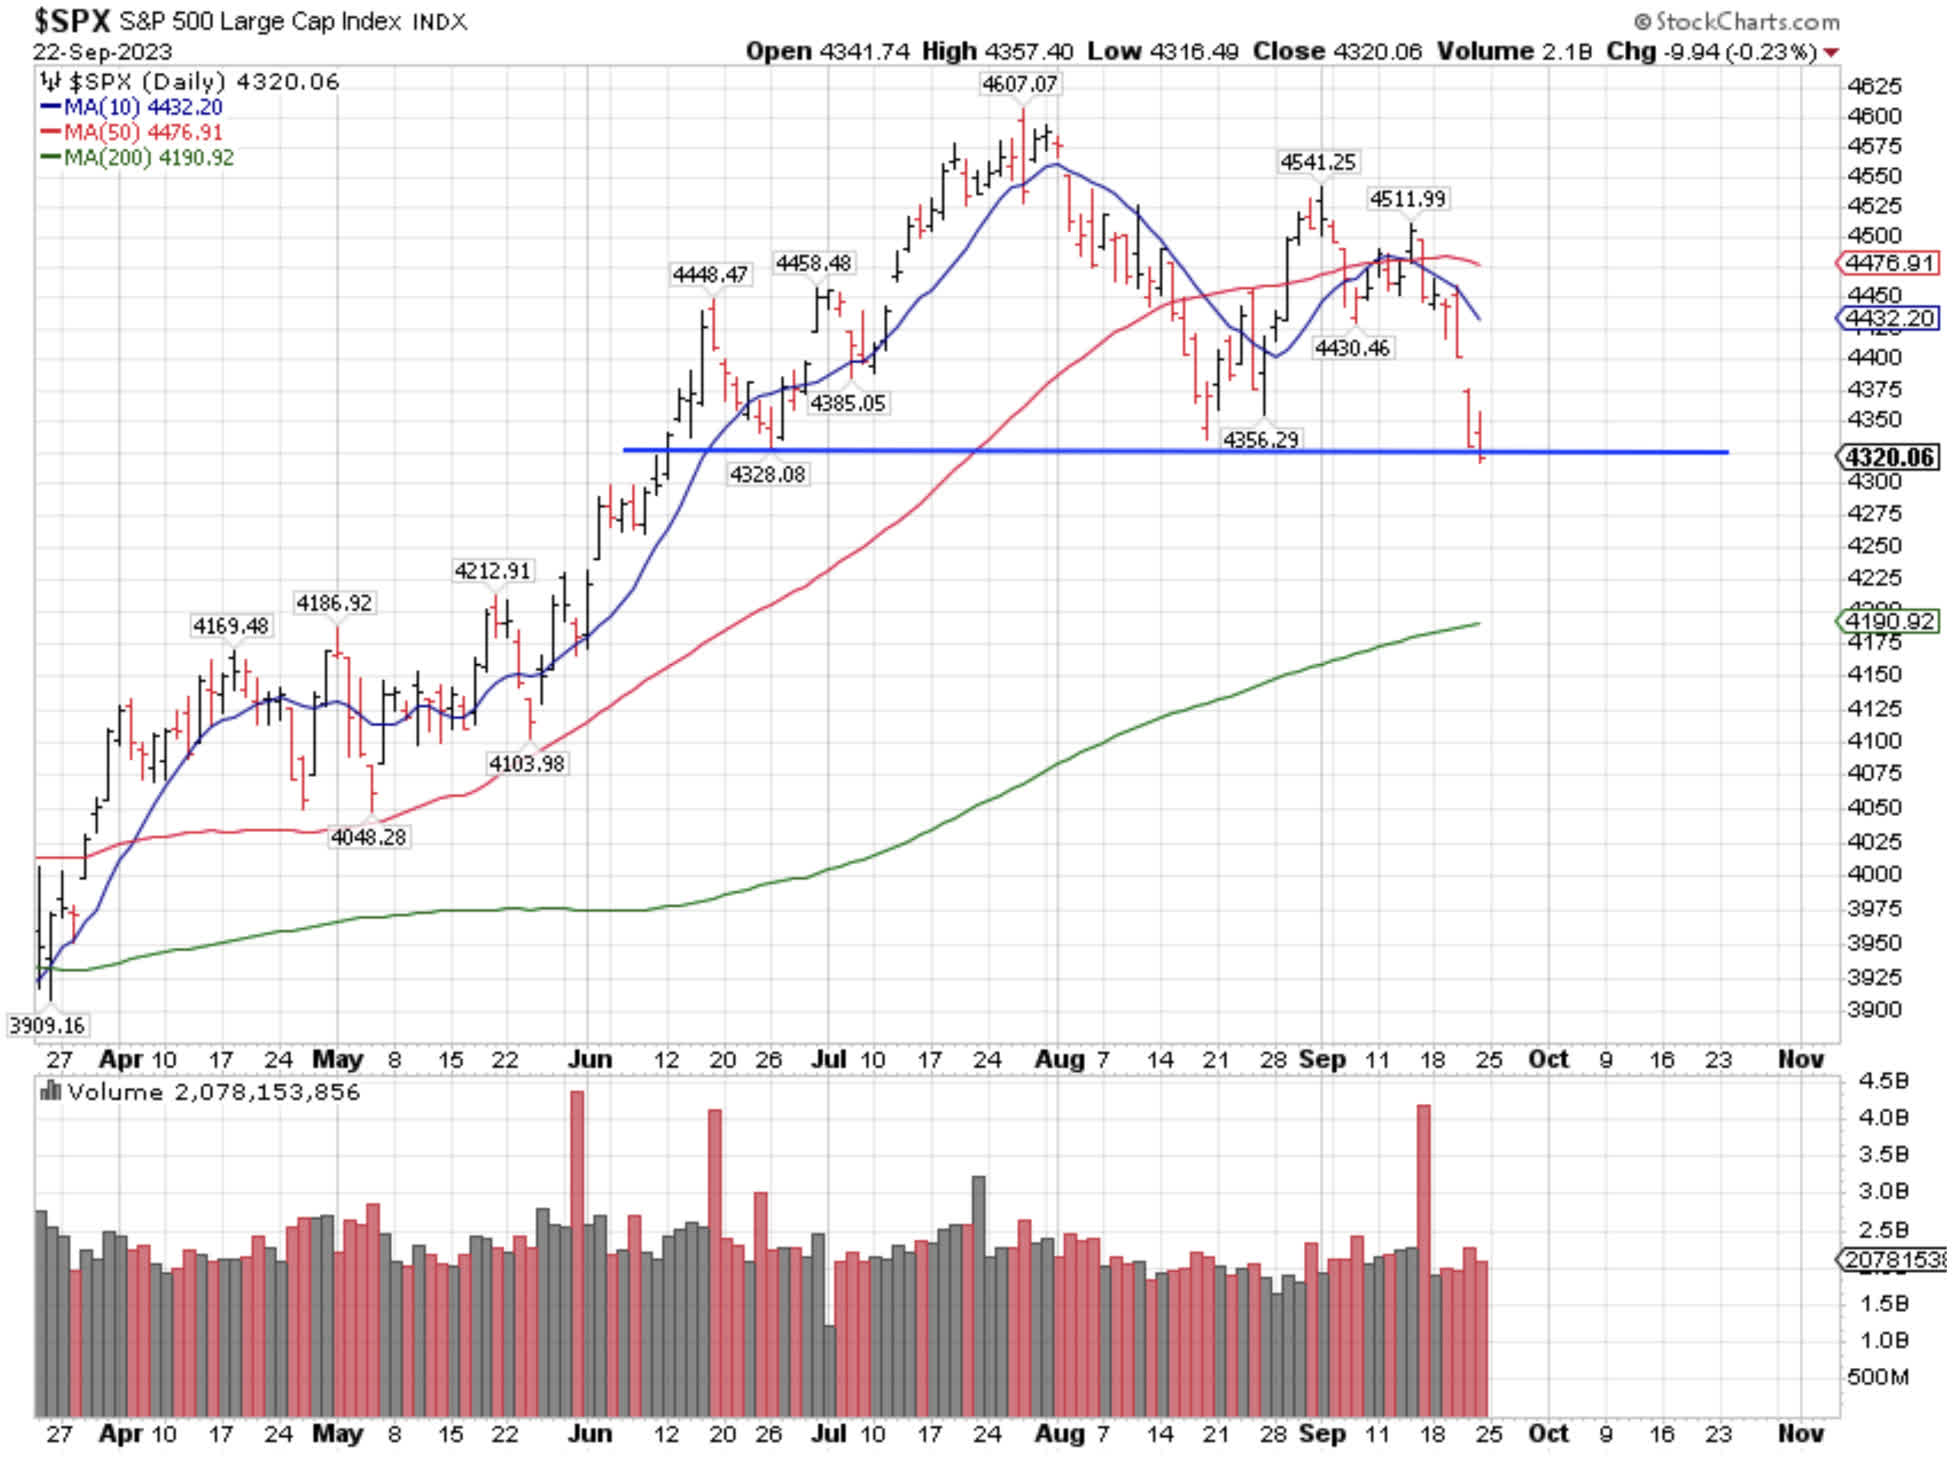
- When I drew the neckline on an obviously forming head-and shoulders top here a week ago, I did not know for sure that we would close below the neckline of that topping pattern last Friday.
- I don’t like the fact that the broadening of the stock market rally since June is now disappearing.
- That said, the market can rebound in this last week of September, but my gut feeling tells me that we need a more climactic selloff.
When I drew the neckline on an obviously forming head-and shoulders top here a week ago , I did not know for sure that we would close below the neckline of that topping pattern last Friday.
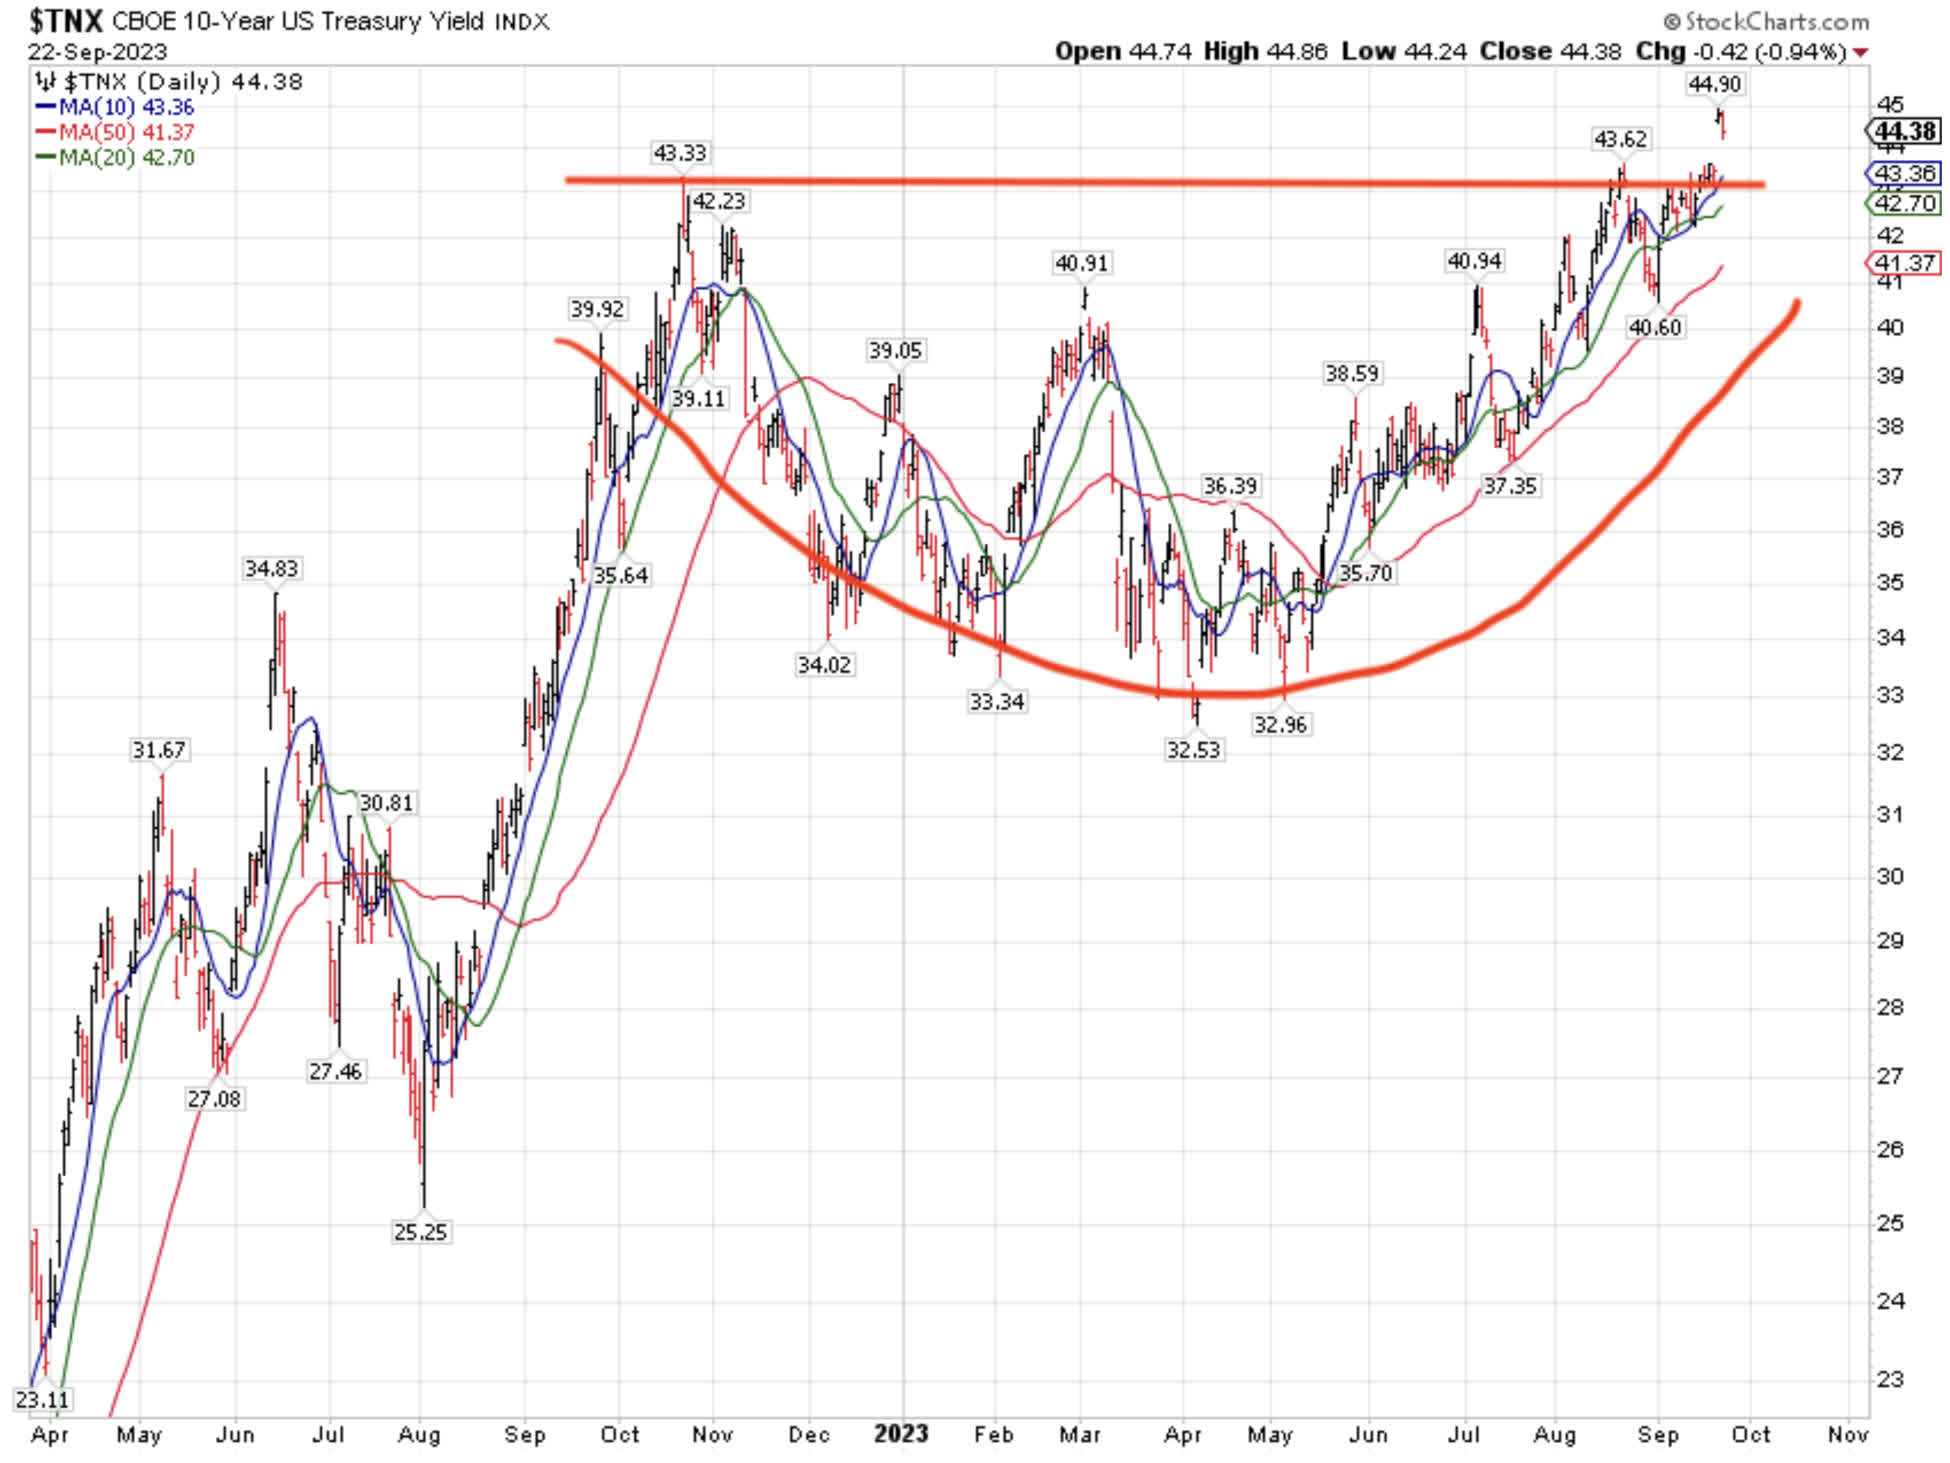
Charts are not “pure hocus pocus,” as one famous strategist used to say – and in this case, they sure aren’t – but I did wonder last week if the 10-year Treasury could make it to 4.50%.
On the night after the FOMC press conference last week, Treasury futures briefly traded above that level before backing off, so there you have it – a strong dollar, rising yields, and shrinking earnings multiples to nudge the market lower.
Graphs are for illustrative and discussion purposes only. Please read important disclosures at the end of this commentary.
If you have to measure this head and shoulders top precisely, it points to 270 points below the dreaded neckline, as the March selloff in equities did bottom out below the rising 200-day moving average, but speculation where a selloff would bottom ahead of time is an exercise in futility, as we simply do not know the future. Unpredictable events may yet happen that will guide the pace of this selloff.
Graphs are for illustrative and discussion purposes only. Please read important disclosures at the end of this commentary.
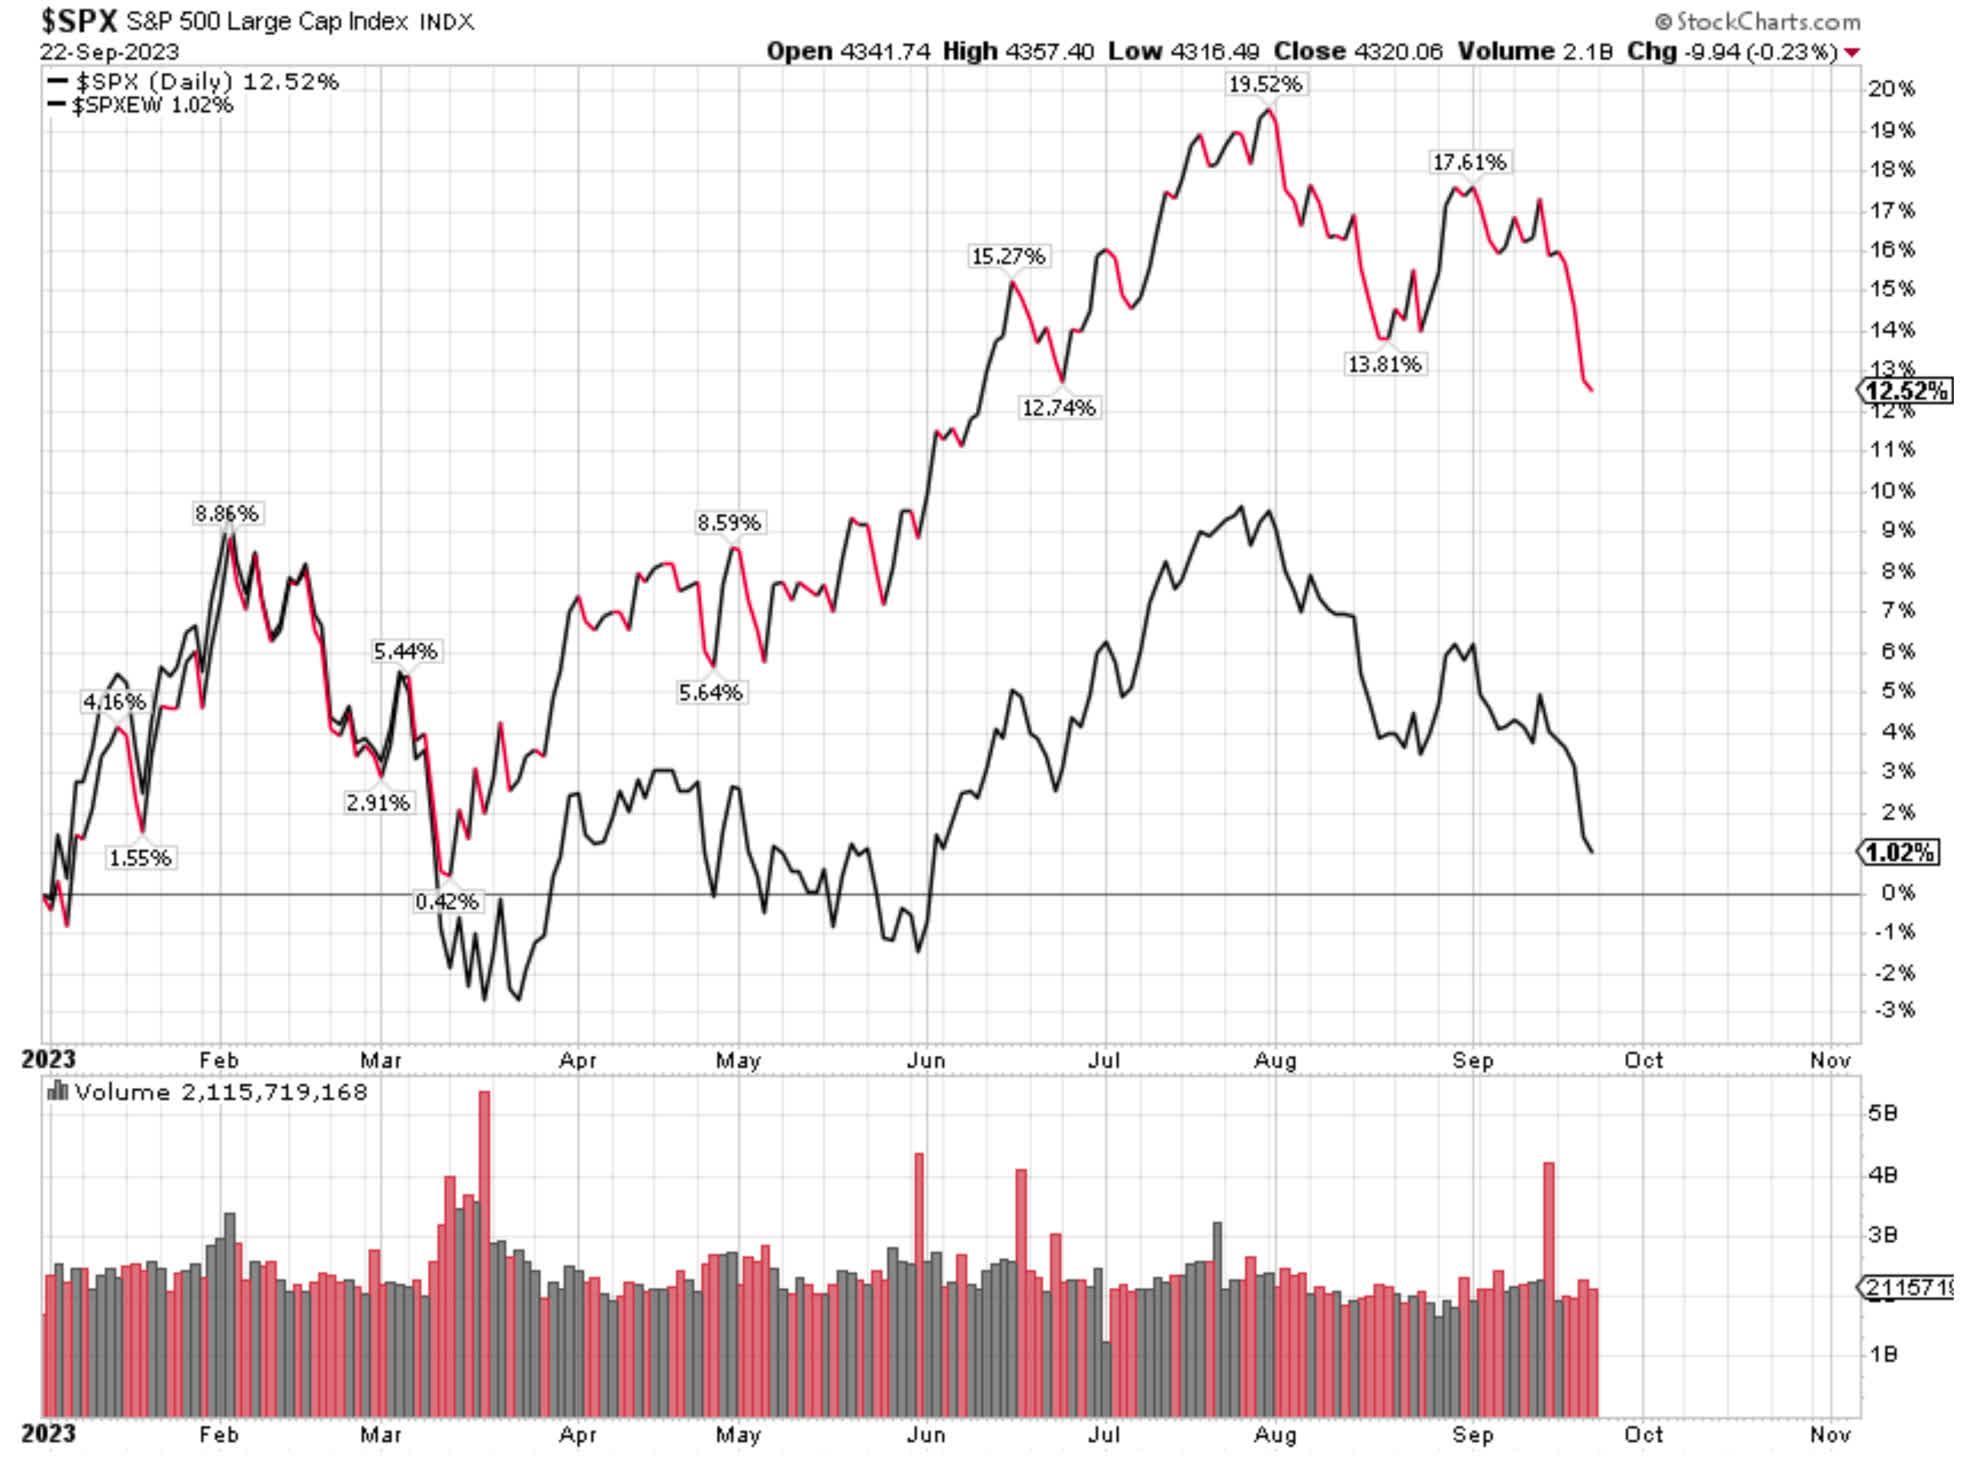
I don’t like the fact that the broadening of the stock market rally since June is now disappearing. Between the lows in May and the highs in July, the S&P 500 Equal Weight index (SPXEW) was up over 10%.
(SPXEW is the S&P 500 where every component has the same weight, as opposed to the S&P 500 index, where the mega caps pull it disproportionately one way or the other.)
The narrowness of the stock market has returned now, at a time of high interest rates, which means the market is on a less firm footing.
Several trading desks at big banks have pointed out that the market was strong in the last week before the March and June quarters. True, but it was not so strong in the last week before the June, September or December quarters of 2022, so this is not really a solid argument.
That said, the market can rebound in this last week of September, but my gut feeling tells me that we need a more climactic selloff, which we have not seen yet. It would also help if bond yields declined, as they have been pressuring stocks of late.
Graphs are for illustrative and discussion purposes only. Please read important disclosures at the end of this commentary.
Despite recent short-term tactical pullbacks in yields, which are normal in the way the Treasury market zigs and zags, we did break convincingly above the October 2022 highs, which I previously did not think probable.
If Japan ends its yield curve control ((YCC)) and lets JGB yields float higher, a move to 5.25% is possible. This would cause a surge in the yen and likely disrupt the many carry trades that have been holding the Treasury market at present yields, but this is purely theoretical and the timing is unknowable.
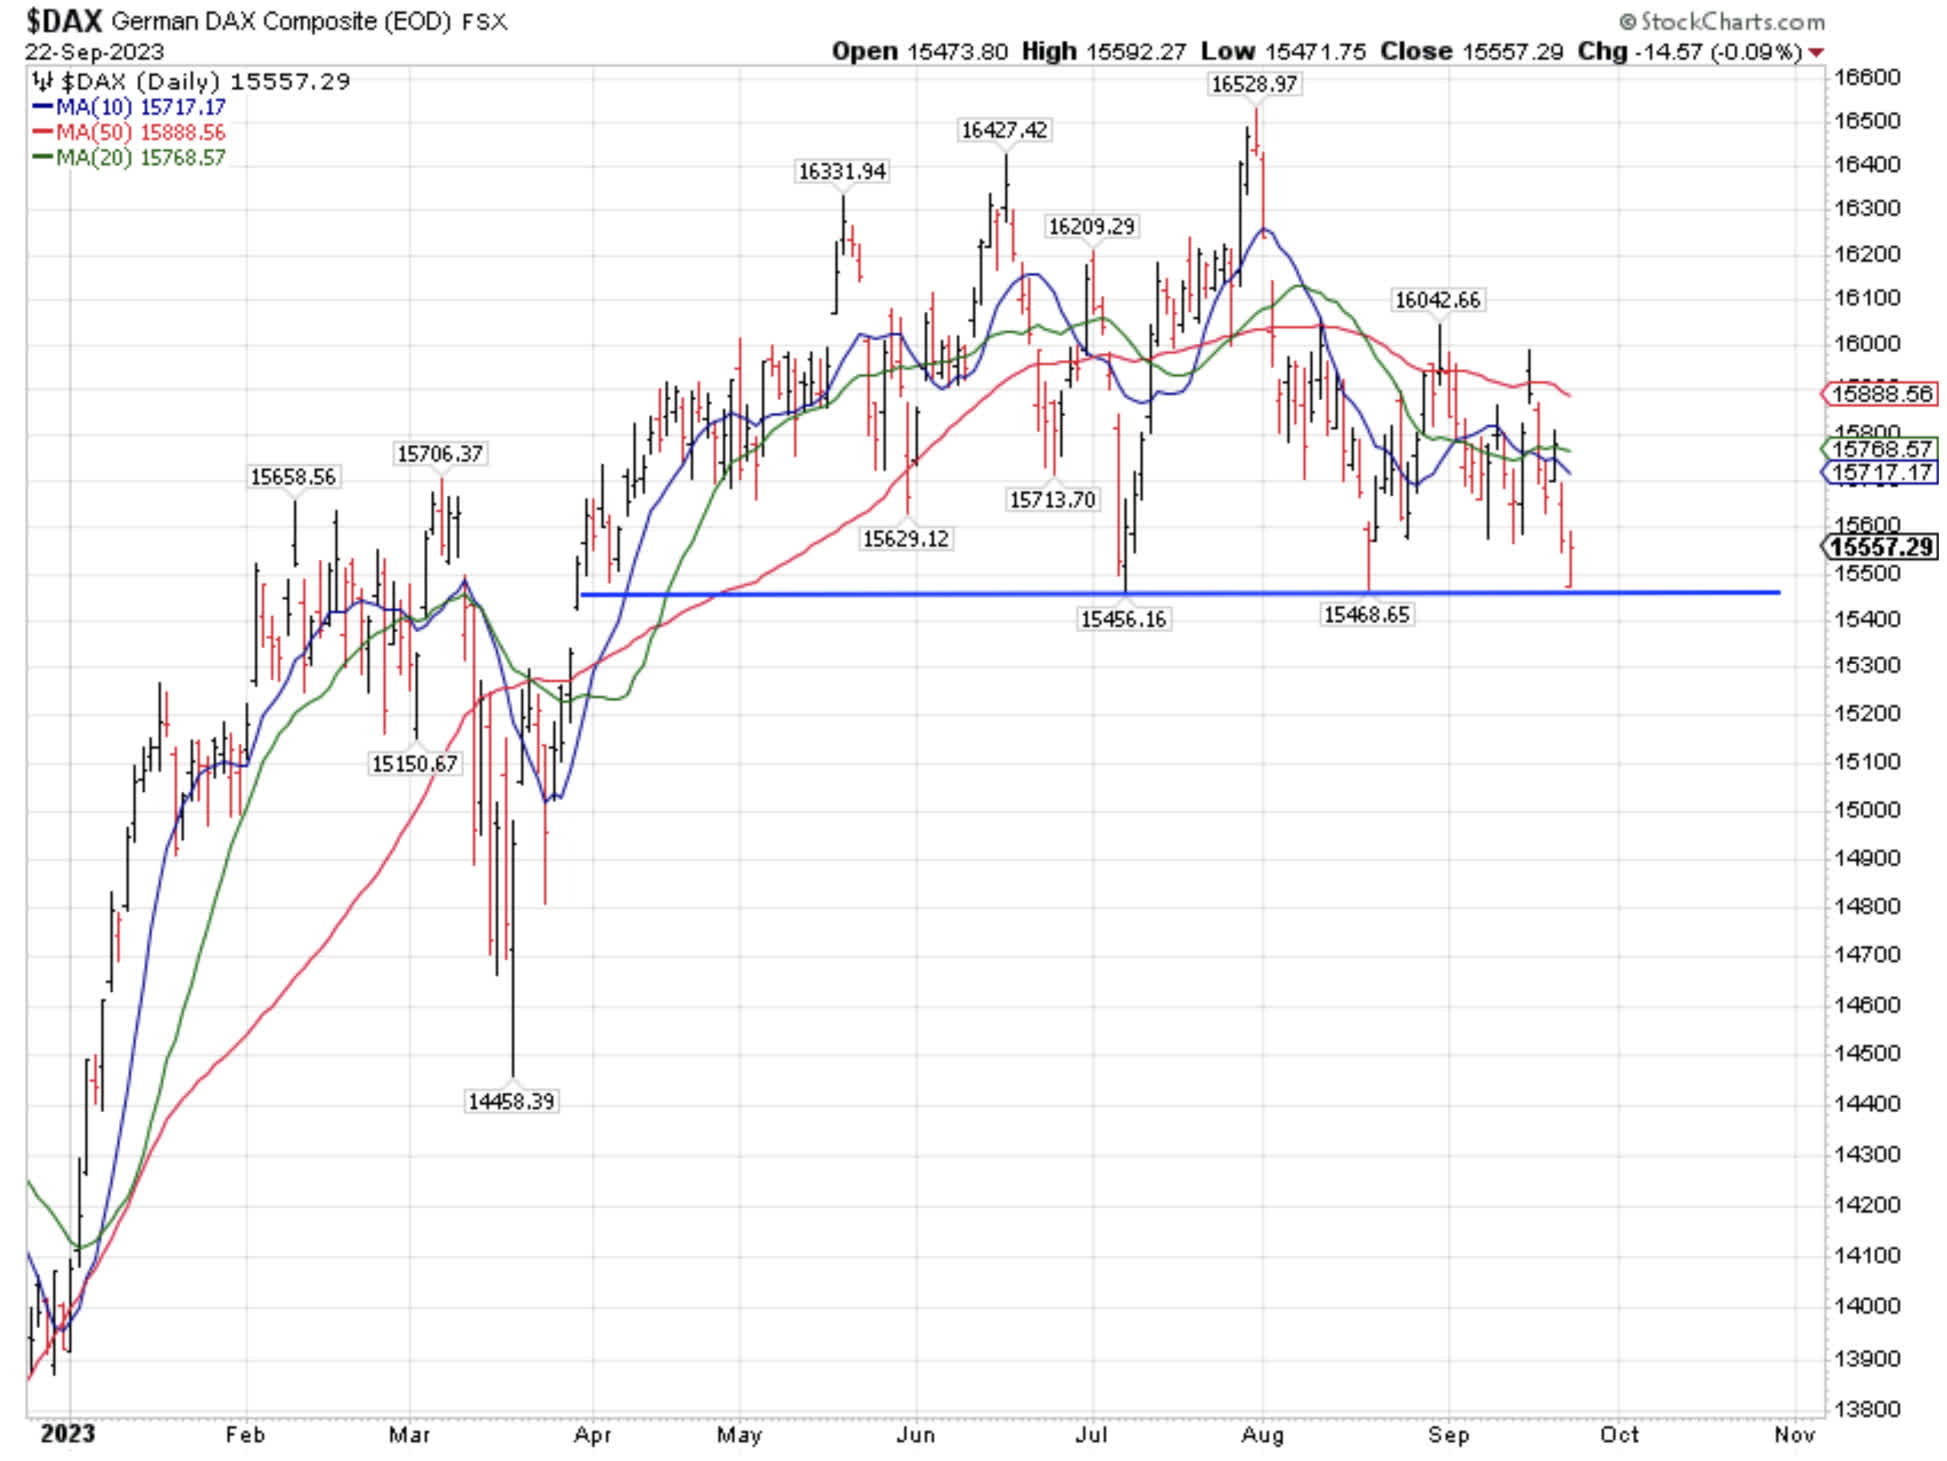
Germany is in a More Precarious Situation
The German DAX index has a similar-looking head and shoulders top. If we see sustained trading below 15,450, we may quickly test March lows on the DAX.
Graphs are for illustrative and discussion purposes only. Please read important disclosures at the end of this commentary.
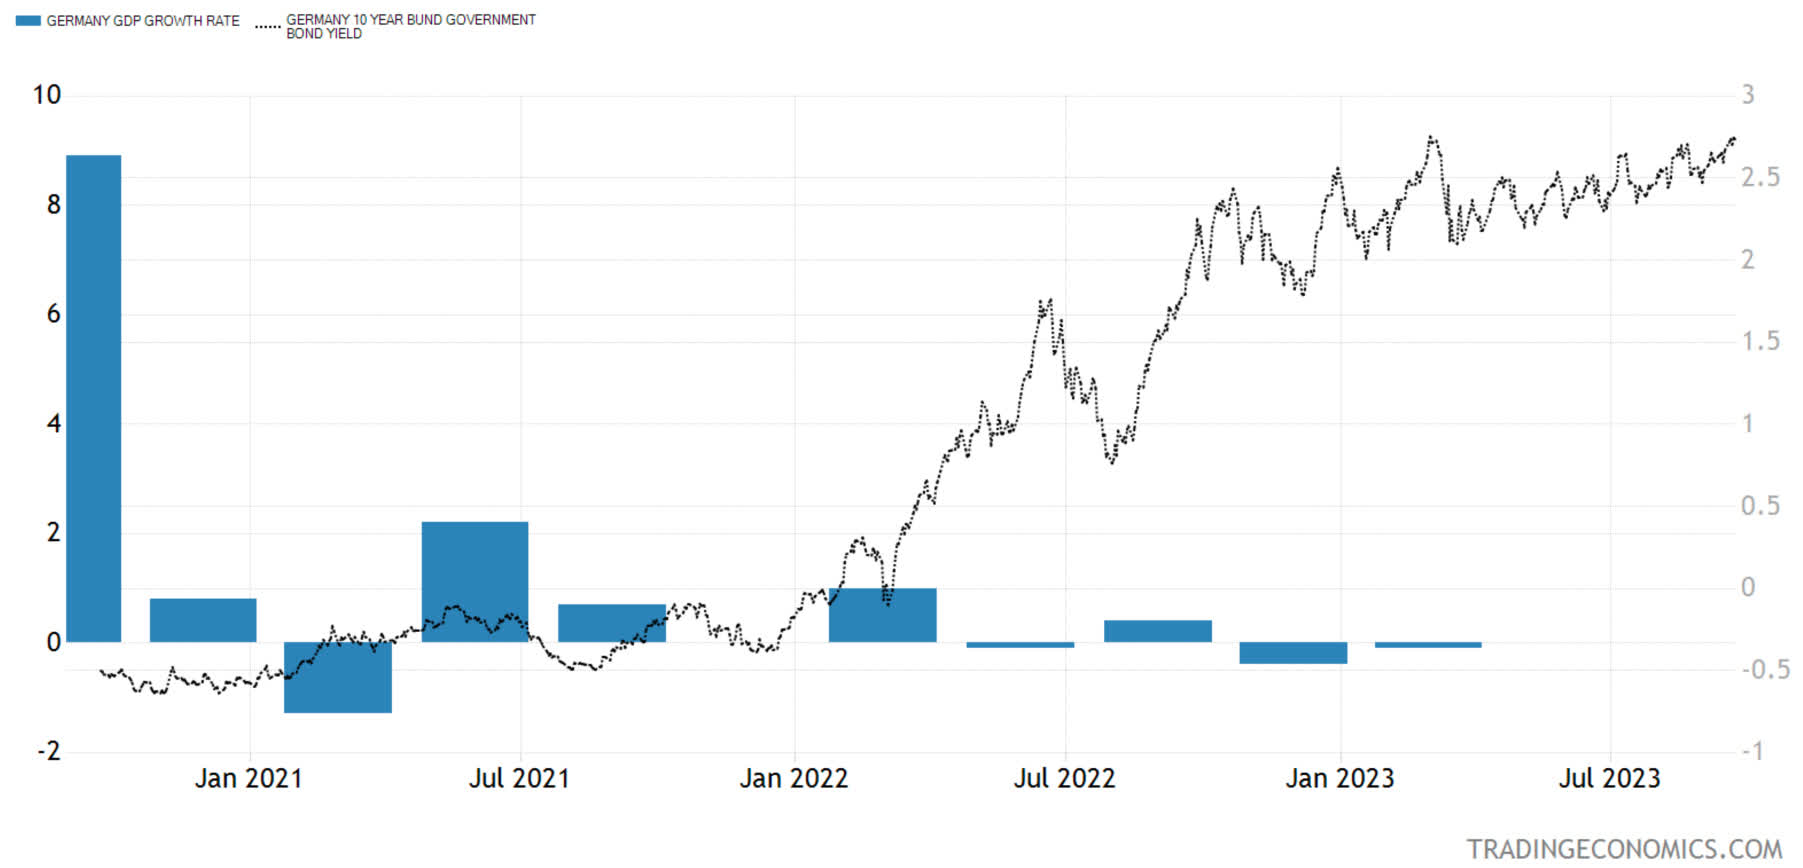
Germany, and the broader European economy, are on a much less firmer footing than the U.S. economy. Their economic indicators have weakened notably while the equity indexes have not responded.
Graphs are for illustrative and discussion purposes only. Please read important disclosures at the end of this commentary.
The German economy contracted in the first and second quarters of 2023 and the outlook for the third quarter is not very good, yet the German DAX Index made an all-time high over the summer in the middle of this mild recession.
I think the reason is that earnings for German companies are derived primarily from abroad, which is why the index is not responding to the sluggish domestic economy yet.
Be that as it may, DAX futures have a strong correlation to S&P futures in the 2-8am time frame (before Wall Street data releases and trading on this side of the pond takes over). Should this head and shoulders top on the DAX Index break and get momentum to the downside, U.S. trading will be decidedly negative.
All content above represents the opinion of Ivan Martchev of Navellier & Associates, Inc.
Disclosure: *Navellier may hold securities in one or more investment strategies offered to its clients.
Disclaimer: Please click here for important disclosures located in the "About" section of the Navellier & Associates profile that accompany this article.
Editor's Note: The summary bullets for this article were chosen by Seeking Alpha editors.
For further details see:
Target For The Correction In Equities Is Still The 200-Day Moving Average