SNBR - Tempur Sealy Is Underpriced Only If You View It As A Growth Company
2024-01-05 03:30:08 ET
Summary
- TPX's revenue growth has been primarily driven by major acquisitions. I have concerns about its ability to achieve high growth without further acquisitions.
- The company is fundamentally sound, with a strong track record of generating cash flow from operations, and has a good cash conversion ratio.
- There is only a margin of safety in the company's valuation if it continues with its acquisition strategy. Otherwise, there is no margin of safety.
Investment thesis
Over the past 8 years, Tempur Sealy's (TPX) revenue grew at 7 % CAGR due mainly to the USD 0.5 billion acquisition in 2021. Without the acquisition, revenue growth would only be at about the long-term GDP growth rate. I also have concerns about its ability to achieve productivity and capital efficiency improvements without the acquisition.
Nevertheless, the company is fundamentally sound with the past 8 years' average returns greater than the cost of funds. Notwithstanding the high Debt-Capital ratio, it has a strong track record in generating cash flow from operations with a good cash conversion ratio.
The only concern is that there is only a margin of safety if you assume that TPX will undertake another major acquisition within the next 5 years. There is no margin of safety if there is no such acquisition plan.
Business background
TPX is a leading designer, manufacturer, distributor, and retailer of bedding products to consumers in over 100 countries. The company has an omnichannel distribution strategy. Its products are sold through third-party retailers, its more than 700 company-owned stores, and its e-commerce platforms.
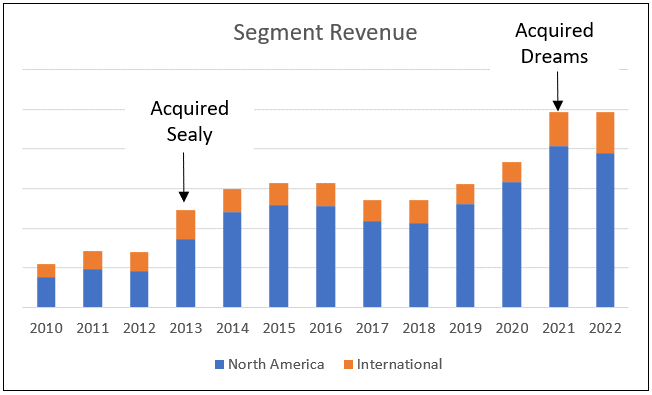
Although the company has a global manufacturing footprint with approximately 12,000 employees around the world, North America accounted for about 79% of its 2022 sales. The company has 2 business segments - North America and International.
- The North America segment consists of manufacturing and distribution subsidiaries, joint ventures, and licensees located in the U.S., Canada, and Mexico.
- The International segment consists of manufacturing and distribution subsidiaries, joint ventures, and licensees located in Europe, Asia-Pacific, and Latin America (other than Mexico).
North America was the biggest revenue contributor over the past 2 decades. From 2010 to 2022, this segment's revenue grew at 14.4 % CAGR. The International segment was no pushover either when it came to revenue growth with a 9.9 % CAGR.
These resulted in the company achieving a revenue growth of 13.3 % CAGR from 2010 to 2022. Looking at this growth rate, you can be forgiven for thinking that this is a high-growth company.
But this high growth was due to 2 major acquisitions:
- Dreams Topco Ltd, UK (Dreams) in 2021 for about USD 0.5 billion.
- Sealy in 2013 for about USD 1.0 billion.
Looking at Chart 1, you can see that these acquisitions resulted in revenue spikes in the respective acquisition years.
Chart 1: Segment Revenue (Author)
Thrust of my analysis
Last month, I published an analysis of Sleep Number Corporation (SNBR), a competitor to TPX. I wanted to see how TPX would be fair if I adopted the same fundamental analysis and valuation approach as that for SNBR. This would then help me to decide on whether to invest in TPX or SNBR if I had to choose only one bedding company.
This is not the first time that I covered TPX as I had 3 earlier articles:
- Tempur Sealy - it is a cyclical company and should be valued as such . Jan 2023
- Tempur Sealy: Still Not The Time To Buy . May 2021
- Tempur Sealy: Time to exit. Feb 2021
The key findings from the earlier articles were:
- TPX grew due to a combination of major acquisitions, growth in the Housing Starts, and anti-dumping action.
- There is a strong correlation between the North America segment's revenue and the US Housing Starts. Housing Starts are cyclical, making TPX a cyclical company.
- Although highly geared, TPX is fundamentally sound.
- The bedding industry is not a high-growth one. The US bedding industry is projected to grow below 4 % over the next 5 to 10 years. Various market research companies have projected the global bedding market to grow between 4.2 % to 7.4 % over the next few years.
In the previous analyses, I had viewed TPX as a cyclical company and valued it as such. On such a basis, I concluded that it was overpriced.
To my surprise, the market price had increased from USD 26 per share (Jan 2021) to USD 51 per share (2 Jan 2024). Either the market is very irrational or my cyclical basis in valuing TPX was wrong. So, beware when reading my current valuation.
Given my earlier articles, I would not cover what I had done earlier. Instead, I will assess how well the company has achieved its business strategy as set out in its 2022 Form 10k:
"…to drive earnings growth with high return on invested capital and strong free cash flow…We also intend to generate earnings growth through… productivity initiatives…We have a balanced approach to capital allocation…"
To enable an apple-to-apple comparison with SNBR, I will cover the 2016 to 2023 period in my analysis of TPX. I will use the Sep 2023 LTM results as the 2023 performance.
Operating performance
I looked at two groups of metrics to get a sense of how the company had performed over the past 8 years.
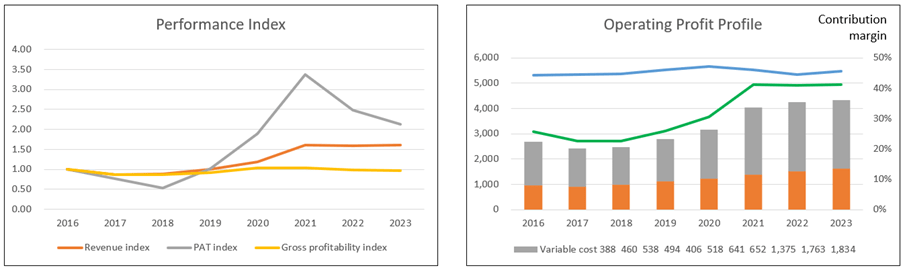
- Performance Indices for revenue, PAT, and gross profitability (gross profits / total assets). Refer to the left part of Chart 2.
- Operating profits are broken down into revenue, fixed costs, and variable costs. Refer to the right chart in Chart 2.
I had earlier mentioned that TPX's revenue growth was high due to its acquisitions. This is illustrated by the 2016 to 2023 performance:
- From 2016 to 2020 when there was no major acquisition, revenue grew at 4.5 % CAGR.
- From 2020 to 2023 when the Dreams acquisition occurred, revenue grew at 10.4 % CAGR.
Overall, from 2016 to 2023, revenue grew at 7.0 % CAGR. But PAT grew at a much faster rate at 11.5 % CAGR. This was due to higher revenue as well as the growth in gross profit margins. For example, the average gross profit margin for 2020/21 was 44.2 % compared to the average of 41.7 % for 2016/17.
The greater concern was the declining gross profitability since 2016. According to Professor Novy-Marx, this metric has the same power as PBV in predicting cross-section returns of stocks. The declining trend indicates increasing capital inefficiencies. This is counter to the company's productivity goals.
If you look at the operating profit profile of Chart 2, the gap between the revenue and the total costs (Fixed cost + Variable cost) represents the operating profit.
- The operating profits for the past 3 years (post the Dreams acquisition) had declined after peaking in 2021.
- The contribution margin has been "stable" since 2016. Technically, there was only a 0.4 % CAGR from 2016 to 2023.
Chart 2: Operating Trends (Author)
a) Note to Performance Index chart. I have converted the various metrics into indices to plot the various metrics on one chart. The respective index was created by dividing the annual values by the 2016 values.
b) Note to Operating Profit chart. I broke down the operating profits into fixed costs and variable costs.
- Fixed cost = SGA and Depreciation & Amortization.
- Variable cost = Cost of Sales - Depreciation & Amortization.
- Contribution = Revenue - Variable Cost.
- Contribution margin = Contribution/Revenue.
Returns
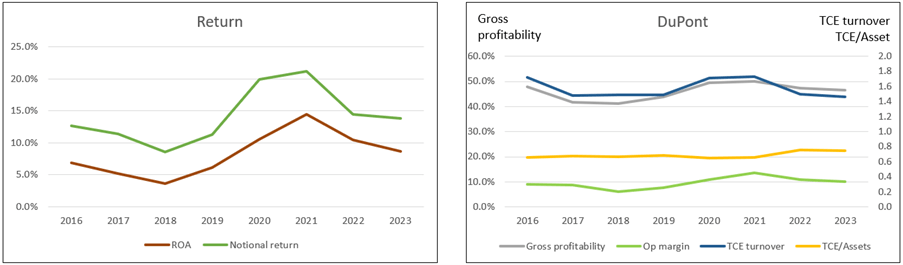
The company had an aggressive share buyback program that reduced its equity. In looking at returns, it is thus more appropriate to look at the Return on Assets (ROA) rather than ROE.
At the same time, to provide an apple-to-apple comparison with SNBR, I also looked at the Notional return on capital employed. Here I assumed that there was no share buyback. Rather all the monies spent on the buyback were distributed as dividends. In other words, the equity was assumed to be a constant at the 2015 level. I defined the Notional return as = NOPAT / (Notional equity + Debt)
The left part of Chart 3 compares the returns for these 2 metrics. You can see that both metrics were volatile - first declining from 2016 to then uptrend to peak in 2021 before declining. The 2021 peak coincided with the acquisition of Dreams.
The returns for both metrics in 2023 were a bit higher than those in 2016. In this sense, you can argue that the company achieved its return goals.
A DuPont analysis of the operating returns (defined at NOPAT / Total Capital Employed) showed that the improving returns were due to better operating margins and leverage that was partly offset by lower capital turnover.
With the lower capital turnover Together and declining gross profitability, I would conclude that the company did not achieve its productivity goals.
Looking at the past 4 years' returns and the DuPont Analysis, you may wonder whether the improving returns and productivity are due to acquisitions. Once the acquisition had been integrated, it seemed that the company was not able to extract "organic" productivity or efficiency improvements.
Chart 3: Returns and DuPont Analysis (Author)
a) Note to Return chart. The Notional return assumed that there was no change in the 2015 Equity. In other words, all the money spent on share buyback was assumed to be paid out as dividends.
b) Note to DuPont Analysis chart. The DuPont is based on Operating Return = NOPAT / Total Capital Employed. Total Capital Employed = Equity + Debt - Cash.
Financial position
I would rate TPX's financial position as average based on the following:
- It has a 91 % Debt Capital ratio as of the end of Sep 2023. As per the Damodaran Jan 2023 dataset, the Debt Capital ratio for the furniture/home furnishing sector was 36 %. It was only 13% for the household products sector.
- As of the end of Sep 2023, it had USD 92 million in cash. This was only about 2 % of its total assets.
- It did not have a good capital allocation plan as shown in Table 1. The cash flow from operations was not sufficient to fund share buybacks, dividends, and CAPEX. It had to raise additional Debt for its CAPEX and acquisitions.
Table 1: Source and Uses of Funds 2016 to 2023 (Author)
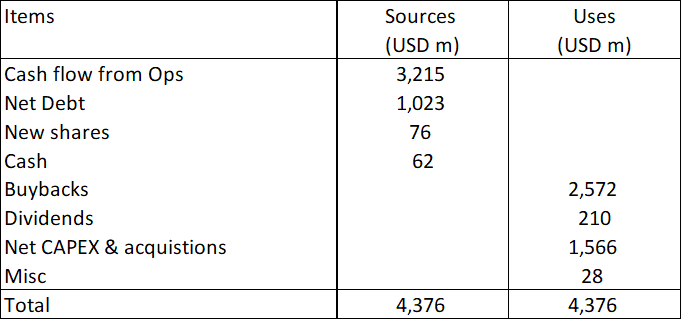
But it had some positive points:
- Over the past 8 years, it generated positive cash flow from operations every year. In total, it generated USD 3.2 billion cash flow from operations compared to the total PAT of USD 2.4 billion. This is an excellent cash conversion ratio.
- I had earlier mentioned the Notional return on capital. Over the past 8 years, this averaged 14.2 % compared to the current cost of capital of 8.5 %. This indicated that it was able to create shareholders' value.
Free cash flow
The Free Cash Flow to the Firm (FCFF) is defined as:
FCFF = EBIT(1-t) X (1 - Reinvestment rate)
Where:
EBIT(1 - t) = After-tax Operating profit or NOPAT
Reinvestment = Net CAPEX + Acquisitions - Depreciation & Amortization + Net Changes in Working Capital
Reinvestment rate = Reinvestment / EBIT(1 - t)
The Reinvestment rate would differ if we excluded Acquisitions. To see the impact of this, I considered 2 cases:
- Case 1 - taking the average 2016 to 2020 values. There were no significant acquisition during the period.
- Case 2 - taking the average 2020 to 2023 values. This covered the Dreams acquisition.
Table 2 shows the impact on the FCFF for both cases.
Table 2: Comparative FCFF (Author)
There are 2 takeaways here:
- The company was able to generate significant average FCFF annually in both cases. This is in line with its strategy of driving "…earnings growth with high return on invested capital and strong free cash flow."
- While there were higher NOPAT with acquisitions, there were also higher Reinvestment rates. Nevertheless, there was an increase in the FCFF compared to the case without the acquisition.
Note that the average annual FCFF in Case 2 is a conservative estimate. I had assumed that the impact of the acquisition was spread over 4 years. Historically the period between the major acquisitions was much larger. For example, there has not been any major acquisition since the 2021 acquisition of Dreams. The other major acquisition before Dreams was the Sealy acquisition in 2013.
Valuation
I had originally planned to value TPX based on what I did for SNBR. Given SNBR's earnings profile, I valued it based on its Earnings Power Value as well as assuming a 3% steady growth rate.
TPX's earnings profile over the same period was very different from that of SNBR. As such it made more sense to value TPX based on the following Scenarios:
- Scenario 1. This is based on a single-stage model with a 4 % perpetual growth rate. I assumed that the future revenue is based on the past 3 years' average revenue.
- Scenario 2. This is based on a 2-stage model. I assumed that there would be another major acquisition next year that would increase the past 3 years' average revenue by 10%. Thereafter revenue growth would decline to a 4 % terminal value in year 6.
In my SNBR valuation, I assumed that the long-term or terminal growth rate was half of the WACC. The 4% growth rate for TPX was based on the same logic. For both Scenarios, I assumed the following key parameters to account for the cyclical effects:
- The contribution margin was based on the 2016 to 2023 average values.
- Capital turnover (Revenue / TCE) was based on the 2016 to 2023 average ratios
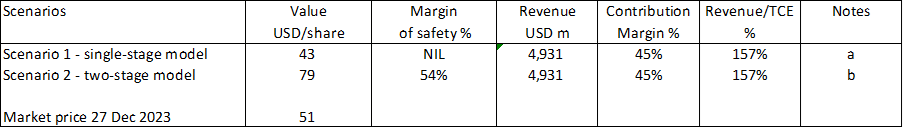
The results of the valuations are shown in Table 3.
Table 3: Summary of valuation. (Author)
Notes to Table 3:
a) The revenue shown refers to those for the base year.
b) The revenue shown refers to those for Year 1.
At USD 43 per share, there is not enough margin of safety based on Scenario 1. But at USD 79 per share, there is more than a 30% margin of safety under Scenario 2.
The margin of safety depends on your perspective of growth. The market seems to be pricing TPX as if it would continue to grow via another major acquisition in the not-too-distant future.
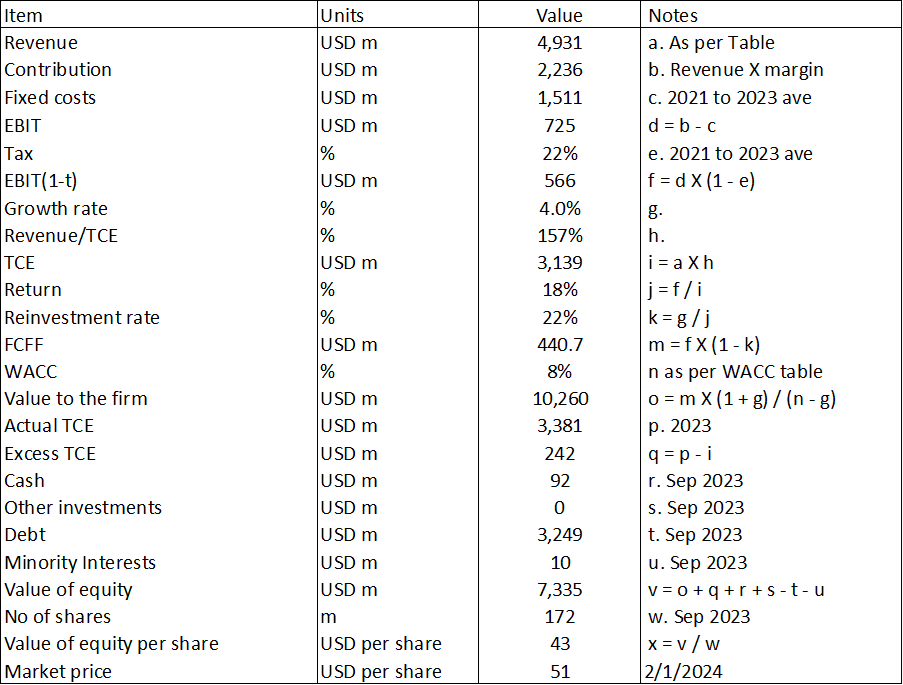
Single-stage valuation model
The single-stage model is the same as that used for SNBR. Refer to that article for a description of the model. A sample calculation for TPX is shown in Table 4.
Table 4. Sample calculation for single-stage model (Author)
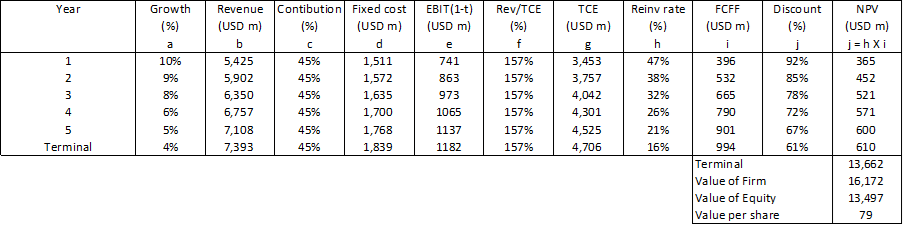
Two-stage valuation model
Table 5 illustrates the model. The key variables here are the growth rate which impacts the revenue and EBIT. The other parameters for the base year were the same as those in the single-stage model.
Table 5. Two-stage model (Author)
Notes to Table 5:
a) Straight-line reduction.
b) Pegged to growth rate
c) Assumed no improvement.
d) Assumed growth at a terminal rate.
e) Revenue X Contribution margin and after accounting for Fixed cost.
f) Assumed no improvement.
g) Revenue X (Revenue/TCE) ratio
h) Based on the growth equation.
i) EBIT(1-t) X (1 - Reinvestment rate).
j) Assumed constant D/E ratio.
Risks and limitations
There are 3 issues to consider in my valuation:
- High WACC.
- Acquisition prospects.
- Cyclical values.
The WACC used was based on the first page results of a Google search for the term "TPX WACC" as shown in Table 6.
Table 6: Estimating the WACC (Various)
We currently have a high FED interest rate resulting in a high-risk free rate. When the expected FED rate cut occurs, we will see a fall in the risk-free rate. This will lead to a lower WACC. As such, the current valuation is conservative.
The other valuation issue relates to how you see the acquisition prospects for TPX.
- If you believe that it already has a sizeable market share and there is unlikely to be another major acquisition, you would adopt the valuation model of Scenario 1.
- If you believe that there will still be opportunities for other major acquisitions, you would adopt the valuation model of Scenario 2.
Given its history, Scenario 2 seems plausible. The challenge is not knowing when this will happen. In my valuation, I have assumed that it will take place next year. If the acquisition takes place much further out in time, the value may be lower than that shown in Table 3 due to the time value of money.
I have earlier mentioned that TPX is a cyclical company. In valuing TPX, we should be looking at the performance of the key metrics over the cycle. Assuming a 2005 to 2023 peak-to-peak cycle, I then estimated the average contribution margin and Revenue / TCE for this period. Based on these, I found that there is a 14 % margin of safety using a single-stage model. The value shown in Table 3 is conservative.
Conclusion
I would rate TPX as fundamentally sound based on the following:
- Without the acquisitions, its revenue growth rate matched those of the long-term GDP growth rate and the industry. Acquisitions boosted its revenue growth.
- Even with acquisitions, it generated strong Free Cash Flows.
- While it achieved only marginal growth in the ROA and Notional return over the past 8 years, they were greater than its current cost of funds. This meant that TPX created shareholders' value.
- While it has a high Debt Capital ratio, it was able to generate positive cash flow from operations yearly. It also had a good cash flow from operations to PAT conversion ratio.
- It requires little additional capital to grow the business. While I have some concerns about its capital allocation plan, this has more to do with how management has allocated capital. The business is a cash cow.
However, I have concerns about its ability to achieve productivity or operating efficiency gains. The real challenge with TPX is the valuation. There is only a margin of safety if you believe that it will continue with its acquisition strategy to grow. I am a conservative investor so I would rather not bet on this.
Comparison with SNBR
One of the goals of this analysis was to see whether TPX was a better investment opportunity than SNBR. In this context, I compared these 2 companies based on the key parameters that drive the intrinsic value - return, Reinvestment rate, growth and financial risk. Refer to Table 7.
- Leaving aside the size and Debt Capital metrics, you can see that SNBR did better than TPX for the other metrics.
- Both companies had aggressive share buyback programs. In both cases, the amount spent on the buyback and dividends exceeded the cash flow from operations.
- Over the past 8 years, acquisitions helped to boost TPX growth whereas SNBR growth was more organic.
- SNBR has a margin of safety based on the single-stage model.
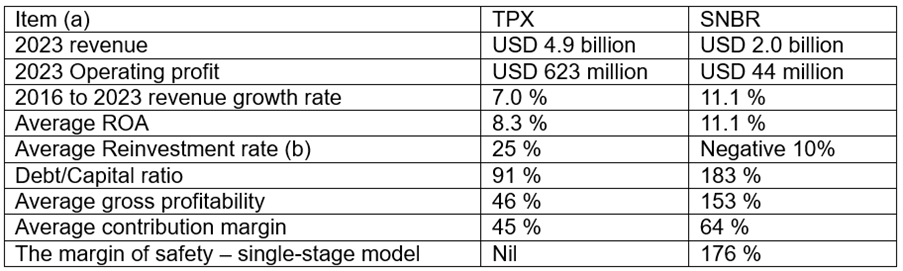
Notes to Table 7:
a) Unless stated otherwise, the average refers to the 2016 to 2023 period.
b) Excluding acquisitions.
TPX and SNBR have their respective business set-up (strategies, organization structure, corporate culture, etc). What you see from Table 7 are the results of their respective business set-up. Along this line, it I had to choose only one bedding company to invest in, it would be SNBR.
For further details see:
Tempur Sealy Is Underpriced Only If You View It As A Growth Company