TER - Teradyne: Expected Test Market Rebound In FY24 Makes It A Buy
2023-11-22 11:42:04 ET
Summary
- TER serves two markets with secular tailwinds: (1) Semiconductor Test Equipment and (2) Robotics.
- While the Semiconductor Test Equipment market is expected to grow at a CAGR of 6-8% until 2030, the Robotics market is expected to grow at 17% until 2028.
- A debt-free balance sheet, high returns on capital employed, and a generous share buyback policy are three more reasons to consider TER.
- Excluding the short-term volatility of the markets TER serves, I assume TER to be undervalued with a potential total return in the low double-digits.
- Major risks include heightened volatility due to the served markets and questions regarding the profitability of the Robotics segment.
Introduction
I first wrote about Teradyne, Inc. ( TER ) on February 28, 2023, in my article called " Teradyne and Advantest: A Duopoly In The Semiconductor Value Chain ". In that article, I covered Teradyne and its main competitor in the semiconductor test equipment market, Advantest Corporation ( ATEYY , ADTTF ). I recently wrote an update on Advantest while I never wrote a dedicated follow-up piece on Teradyne. My February article solely focused on the semiconductor test equipment market. Here is what I wrote back then:
As this article will focus on the semiconductor test market I won't further elaborate on Teradyne's other segments. I will probably write a stand-alone article on both companies sometime in the future and will cover Teradyne's other segments in the respective article.
Source: February article
As I think that the semiconductor test equipment market will start to recover in CY2024 (as I outlined in my recent Advantest update), now seems to be a good time to write this stand-alone article I promised back in February.
Back in February, TER traded at around $100 per share, higher than the current $91.76 per share. So in hindsight, my buy rating back then underperformed the broader market (the S&P 500 is up around 14% since then). TER's main competitor Advantest on the other side, which I rated a strong buyback then, has performed very well, with a total return since February of 59.7%. So is TER set up for a rally to close the gap to Advantest or is the underperformance due to operational factors? Time to find out.
Business Overview
TER operates in four segments: (1) Semiconductor Test, (2) System Test, (3) Wireless Test and (4) Robotics. I will just give a short introduction to each segment before dedicating a standalone chapter to all of them.
The Semiconductor Test segment does exactly what we would expect. It offers equipment to test semiconductors. Testing is conducted at two levels : (1) The wafer test (that tests wafers) and (2) the package test (final test) after packaging. Semiconductors have to be tested for various reasons, for example, to improve and control product quality, measure and improve performance or increase production yields. Simply said, as the number of produced semiconductors (and the complexity that comes with them) increases, the demand for testing will increase as well. This should be a secular tailwind for Teradyne and Advantest.
"System Test" comprises three business units: (1) Storage Test, (2) Defense/Aerospace, and (3) Production Board Test. Storage Test addresses HDD (hard disk drive) and is driven by desktops, laptops, external HDD storage products, data centers, and cloud storage. Note that the Storage test takes place after the initial testing process I described earlier. Defense/Aerospace products are used to ensure the readiness of military and commercial aerospace electronics systems. Production Board Test systems are used by electronics manufacturers and OEMs to test manufactured products (like automotive electronics and smartphones).
"Wireless Test" is the least important segment in my opinion. This segment operates under the LitePoint brand name and provides test solutions utilized in the development and manufacturing of wireless devices and modules.
The "Robotics" segment is expected to be the most important growth driver for the company. The segment is divided into two units: (1) Universal Robots and (2) Mobile Industrial Robots (MiR). Universal Robots offers collaborative robots that work alongside production workers. They are designed to mimic the motion of a human arm and can offer support for various tasks. The newest model, the UR20, has a payload capacity of 20kg. MiR offers autonomous mobile robots for manufacturing and logistics.
Semiconductor Test
I have been writing a lot about the semiconductor test equipment market in my prior articles so I will try to keep this short. The semiconductor test equipment market is split up between Teradyne and Advantest. Both companies combined hold more than 95% market share.
McKinsey & Company estimates that the overall semiconductor market will grow with a CAGR of 6-8% until 2030. This is in line with both companies' expectations.
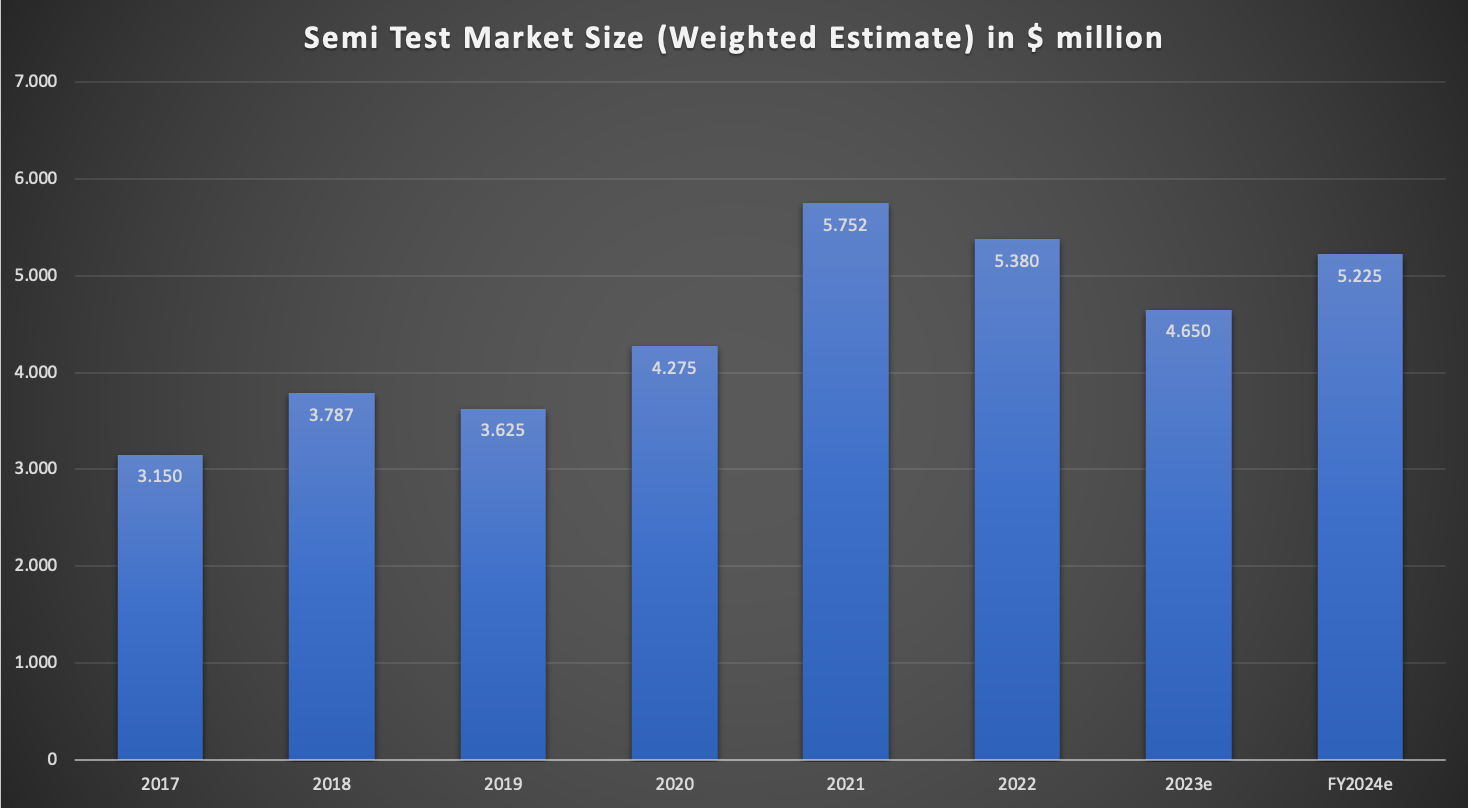
Here is a chart, showing the total semiconductor test equipment market size, that I came up with in my recent Advantest article after digging through both companies' earnings calls:
Semiconductor Test Market Size since 2017 (Company reports/earnings call - Compiled by Author)
The growth CAGR since CY17 assuming that the market will recover to reach $5.225 billion in CY24, would come in at 7.5%. This is in line with the estimates by McKinsey.
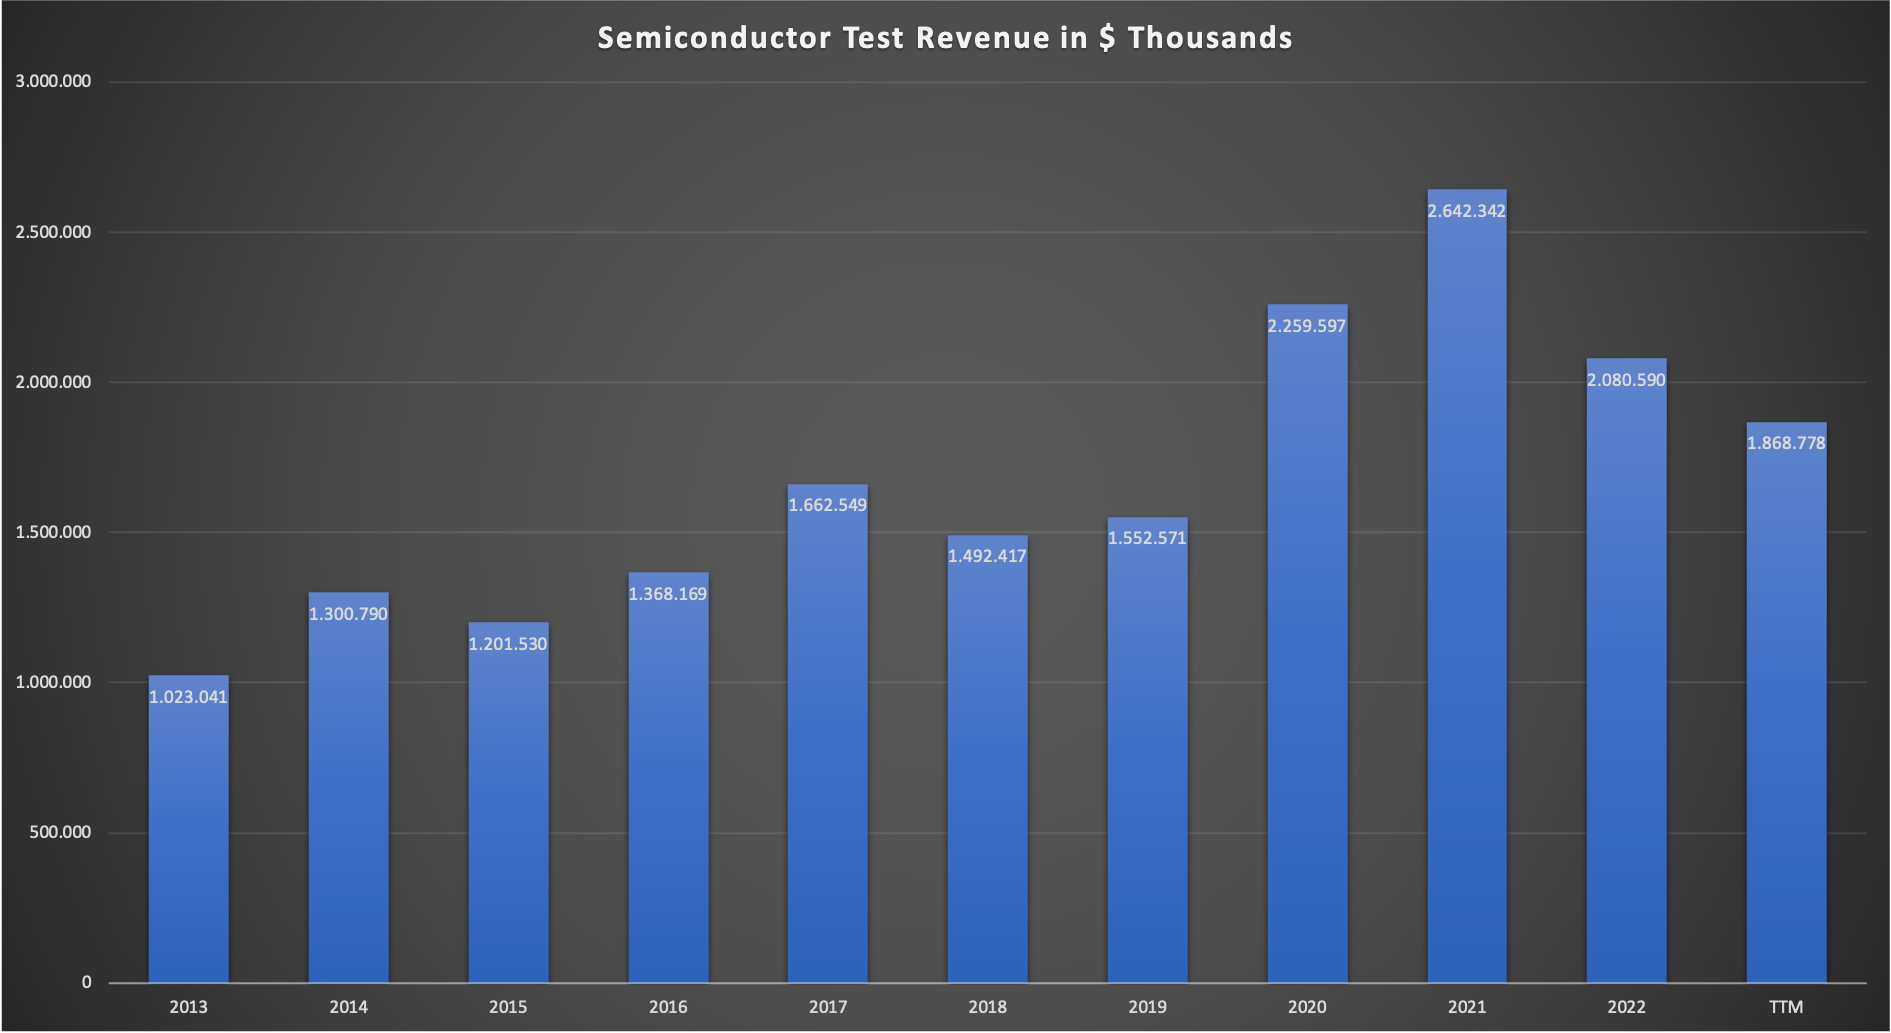
The market size declined after reaching a peak in CY21, with a recovery being expected in CY24. This also shows in TER's reported numbers. Here is a chart showing TER's semiconductor test revenue since FY13:
TER Semiconductor Test revenue since FY13 (Company 10-Ks - Segment Reporting)
We can see that the revenue trend over the last 2-3 years followed the trend of the overall test market size. There have been some market share fluctuations but overall TER's market share hovered around 40-45% over the past few years. The revenue CAGR from FY13-FY22 came in at 8.2%, a bit above the aforementioned McKinsey estimate of 6-8% going forward.
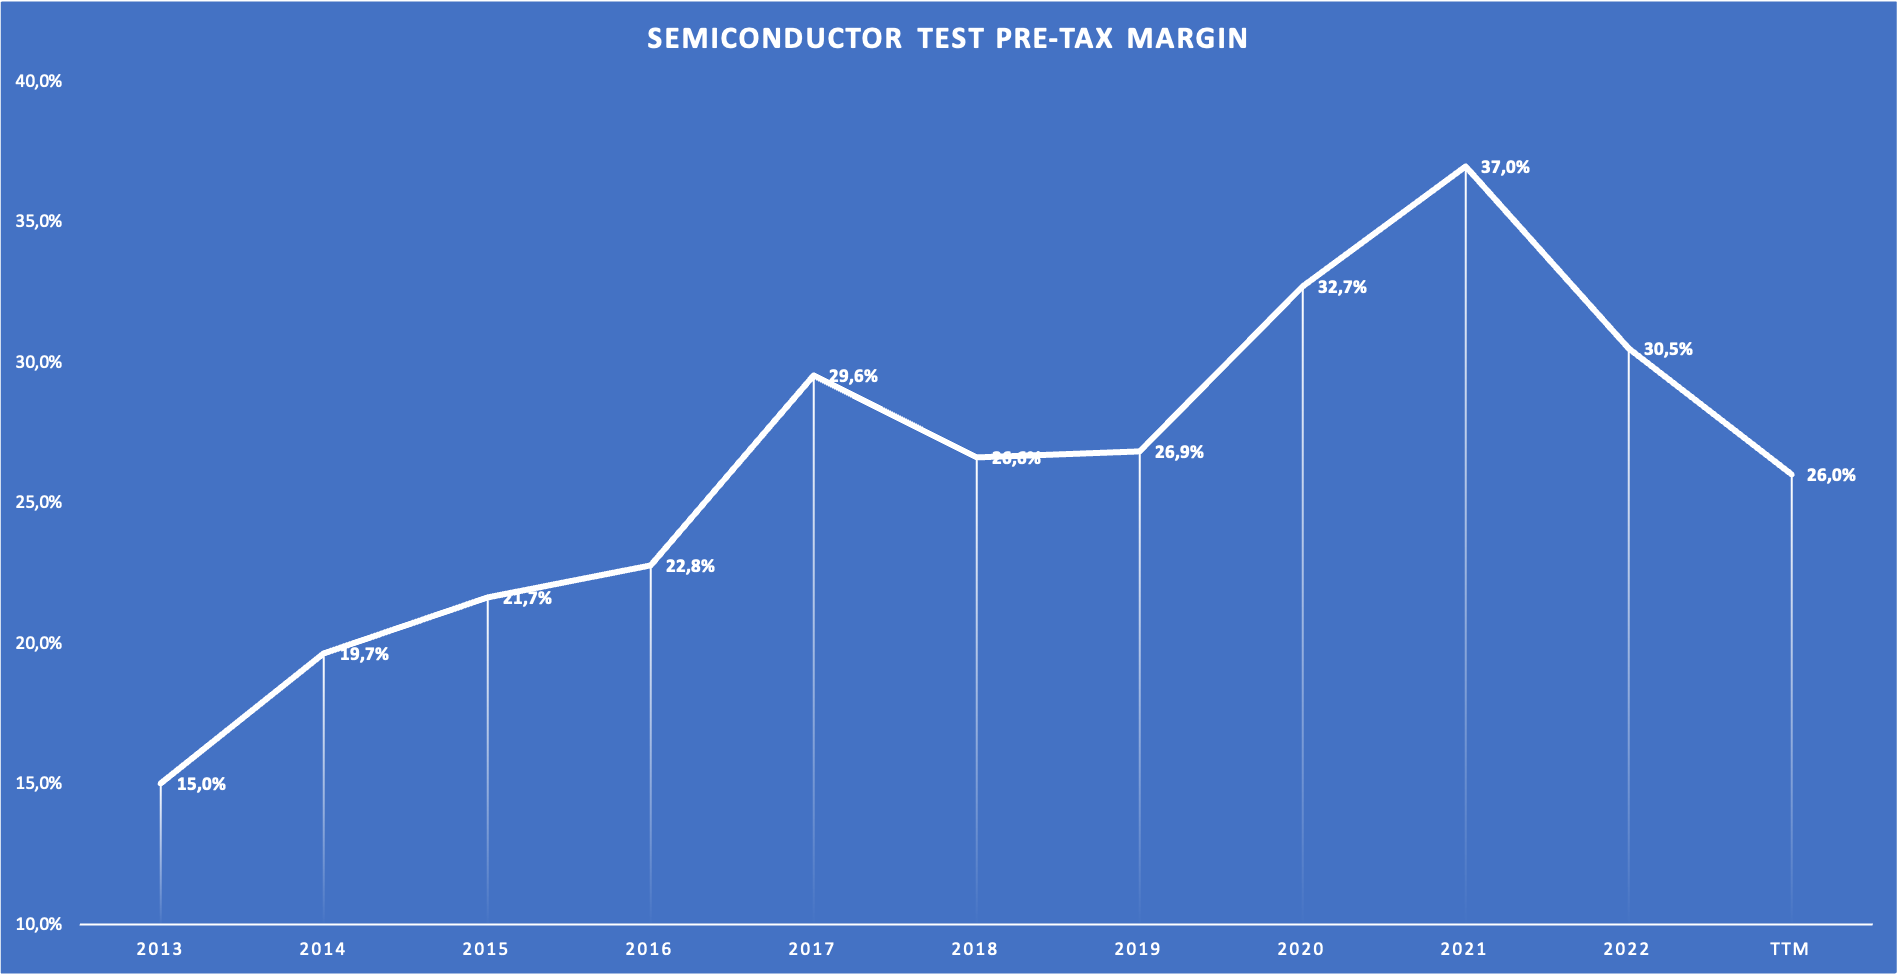
We can also see the market size effects in the pre-tax margin (on an unconsolidated level):
TER Semiconductor Test EBT Margin since FY13 (Company 10-Ks - Segment Reporting)
The EBT margin peaked in FY21, the year that the market size and the revenues peaked. Since then, it dropped hand in hand with market size and revenue.
With the expected recovery in CY24, we will probably see a significant recovery in revenue and margins, leading to a meaningful rebound in pre-tax earnings of the semiconductor test segment.
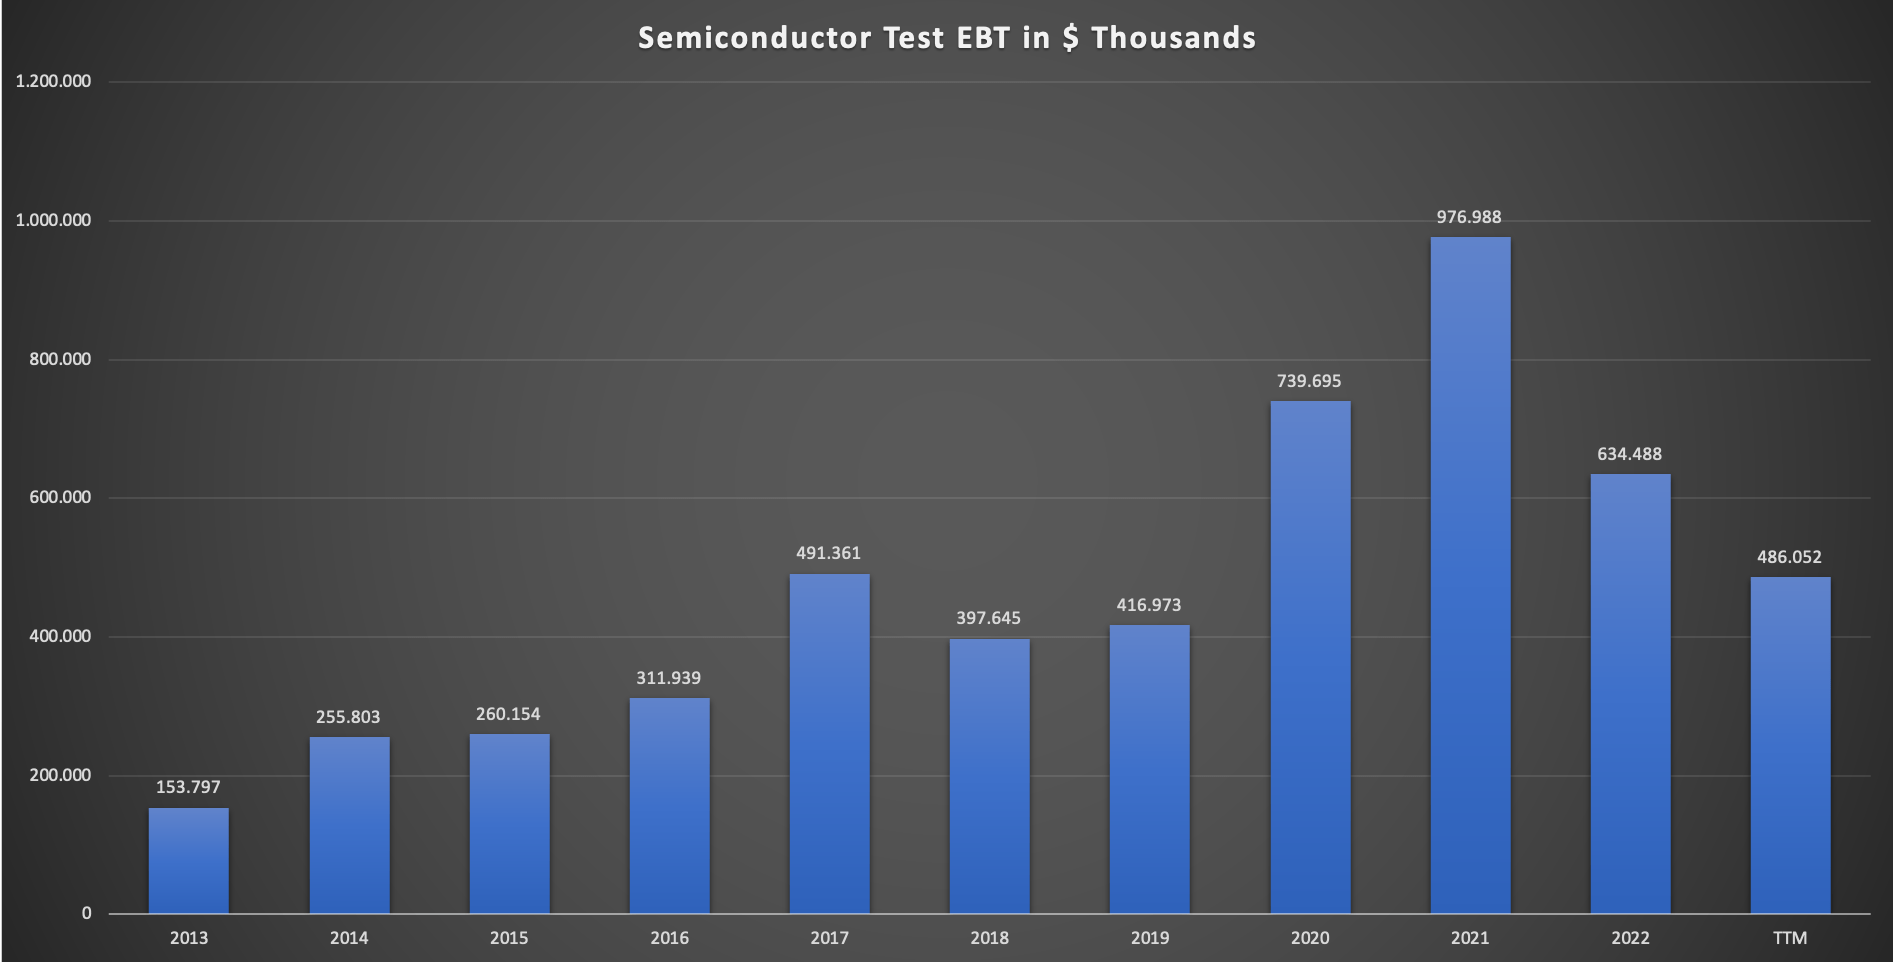
For the sake of completion, here is the chart showing the segments' EBT since FY13:
TER Semiconductor Test EBT since FY13 (Company 10-Ks - Segment Reporting)
Here we can see the effect of the margin declines on the earnings.
I estimate that the CY24 market size will reach $5.225 billion. Assuming that revenue and margins move hand in hand with market size, I think that TER might report around $2.1 billion in revenue and $615 million EBT (EBT margin of 29.2%) for FY24. This assumes a market share of around 40% which is the lowest market share has been since CY17, so I think my assumptions are rather conservative. I also see quite some upside in the following years as the market size rebounds back to the longer-term trendline.
System Test
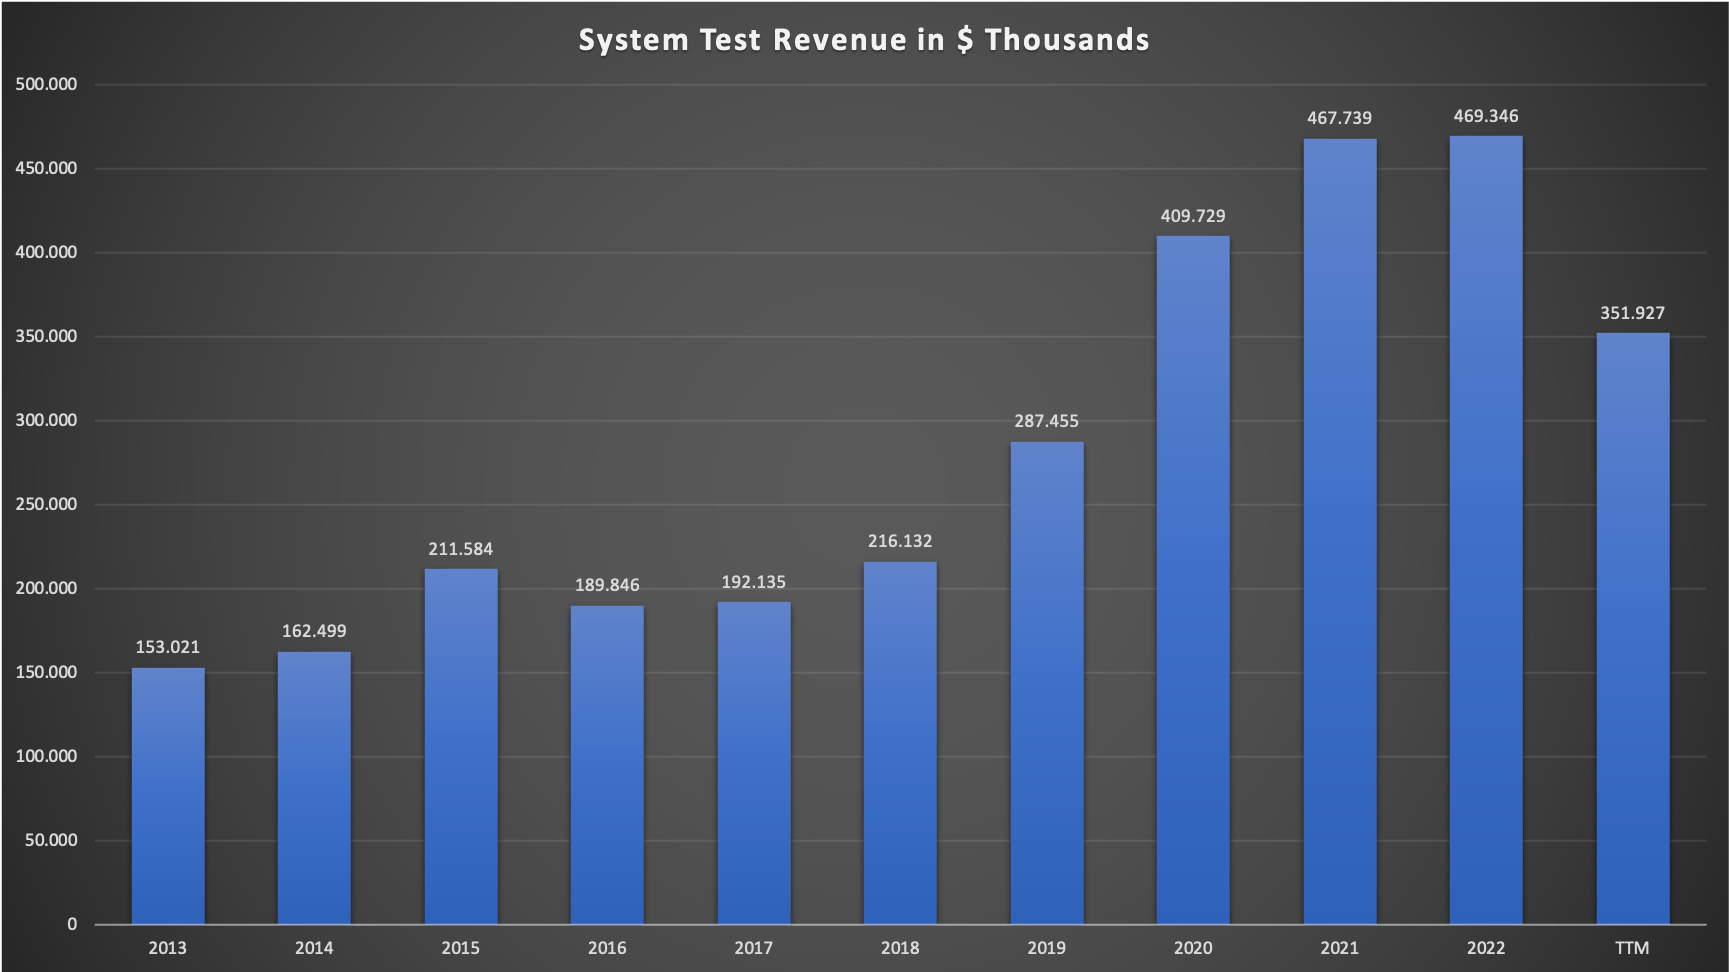
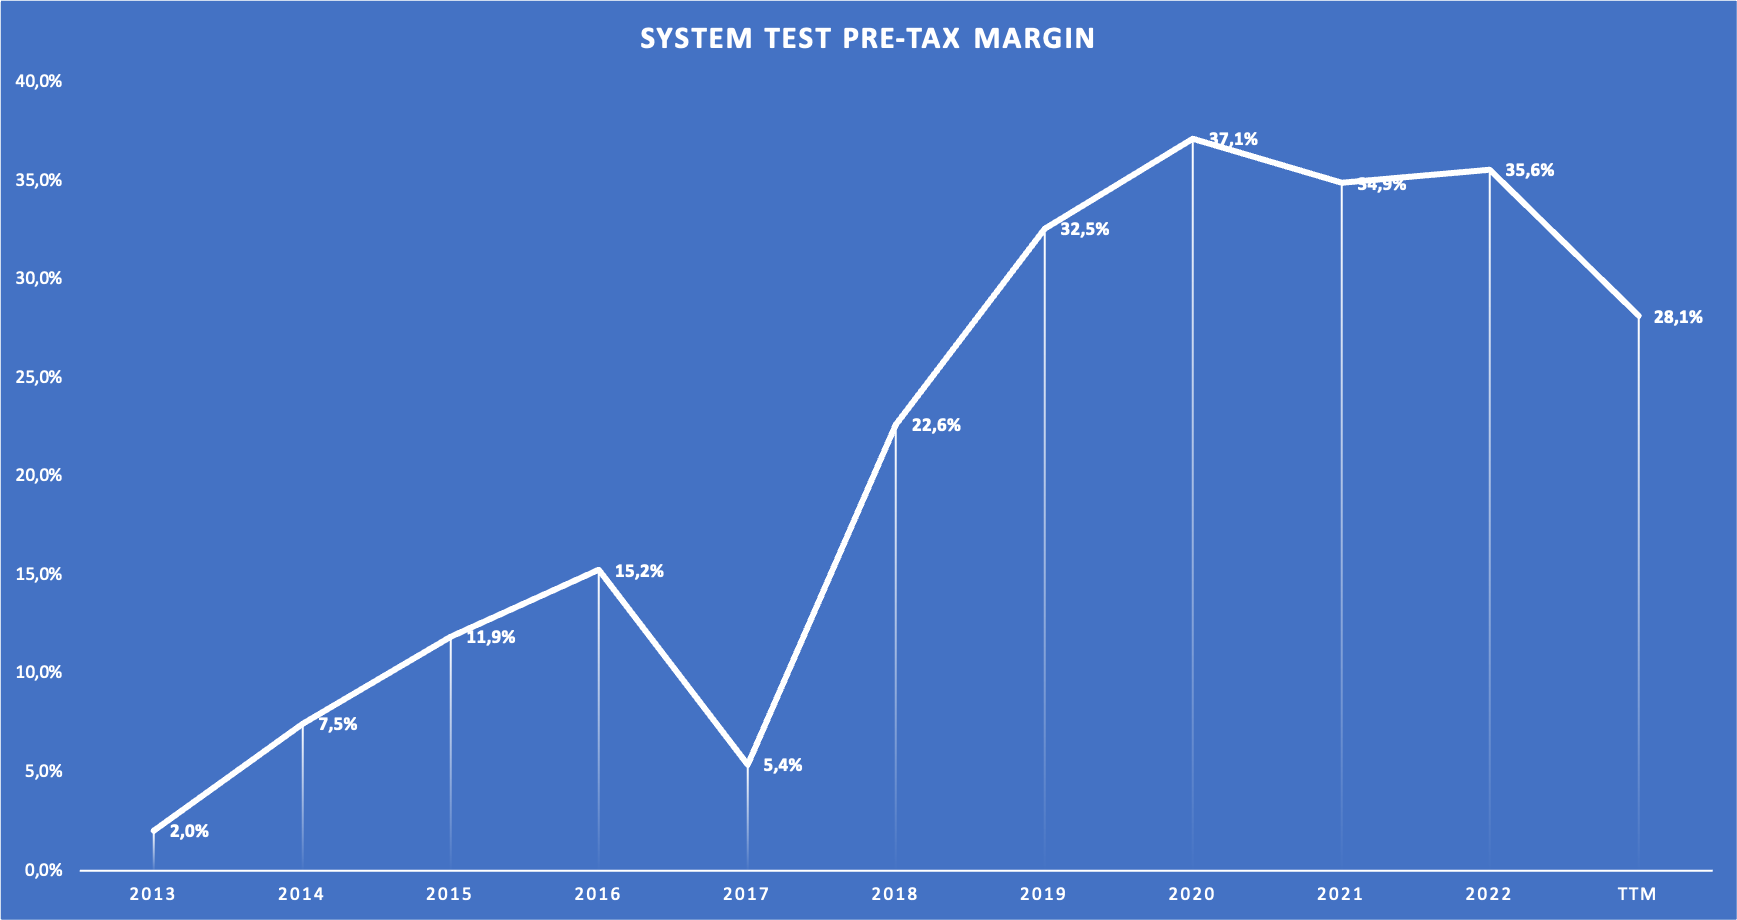
I will start with two charts:
TER System Test Revenue since FY13 (Company 10-Ks - Segment Reporting) TER System Test EBT Margin since FY13 (Company 10-Ks - Segment Reporting)
System Test revenue grew with a CAGR of 13.3% from FY13-FY22, an impressive growth rate. It is distorted by the peak in FY22 of course. I couldn't find any detailed information regarding the composition of this segment's revenue between aerospace, storage test, and production board test.
Since the segment offers solutions to memory/storage producers and electronic device manufacturers/OEMs, my best guess is that this segment is highly dependent on the overall state of the economy (new laptops, cars, smartphones for example). This would also explain why the revenue was flat from FY21 to FY22 (while semi-test revenue declined in line with the underlying market) and only started to contract this year. Here is what TER's CEO Greg Smith had to say on the near-term outlook for the System Test segment in the most recent Q3 23 earnings call:
System-level tests will depend largely on smartphone unit growth in the near-term while we expect our defense and aerospace business to grow in 2024 on increased defense investments worldwide.
Source: TER Q3 23 Earnings Call
Later in the call, TER's CFO Sanjay Mehta said that for Q3 23, the System Test revenue of $83 million included $38 million in storage test. Keep in mind that this is a year when the memory/storage market is under pressure. So we can conclude that in a "normal" year System Test should be around 50% storage test.
So what can we expect from the System Test segment going forward? My best guess is that the segment might grow in the range of 6-8% with the semi-test segment, probably at the lower range. This is due to the high exposure to the memory/storage market.
Wireless Test
As I stated earlier, I think that Wireless Test is TER's least important segment. Let's take a look at the numbers. FY13 revenue came in at $252 million while FY22 revenue came in at $202 million. So revenue declined over the past decade. EBT on the other hand was volatile but increased nearly three-fold from $23 million in FY13 to $67 million in FY22. This is solely attributable to higher margins. I wouldn't bet on any more margin expansion in the future. I will just assume zero growth for this segment.
Robotics
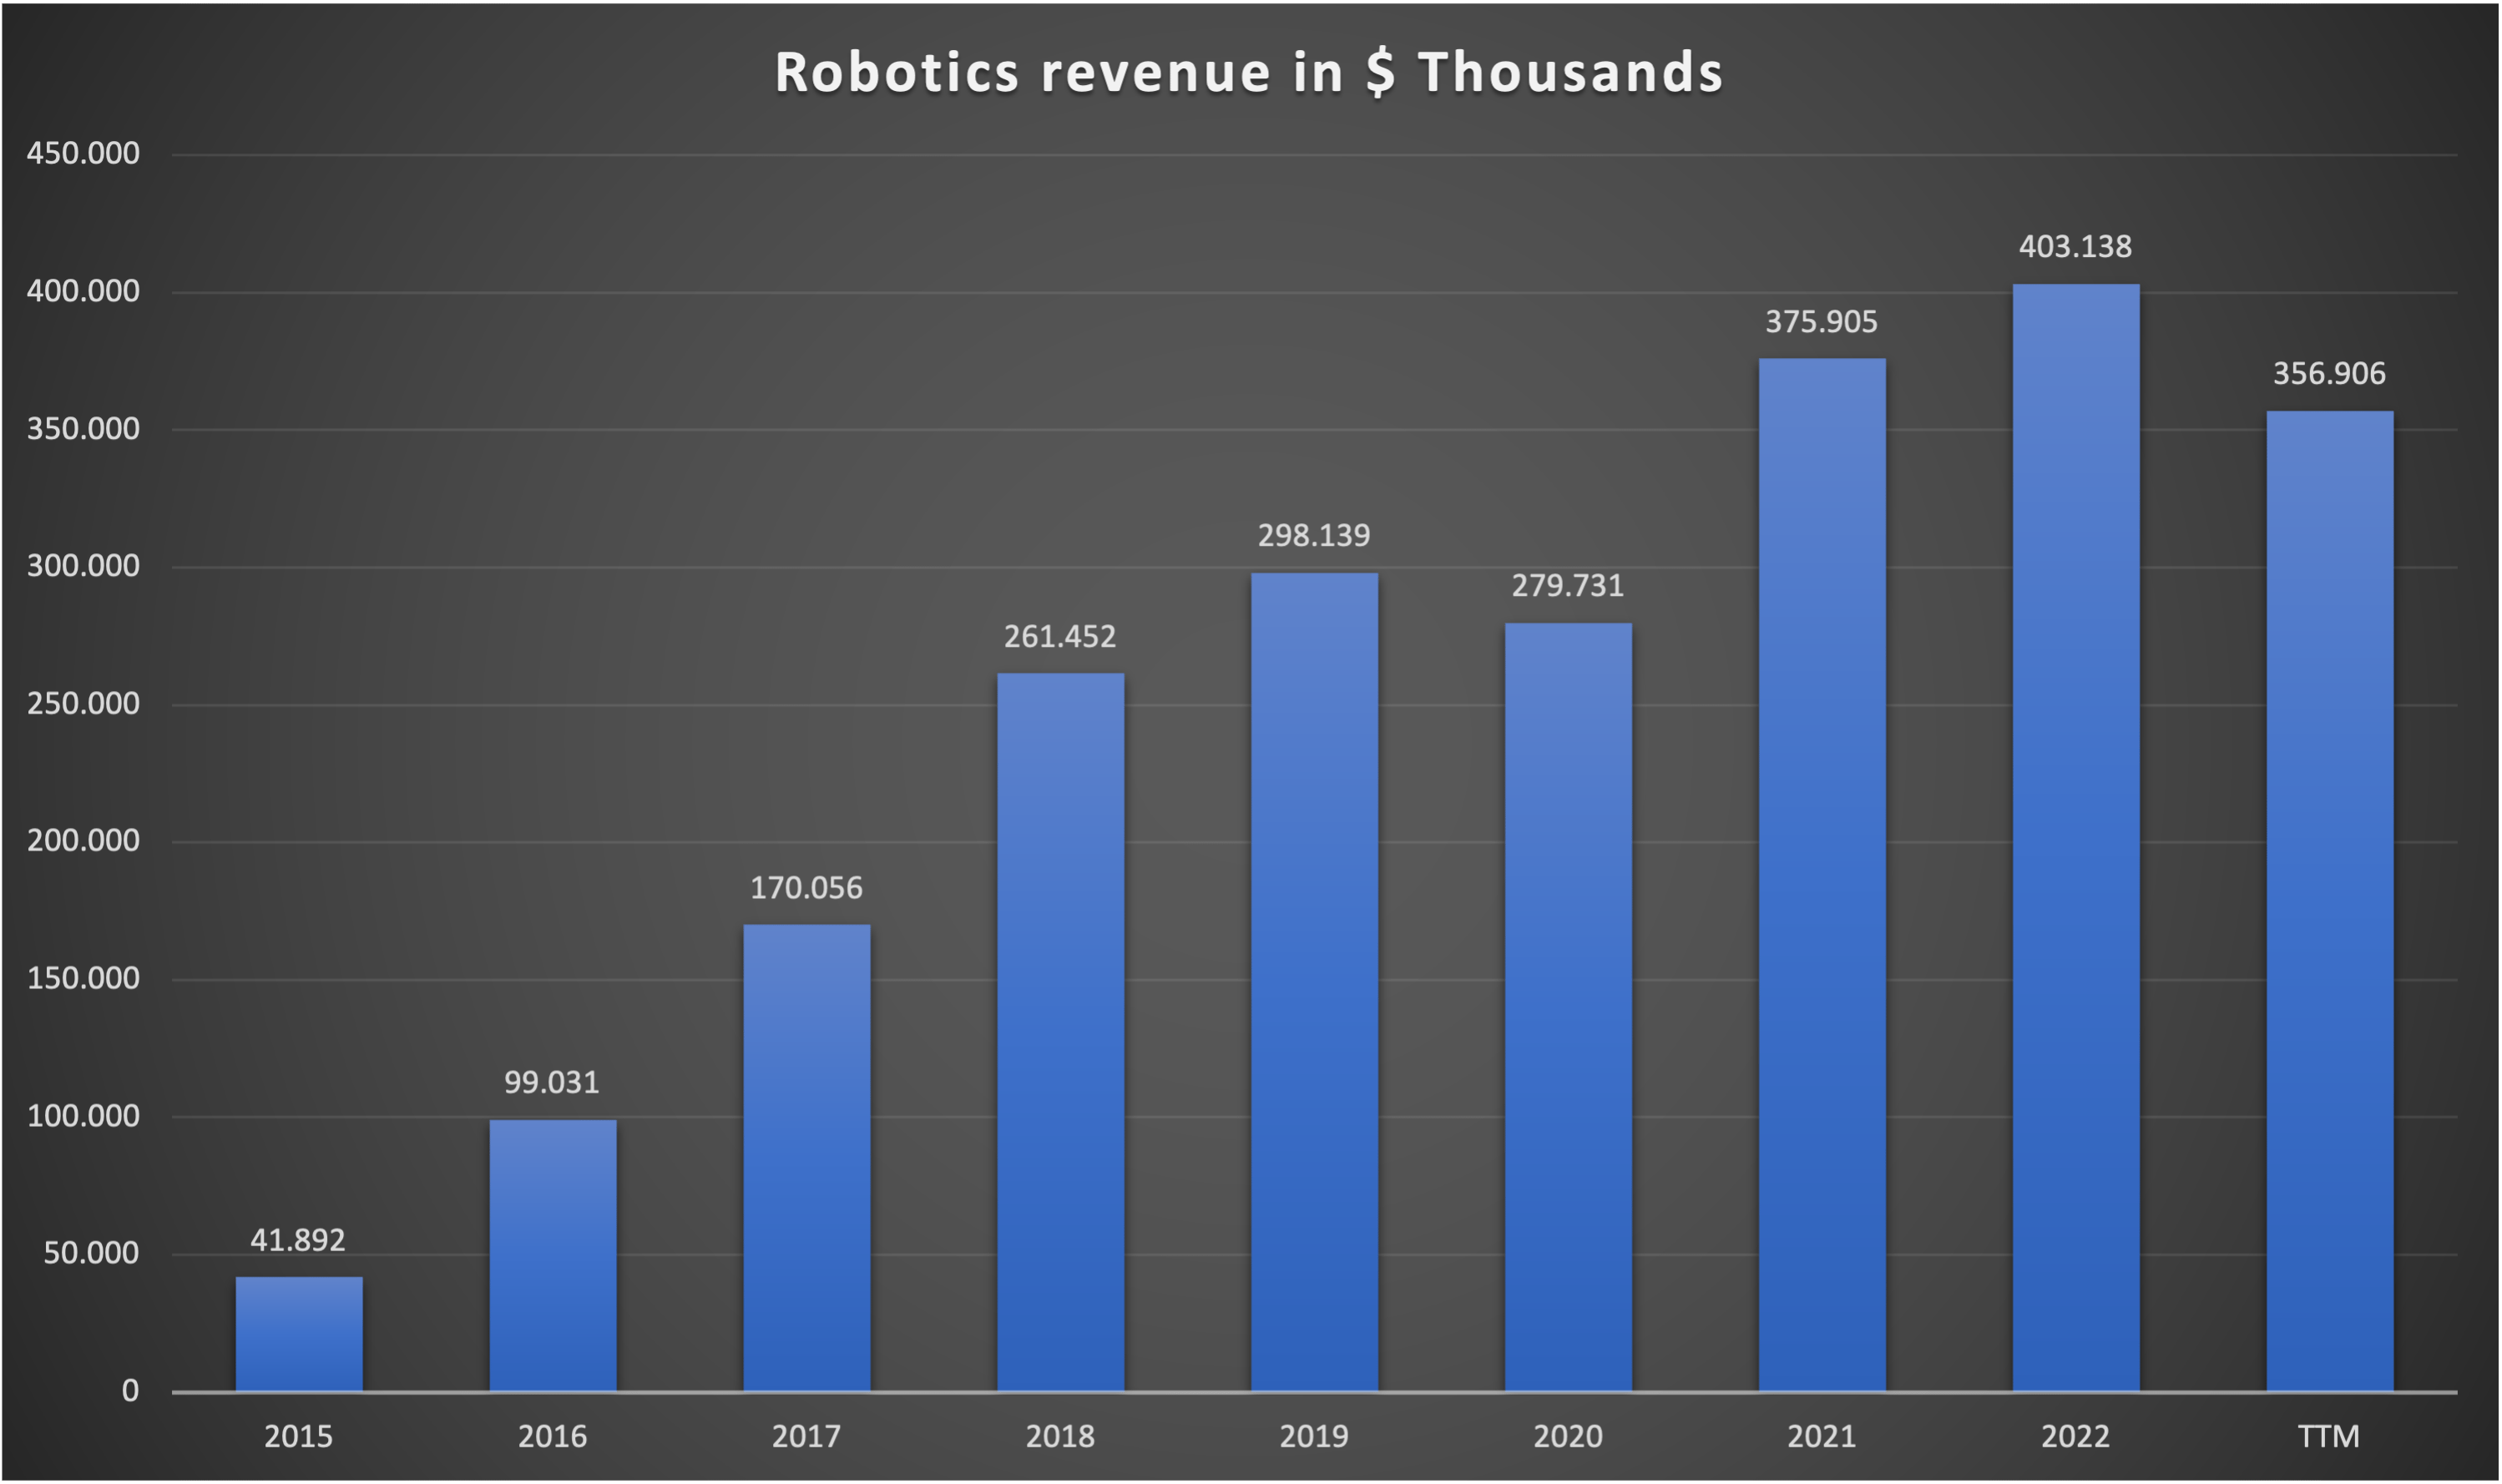
As this segment will be the most important growth driver for the company, I want to spend some time discussing the longer-term outlook. I want to start by looking at the past results:
TER Robotics Revenue since FY15 (Company 10-Ks - Segment Reporting)
Here we can see the segment's revenue since FY15, the year TER first reported segment results for Robotics (it was called Industrial Automation in the past). From FY15 to FY22, revenue grew with a CAGR of 38.2%. If we account for the decline in the TTM, revenue grew with a CAGR of 30.7%, still an impressive number. Robotics currently accounts for around 13% of total revenue.
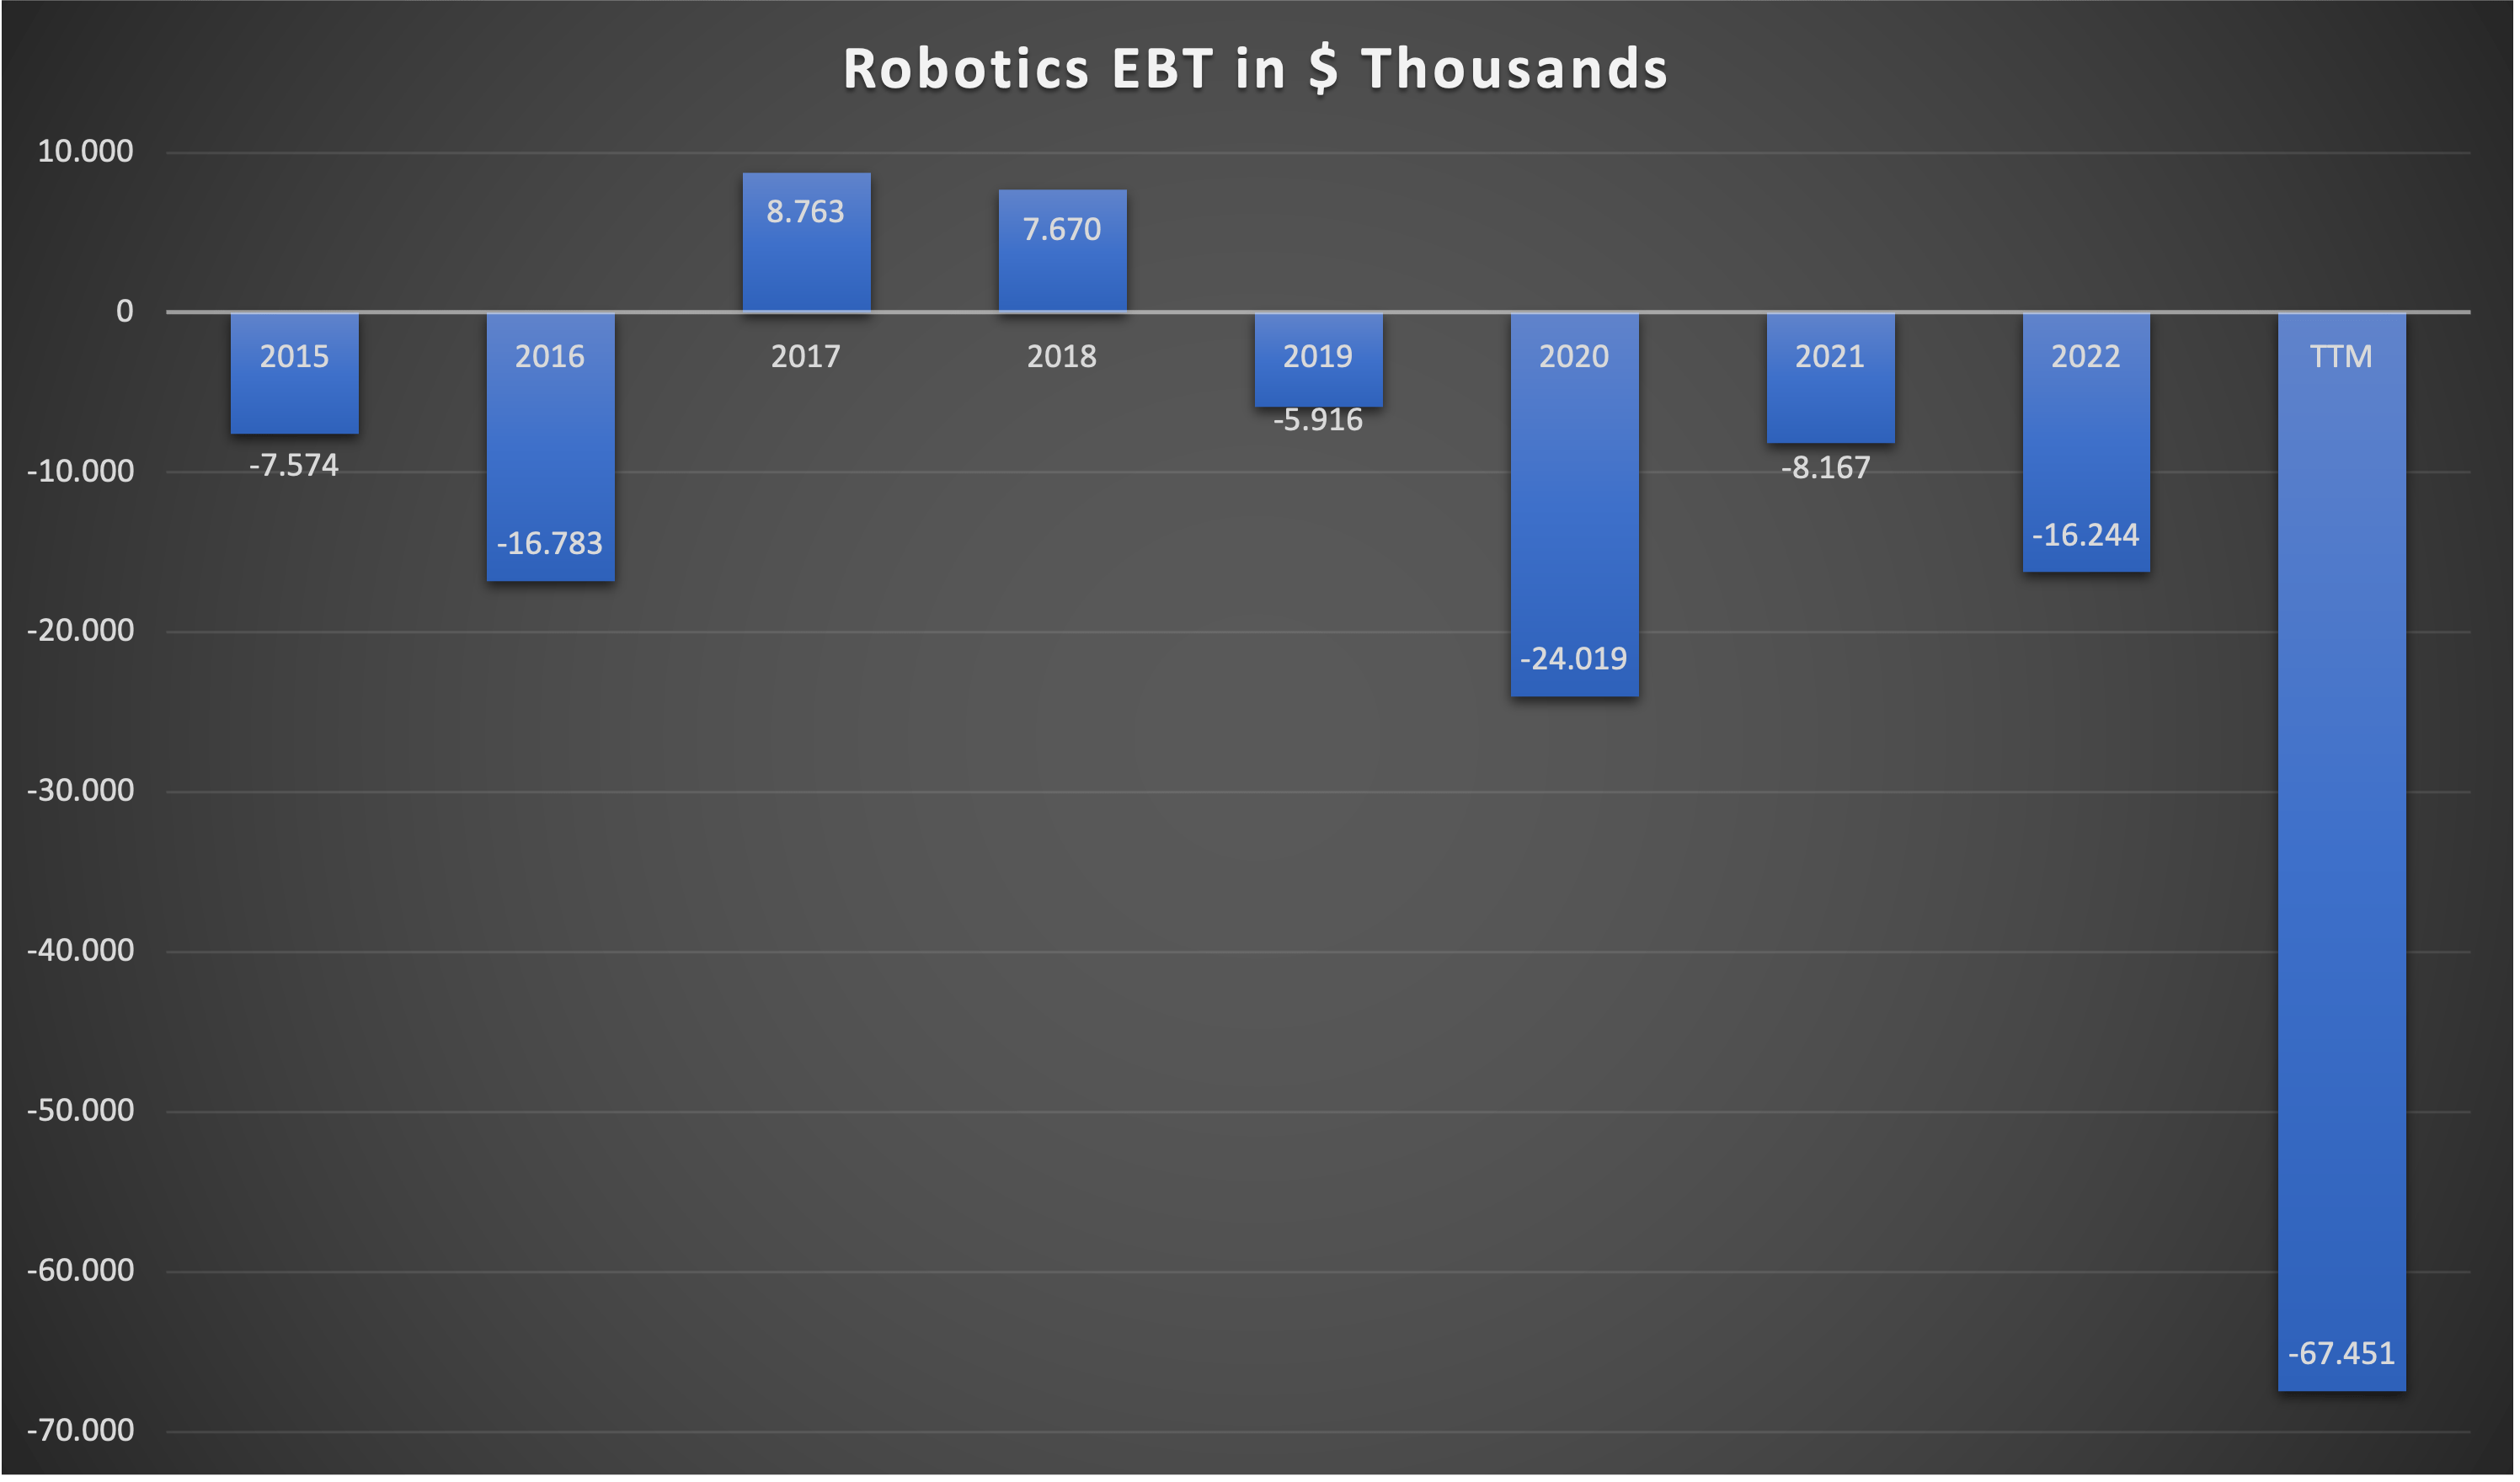
Here is the chart showing the segment's EBT:
TER Robotics EBT since FY15 (Company 10-Ks - Segment Reporting)
Robotics wasn't able to generate meaningful profits in the past. Non-GAAP earnings for this segment are better because most of the company's amortization of intangible assets (around $20 million in FY22) is attributable to the Robotics segment (TER was pretty active doing bolt-on acquisitions here in the past).
Here is another chart showing the development of the EBT margin:
TER Robotics EBT margins since FY15 (Company 10-Ks - Segment Reporting)
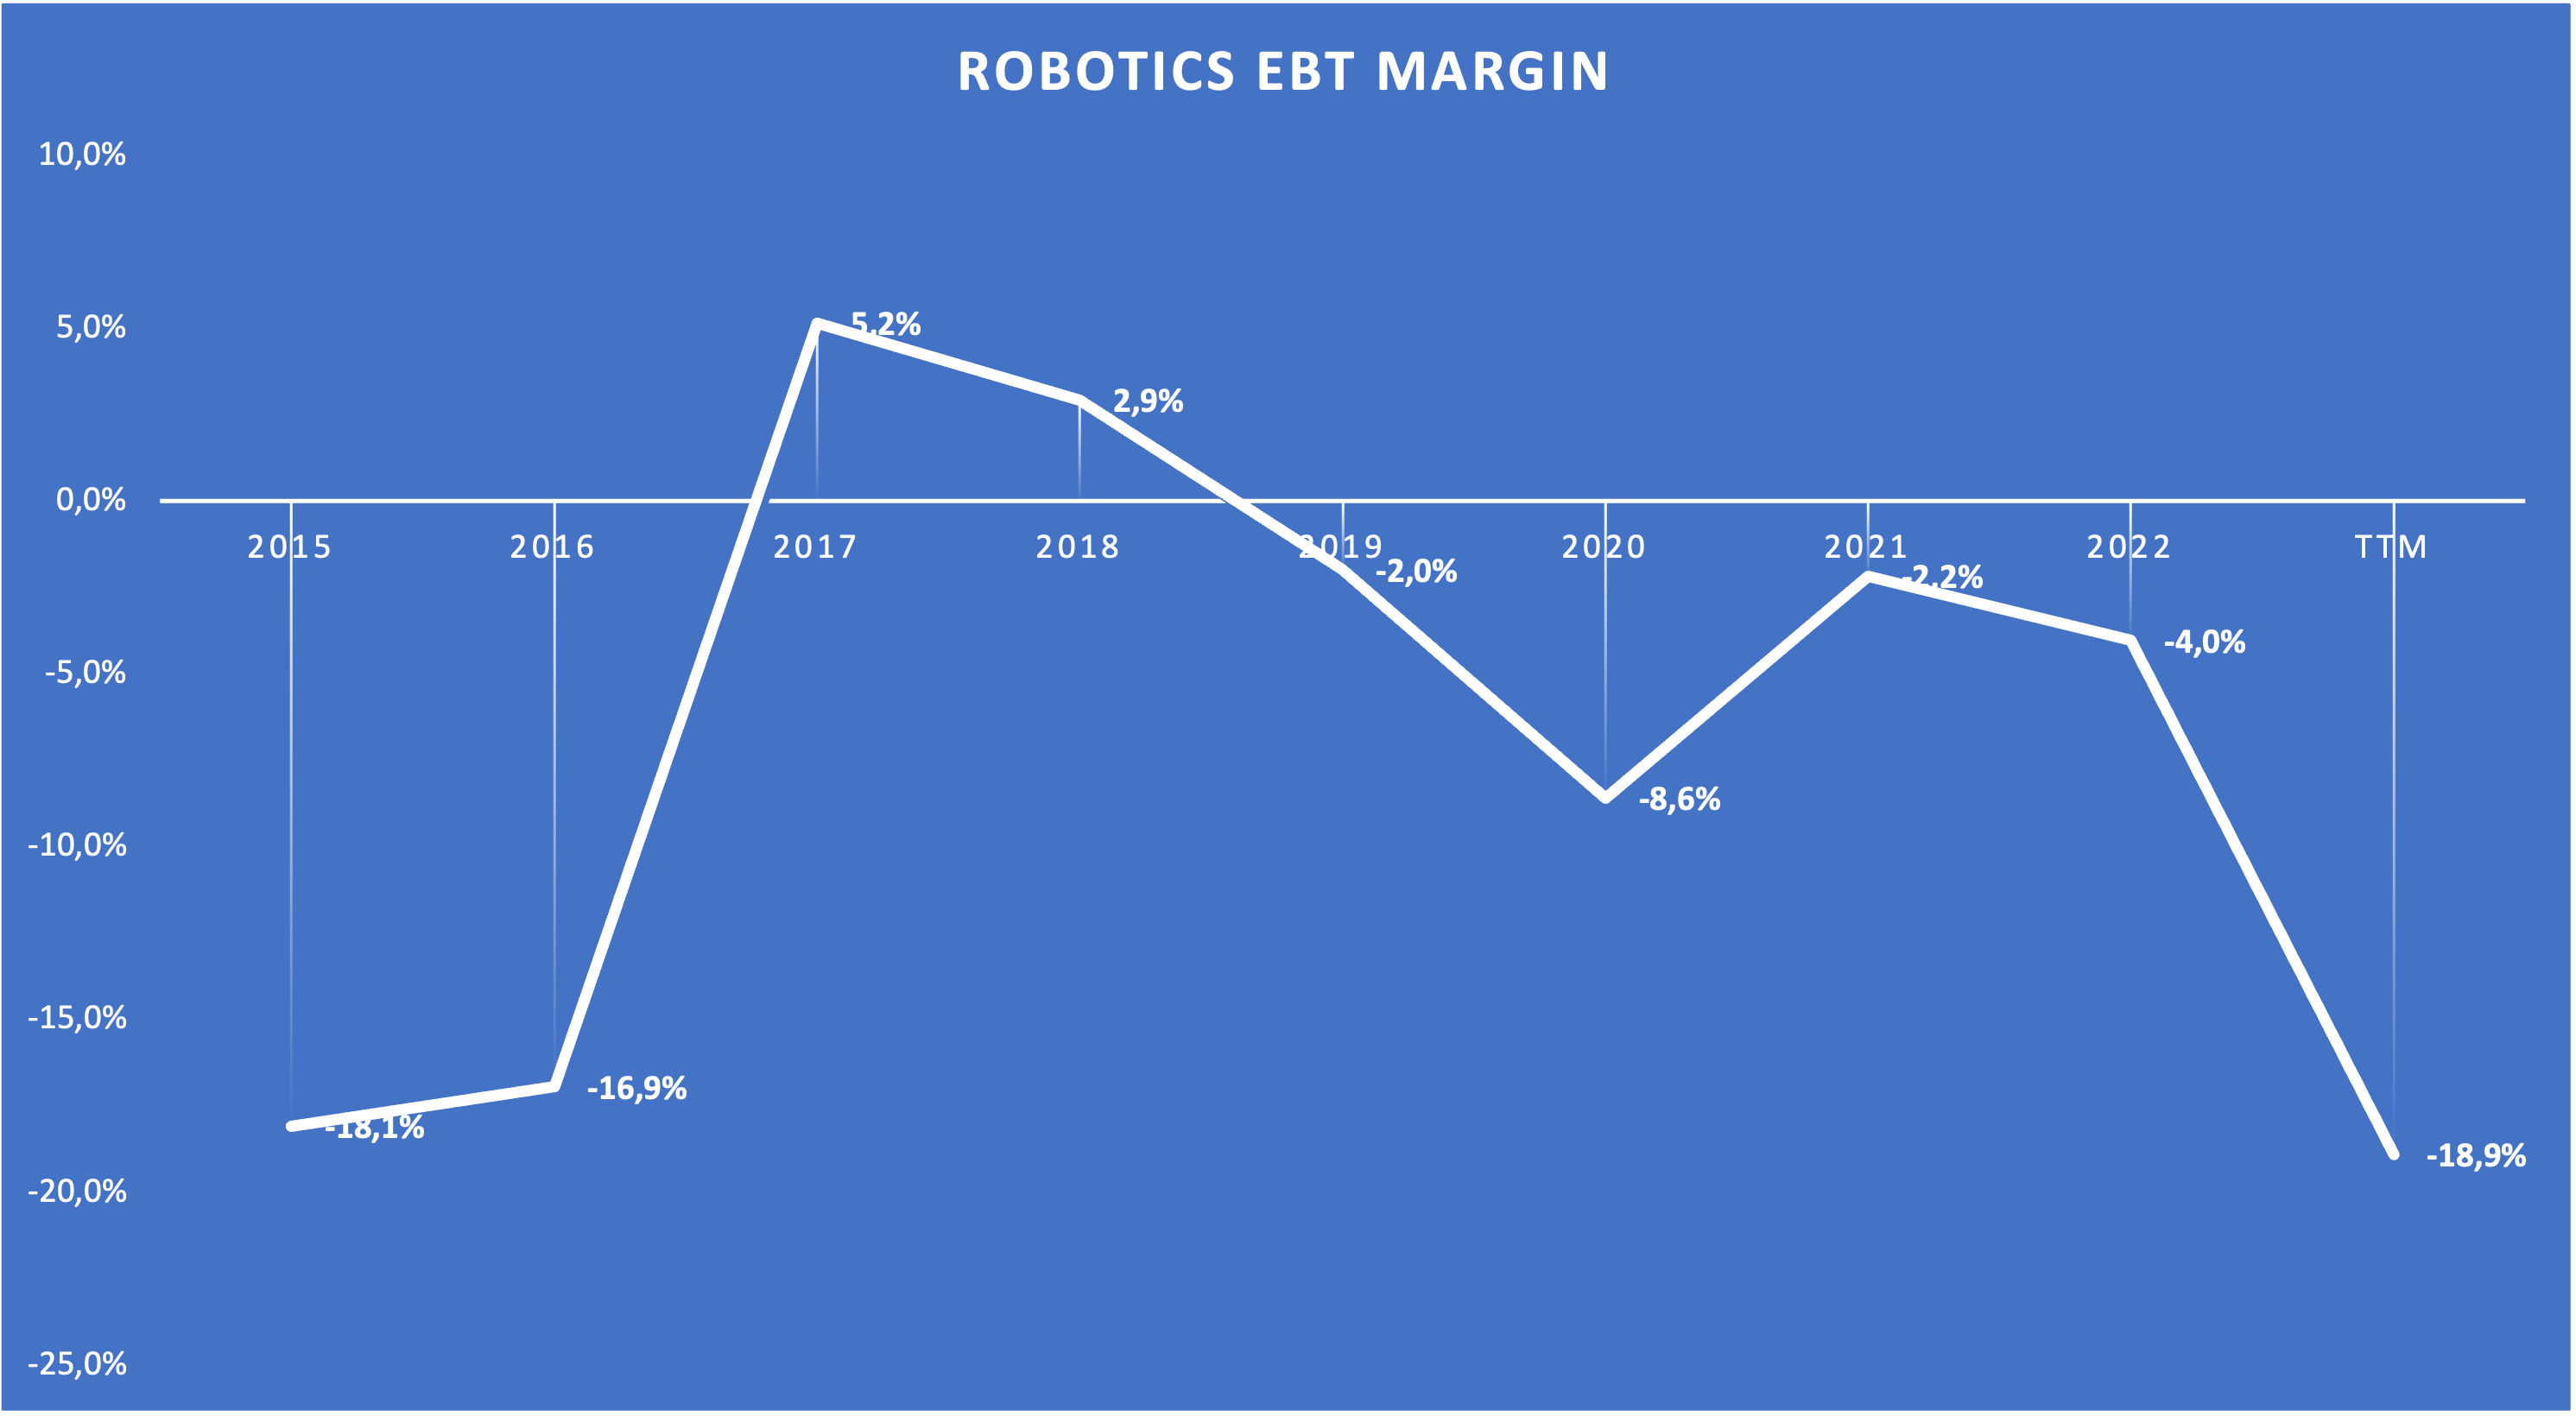
This chart is interesting. We can see that margins drastically improved in FY17. The big declines occur in times of economic stress like the pandemic (FY20) and the present rate rise cycle (FY23). In conclusion, Robotics margins are tied to the state of the overall economy. This makes sense when we think about the main customers: Manufacturers (collaborative robots) and logistic companies like Amazon and MercadoLibre (autonomous mobile robots). When times are good and cash is easily accessible, those companies invest to improve production/reduce costs. They become more restrictive regarding spending when it isn't.
Now let's take a look at the market TER serves with this segment.
Collaborative Robots (Cobots)
There are many research reports regarding this market out there and the numbers seem to be all over the place. I looked at seven research reports and while the numbers are completely different, five of them expect a growth CAGR of 30%+ going forward. Statista expects the smallest growth CAGR of only 11.6% (from 2023-2030) and Mordor Intelligence experts a CAGR of 20.5% (from 2023-2028). I will just weed out the five reports with the highest expected growth rate and the one with the lowest growth rate and focus on the Mordor Intelligence report .
Mordor Intelligence expects the Cobot market to grow from $950 million in 2023 to $2,410 million in 2028. They also give us a list of market leaders:
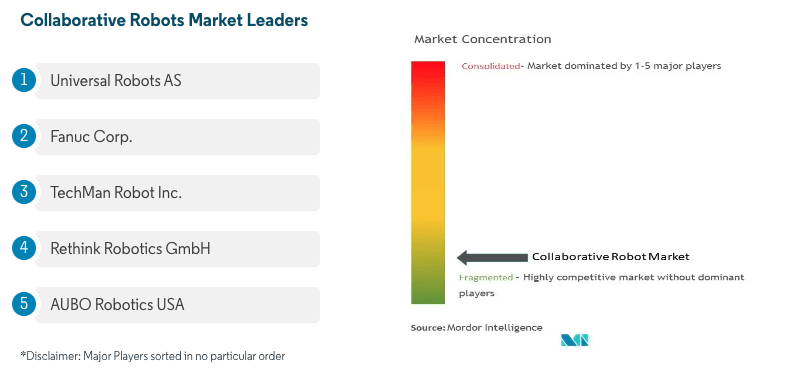
Universal Robots AS is TER's collaborative automation solutions company. Teradyne acquired Universal Robots back in 2015.
Autonomous Mobile Robots
I looked at several research reports again and the numbers for these reports are much closer than for the Cobot reports. I think this may be because some reports distinguish differently between those two kinds of robots. To avoid any mix-ups I will just use the report from Mordor Intelligence again. Mordor Intelligence expects the autonomous mobile robots ((AMR)) market to grow from $3.36 billion in 2023 to $6.94 billion in 2028 (CAGR 15.6%). So the Cobot market is expected to grow faster than the AMR market. Mordor Intelligence presents us with a slide showing the market leaders again:
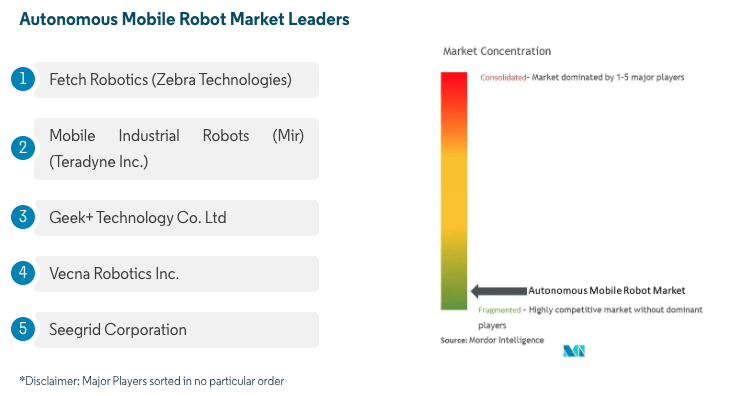
Again, Teradyne's subsidiary "Mobile Industrial Robots" is listed as one of the leaders in a fragmented market.
Robotics: Bringing it together
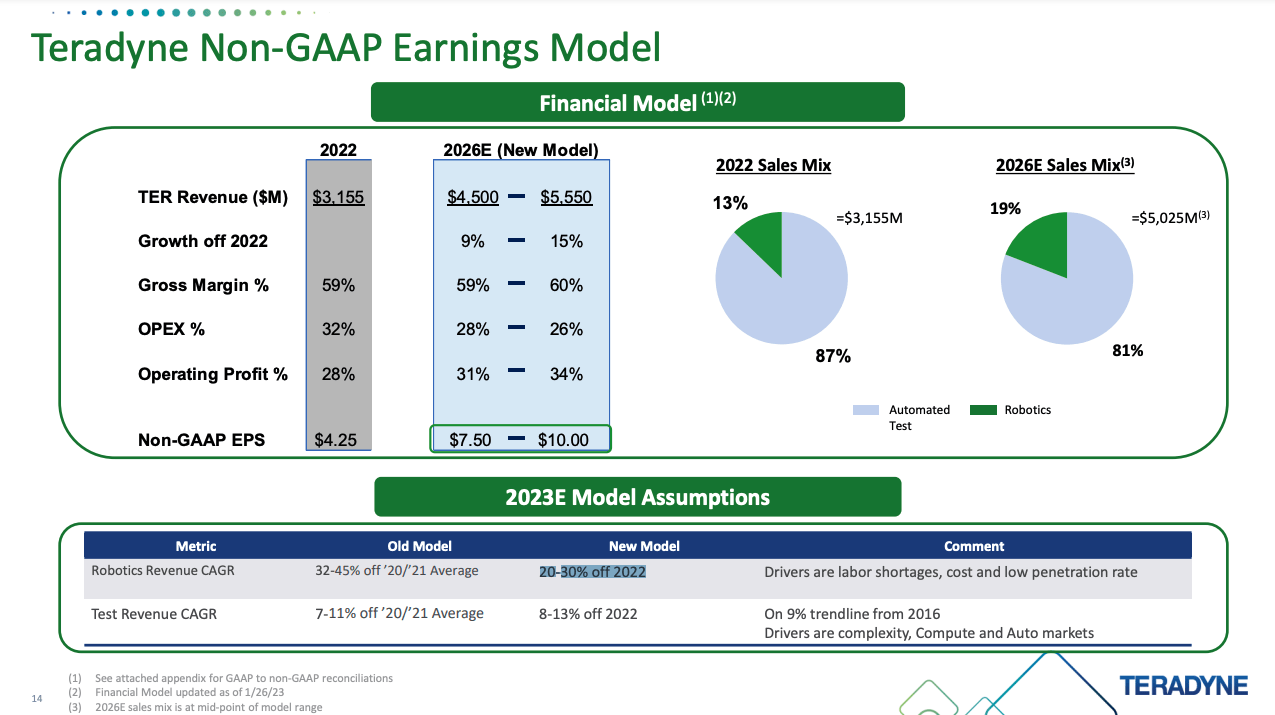
Teradyne's subsidiaries are listed as leaders in the Cobot and the AMR market. If we combine Mordor Intelligence's size estimate of both markets, the total size of TER's served markets (for 2023) in the robotic space amounts to $4.31 billion. With TTM revenue from the robotics segment of $357 million, this would put TER's overall market share at around 8.3% which is decent for such a growth market. The combined market size CAGR according to Mordor Intelligence should come in at around 17% until 2028. How does TER see this segment's future growth prospects? Here is a slide from TER's earnings presentation showing what they call their "2026E Financial Model":
Teradyne Non-GAAP 2026E Model (Q3 23 Earnings Presentation - Slide 14)
I will refer back to this slide later but for now, let's just look at the important points for the robotics segment. TER expects growth rates of 20-30% off 2022 revenue numbers. Keep in mind that FY22 revenue was the highest the robotics segment ever reported and will be higher than FY23 robotics revenue. In conclusion, assuming the aforementioned market size estimates from Mordor Intelligence are correct, TER seems to calculate some market share gains. This wouldn't surprise me since they are one of the bigger players in this market and winners usually keep winning while expanding market share. Future consolidation in this market might be a tailwind for TER. On the other hand, growing markets also attract competition. In conclusion, I wouldn't bet that TER will be able to expand its market share.
The other big question is: Will the robotics segment be able to generate meaningful profits in the future? The low margins of the past already indicate that this is and will be a low-margin business. I wouldn't expect TER to achieve high margins here. However, since robotics generated losses over the past few years, even a slight positive margin would improve the margins on a consolidated level. If we take another look at the FY2026E Financial Model, we can see that TER is guiding for an improvement of the EBIT margin from 28% in 2022 to 31-34% in 2026. Part of this should come from the semiconductor and system test segments, but TER seems to expect improving margins for the robotics segment in the upcoming years as well.
Financials
As I usually do, I will start this section with a quick look at the most recent reported balance sheet:
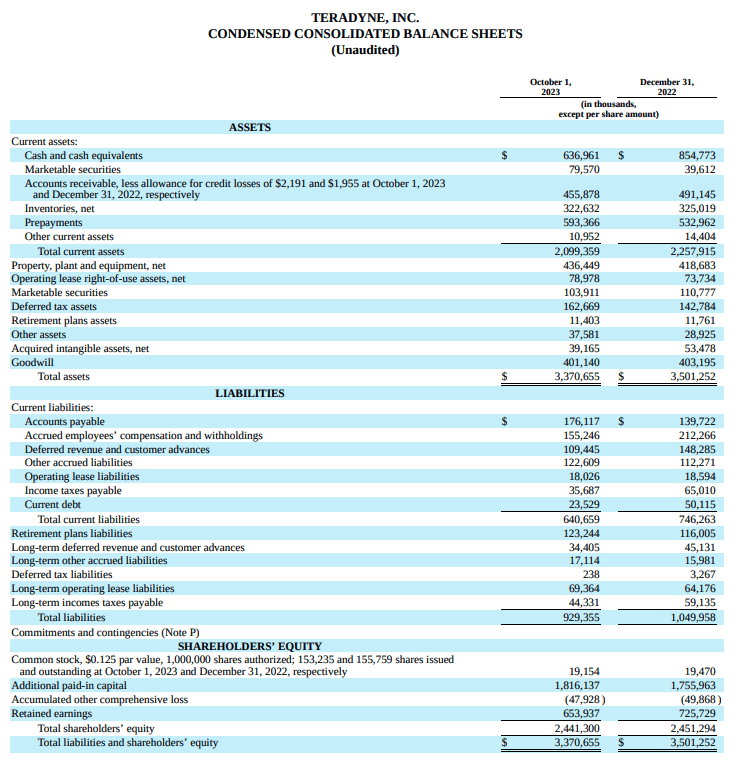
Cash and equivalents plus Marketable securities amount to $716.5 million. TER has a $23.5 million current debt and no long-term debt. I won't count operating lease liabilities as debt, so TER currently has a net cash position of around $693 million. S&P Capital IQ quantifies the net cash position at $709.5 million, slightly higher than my calculation. In conclusion, TER's balance sheet looks very strong. With a market capitalization of around $15 billion, the net cash position accounts for nearly 5% of total market capitalization. I also highlighted this in my initial article from February. TER and Advantest have a history of running very healthy, debt-free balance sheets. I view this as a forward-looking management practice because both companies' management teams seem to be aware of the cyclicality of the business.
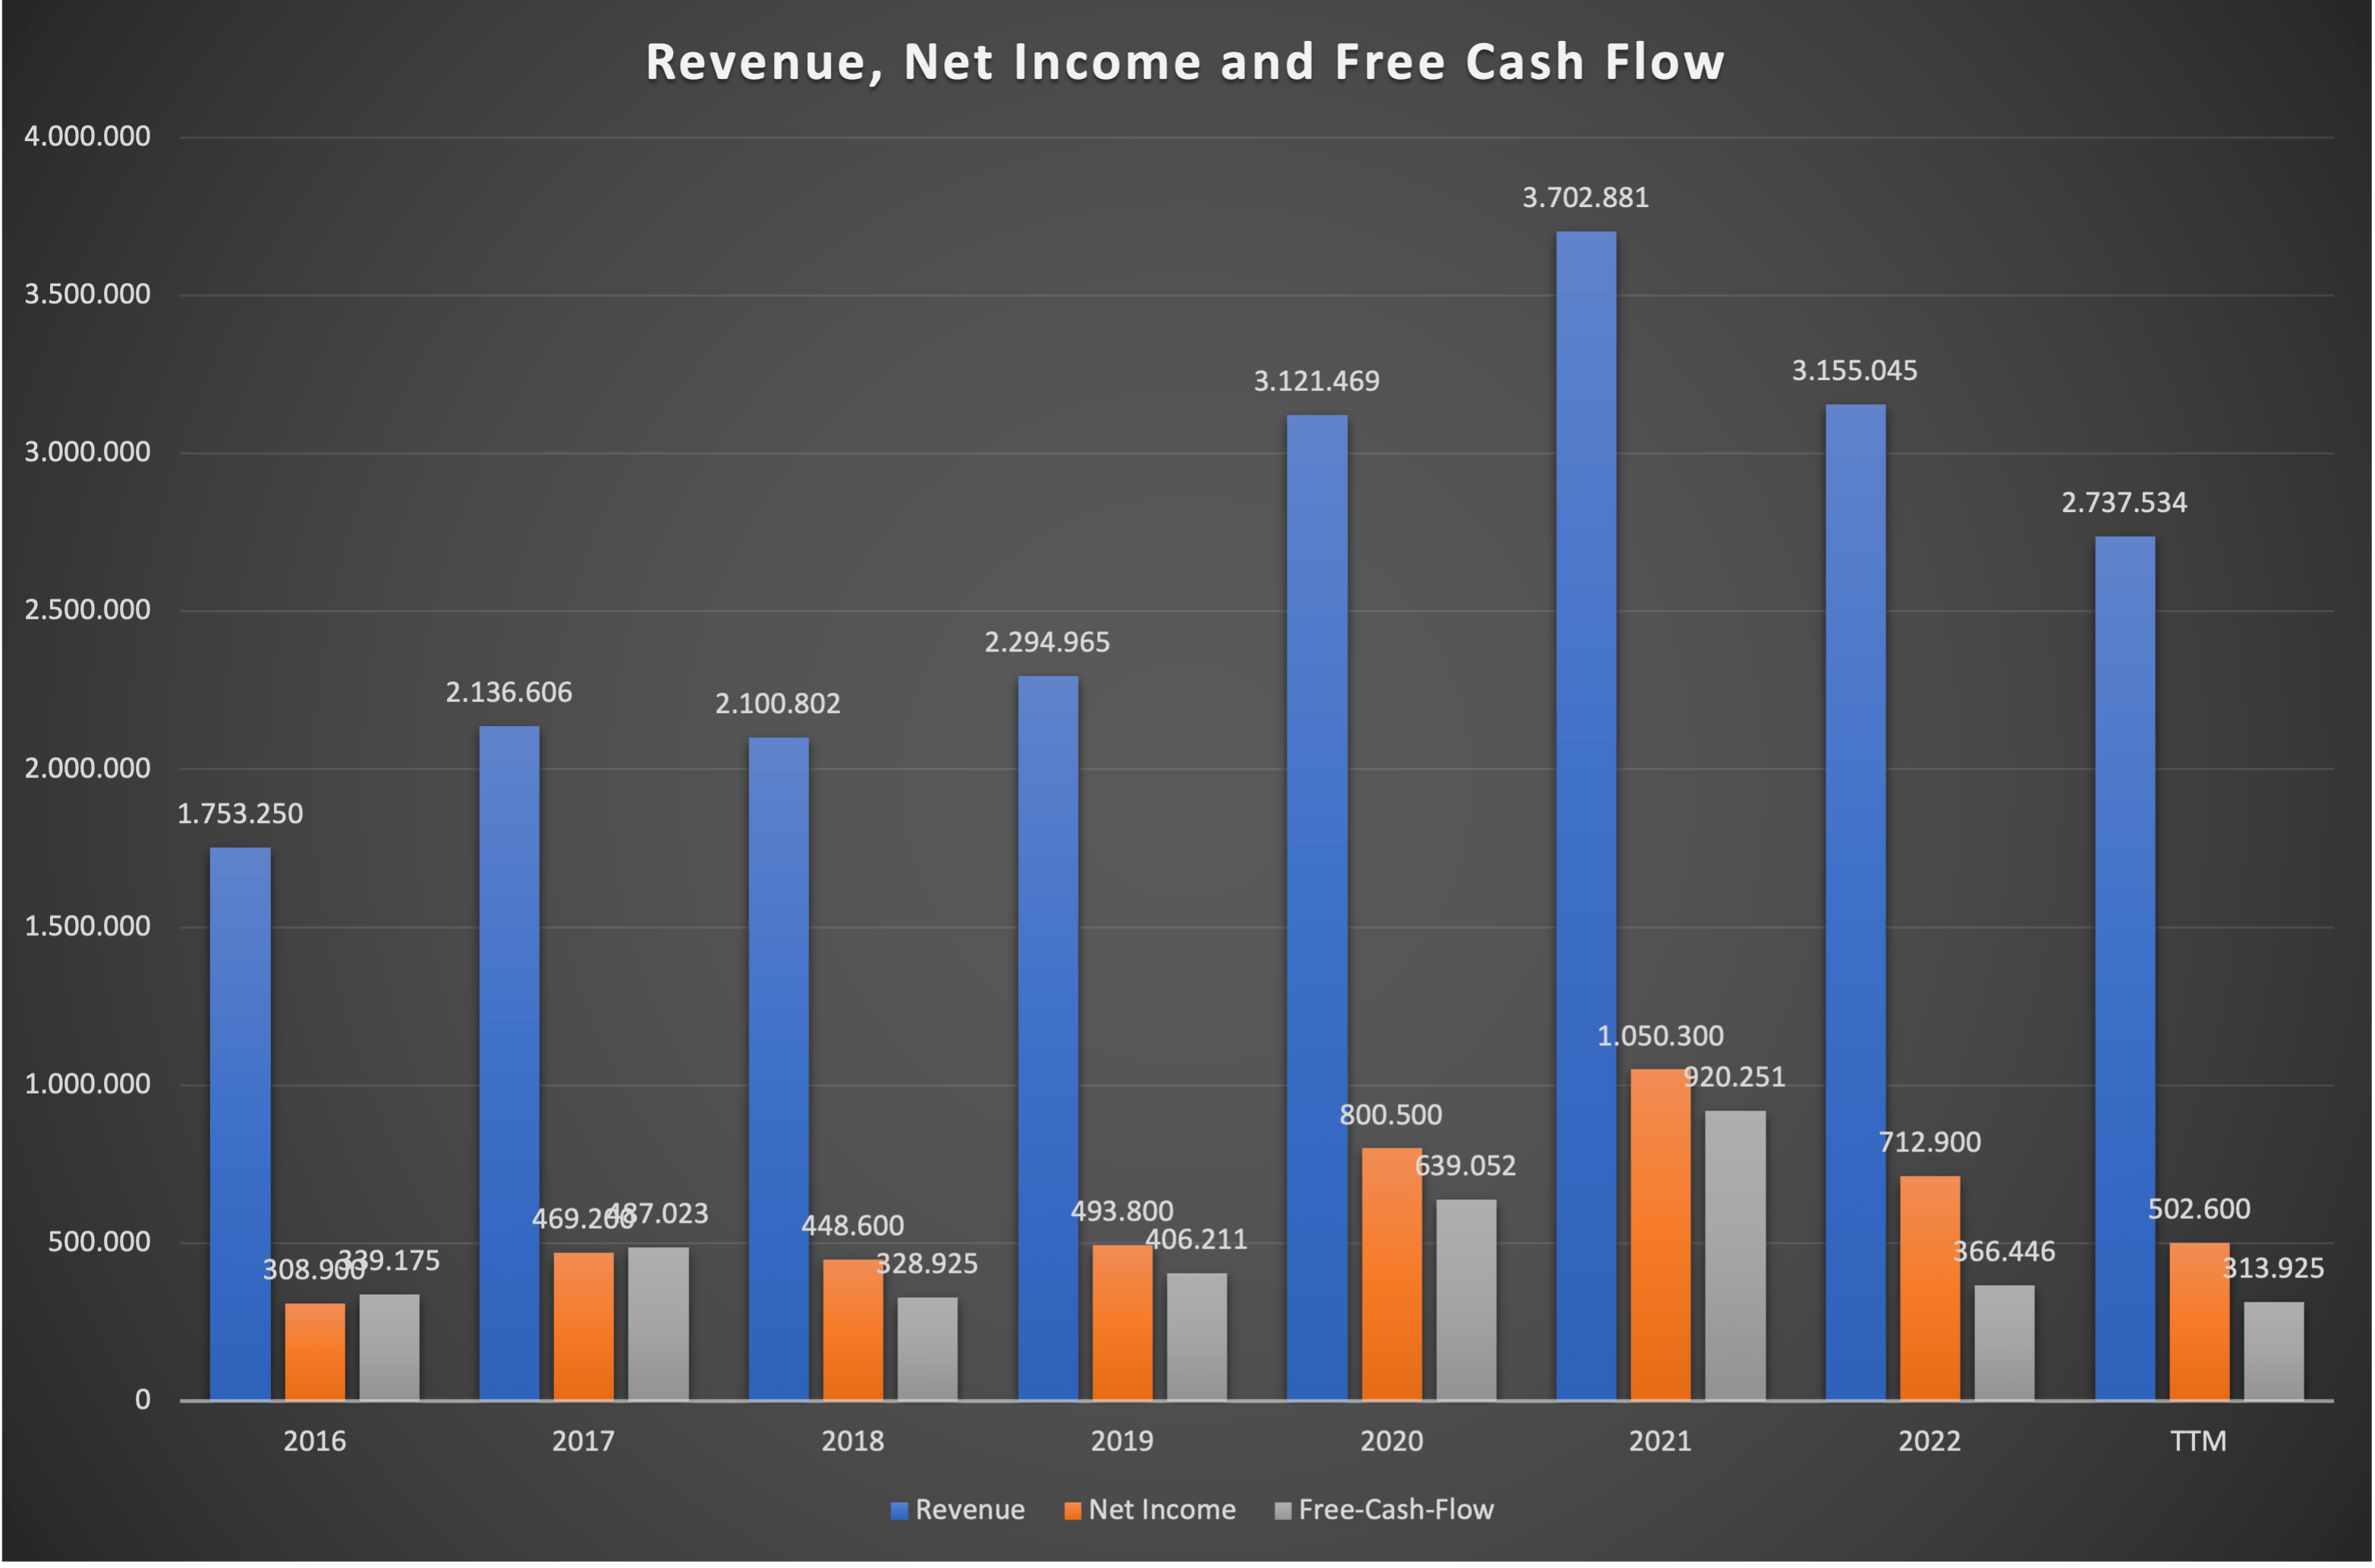
Now let's take a look at the longer-term earnings metrics. I will limit this to revenue, net income, and free cash flow (in $ Thousands):
TER Earnings Metrics since FY16 (Company reports - compiled by Author)
Please note that the net income numbers are Non-GAAP. TER adjusts GAAP numbers for amortization of intangible assets and some restructuring charges (they are negligible so I will just ignore them and go with Non-GAAP numbers).
We can see the same thing we have seen earlier. TER has been on a steady growth path until revenue and earnings exploded in FY20 and FY21. What we are seeing right now is a return to the trendline we have seen in the past. TER is currently getting hit from two angles: (1) The semiconductor test market is declining after the boom during the pandemic. As I have shown earlier and in my recent Advantest update, I think that we will see a gradual recovery in CY24 and going forward. (2) Monetary tightening hit the Robotics segment because manufacturers/OEMs and logistic companies are keeping their cash together. The overall long-term outlook for the Robotics market is unchanged.
I think it is very likely that we will see record earnings numbers in FY25, with FY24 being a recovery year where we will see a rebound from the bad FY23 results. I tend to look at the underlying market trends and not at the present results. This is especially important when looking at a company that serves such volatile/economy-sensitive markets as TER does.
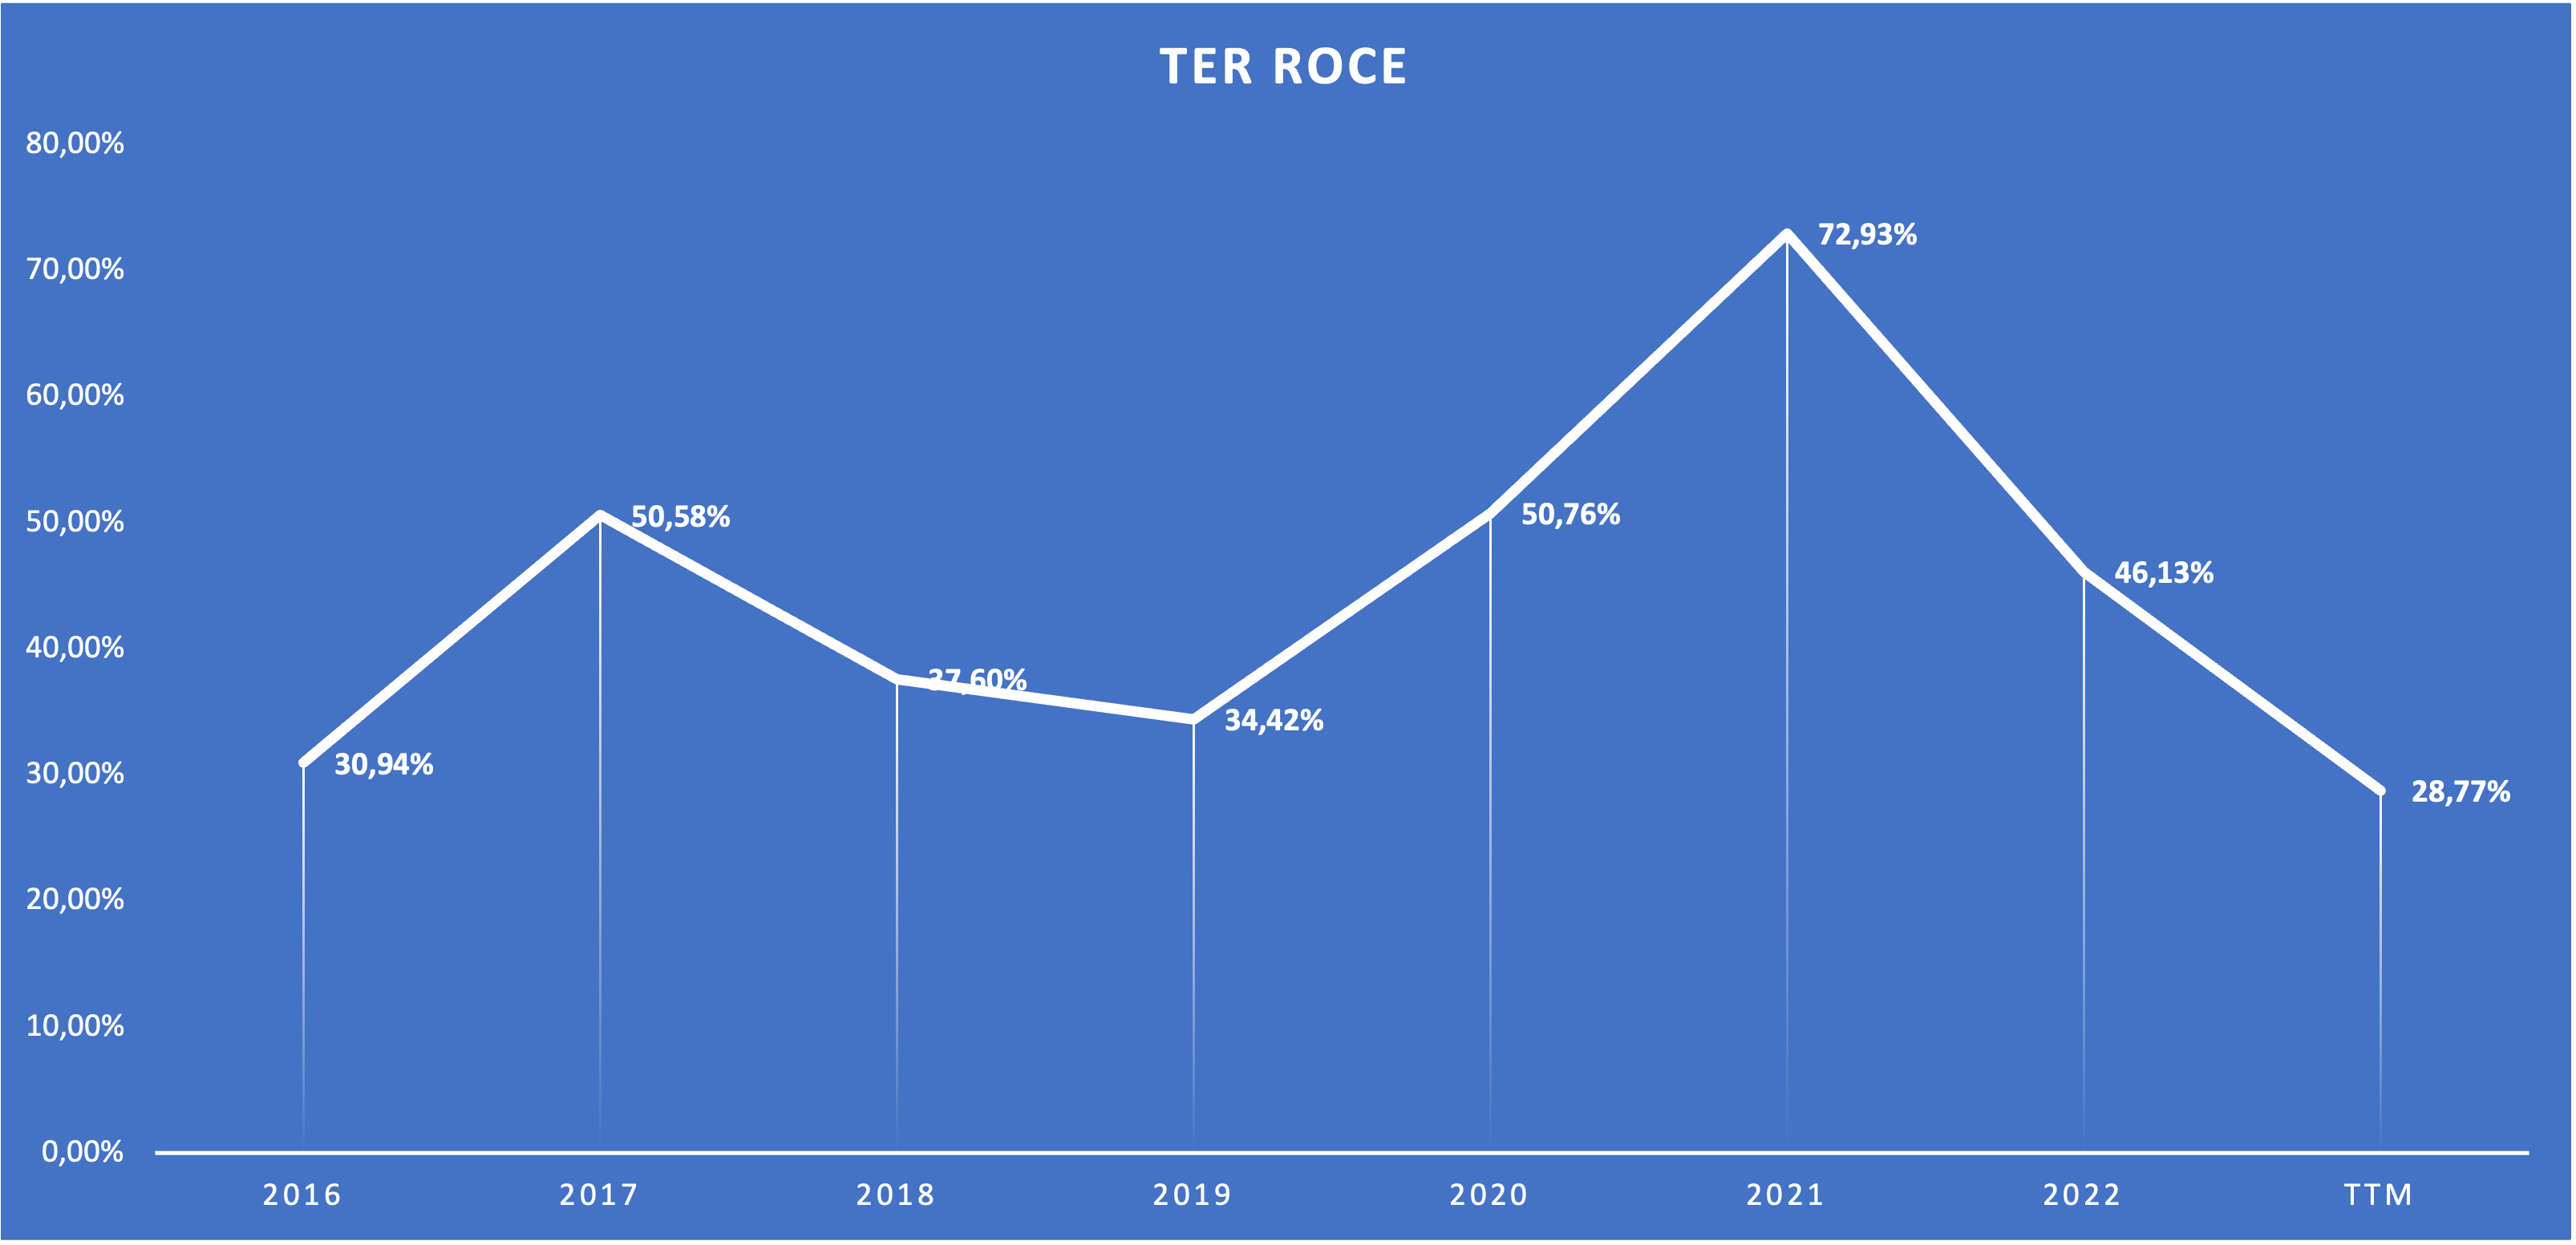
Now I want to talk about something that I call "Value creation". I laid out my thoughts on this in my recent article on Enbridge. Value creation takes place when a company can consistently generate returns on capital above the cost of capital. If it generates returns on capital below the cost of capital, it is destroying value as you hold it. Here is a chart showing TER's return on capital employed (ROCE) since FY16:
TER ROCE since 2016 (Company reports - calculated by Author)
As a quick reminder: I calculate ROCE as Operating Profit (EBIT) divided by (Shareholders' Equity + Long-term Liabilities - net cash if there is any).
With TER generating returns on capital of around 30% in its worst years, it is safe to say that this company generates returns far above its cost of capital. This means that TER consistently creates value while you hold it. A high ROCE is also usually a sign of a wide moat. In the case of TER, we know that the company has a wide moat because it acts in a duopoly in its main operating segment, the semiconductor test equipment business.
A company that consistently creates value while you hold it should perform very well, and TER does as we can see here:
Over the past decade, TER generated close to 500% total returns, far outpacing the S&P 500.
To end this chapter, I want to turn to dividends and share buybacks. With an annualized dividend of only $0.44, TER's dividend yield is a meager 0.50% right now. The dividend policy seems a bit weird. In the past few years, TER kept the dividend steady for two years and raised it in the third year. FY18/19 dividends amounted to $0.36 per year, FY20/21 to $0.40 and FY22/23 to $0.44. Nothing to get excited about.
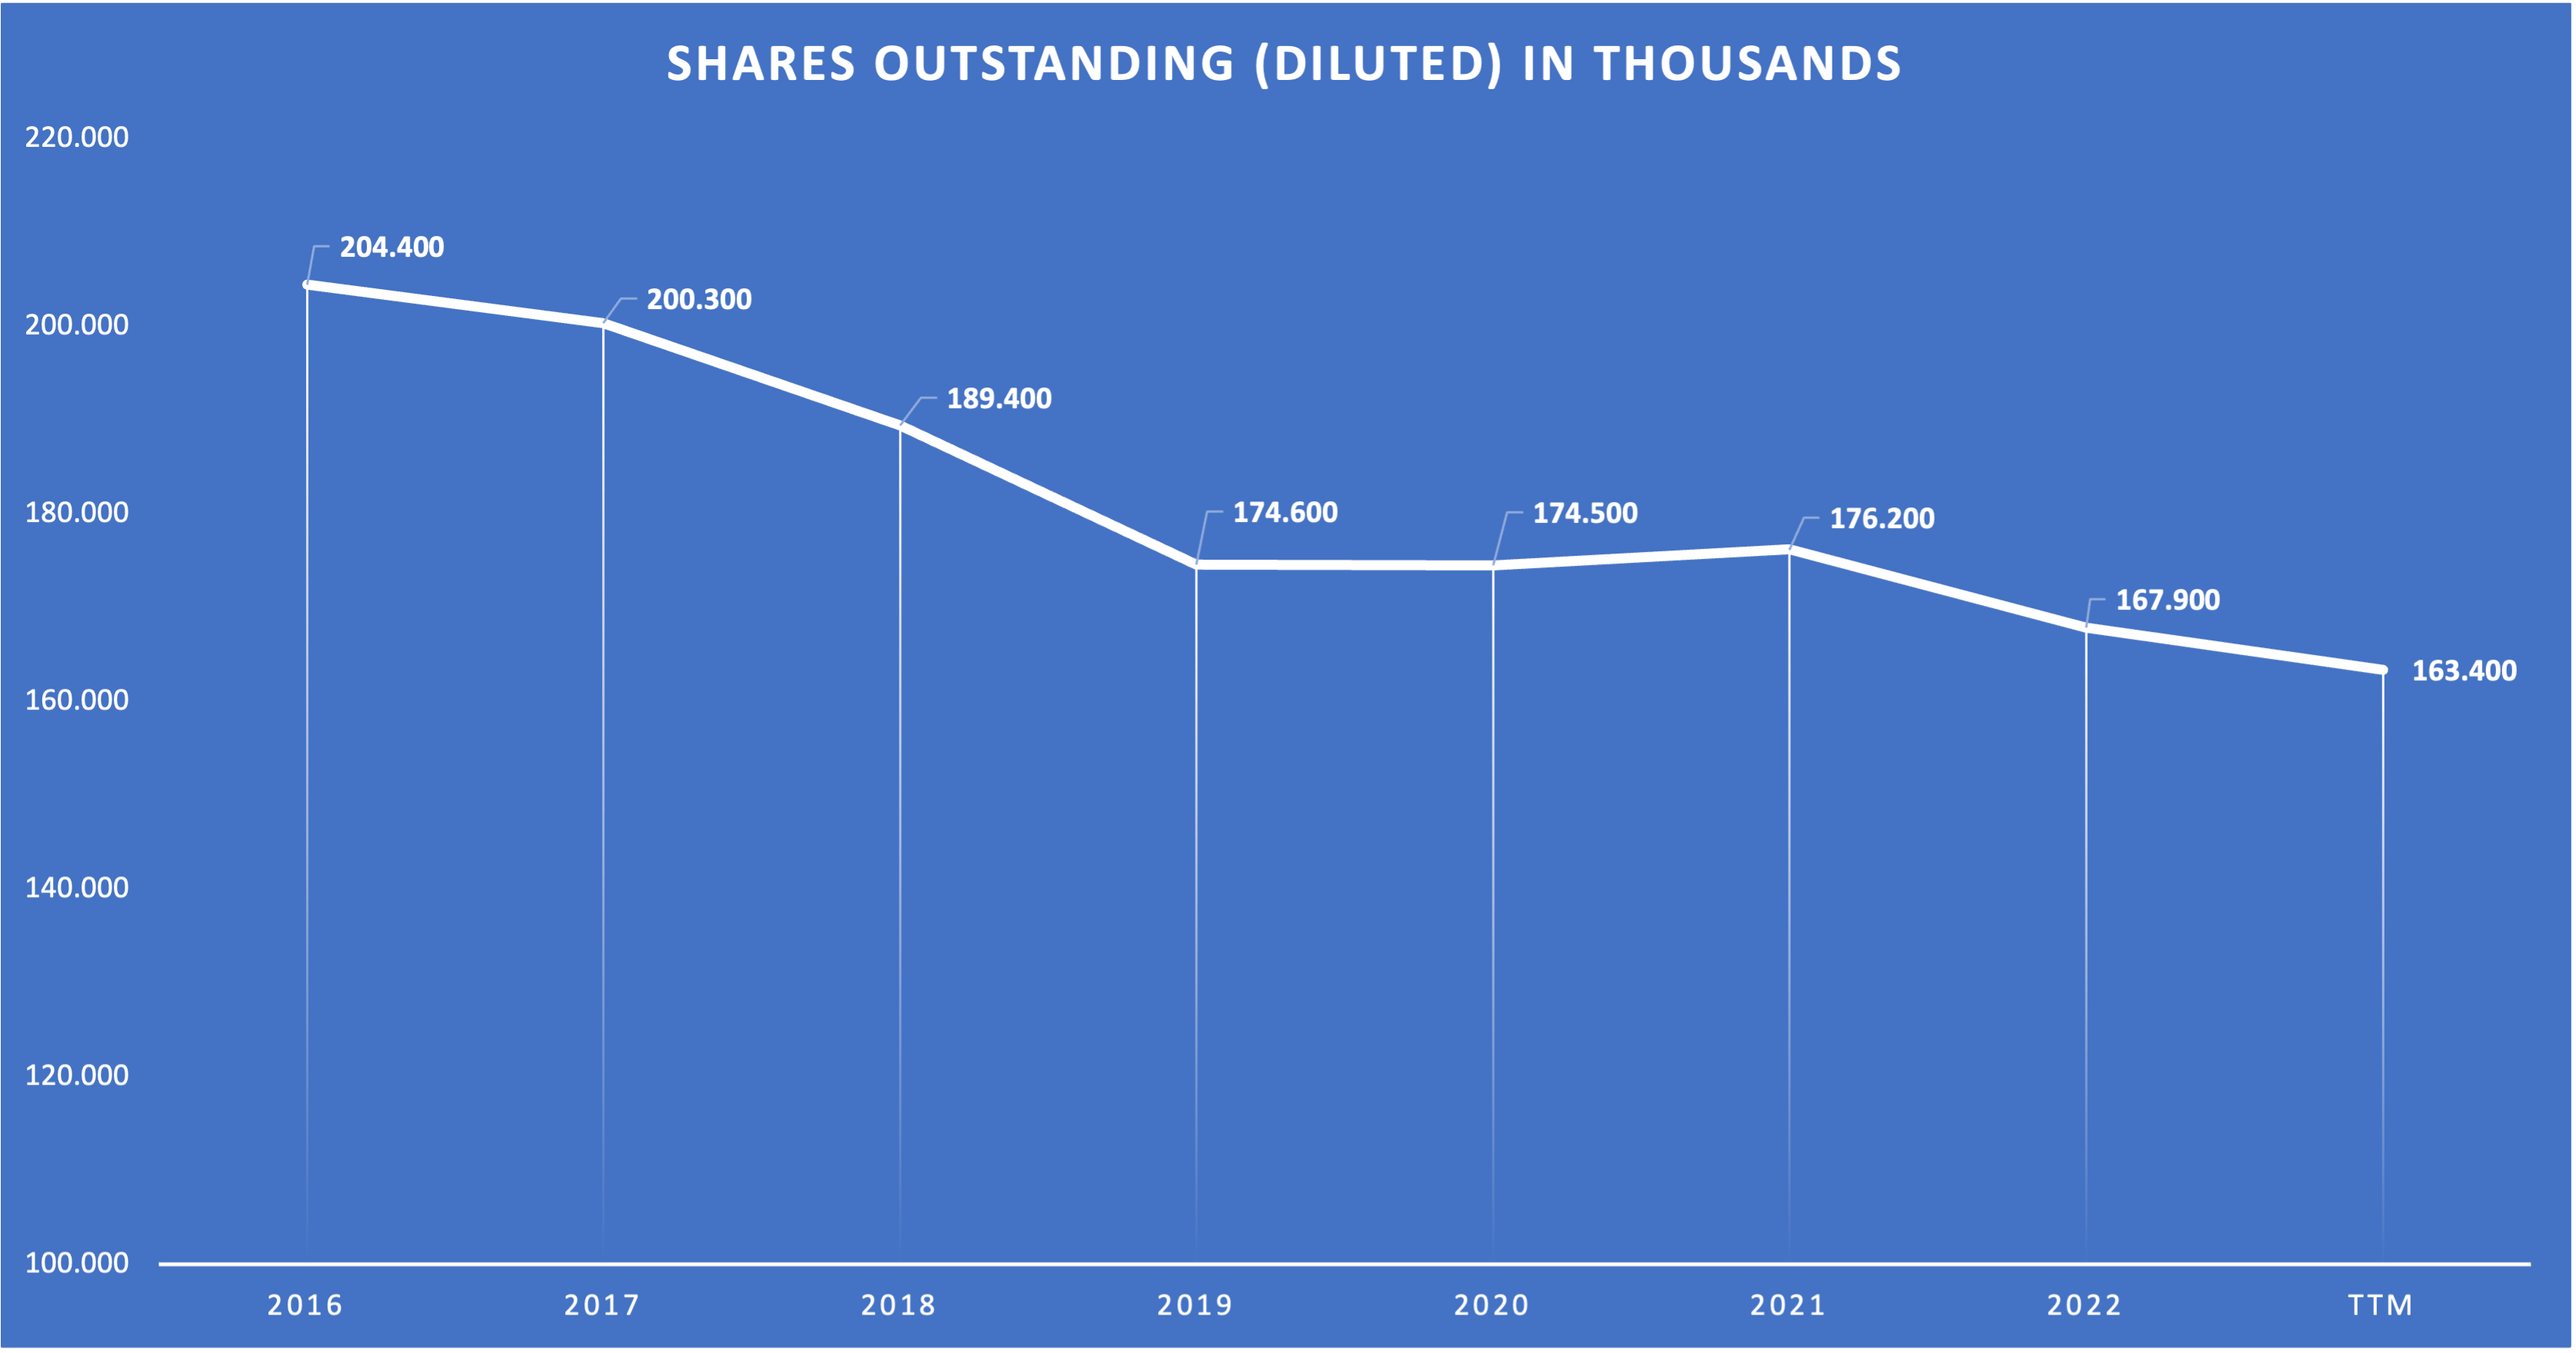
Instead, TER chooses to return capital to shareholders by performing share buybacks. Here is a chart showing the development of TER's diluted shares outstanding since FY16:
TER Shares Outstanding since FY16 (Company reports - compiled by Author)
Since FY16, the diluted share count declined by 20%. As a result, an FY16 shareholder now holds 25% more equity interest in the company than he did in 2016. What I like the most about this is that TER managed to achieve this while keeping the balance sheet debt-free. This shows that the company can return generous amounts of FCF to shareholders without compromising future growth.
Valuation
Valuing a company like TER that is serving volatile markets can be a difficult task. In my recent article on Advantest, I opted for an approach where I tried to forecast FY24 earnings as best as I could. After that, I did my return calculations and a supplemental DCF calculation from these assumed FY24 numbers.
In this article, I will use a different approach. I will try to calculate a "normalized" FY24 that focuses on the underlying market growth instead of the current market environment. I want to start by referring you back to the slide with the FY2026E Financial Model. I will just post it again here:
Teradyne Non-GAAP 2026E Model (Q3 23 Earnings Presentation - Slide 14)
Teradyne assumes test revenue CAGR of 8-13% off 2022 and on a 9% trendline from 2016. I want to focus on the 9% number. Let's assume test revenue means Semi Test + Wireless Test + System Test. Here is a chart showing the actual test revenue compared to "normalized" test revenue, assuming a strict 9% growth trendline since 2016:
Actual vs. Normalized Test Revenue since FY16 (Author estimates)
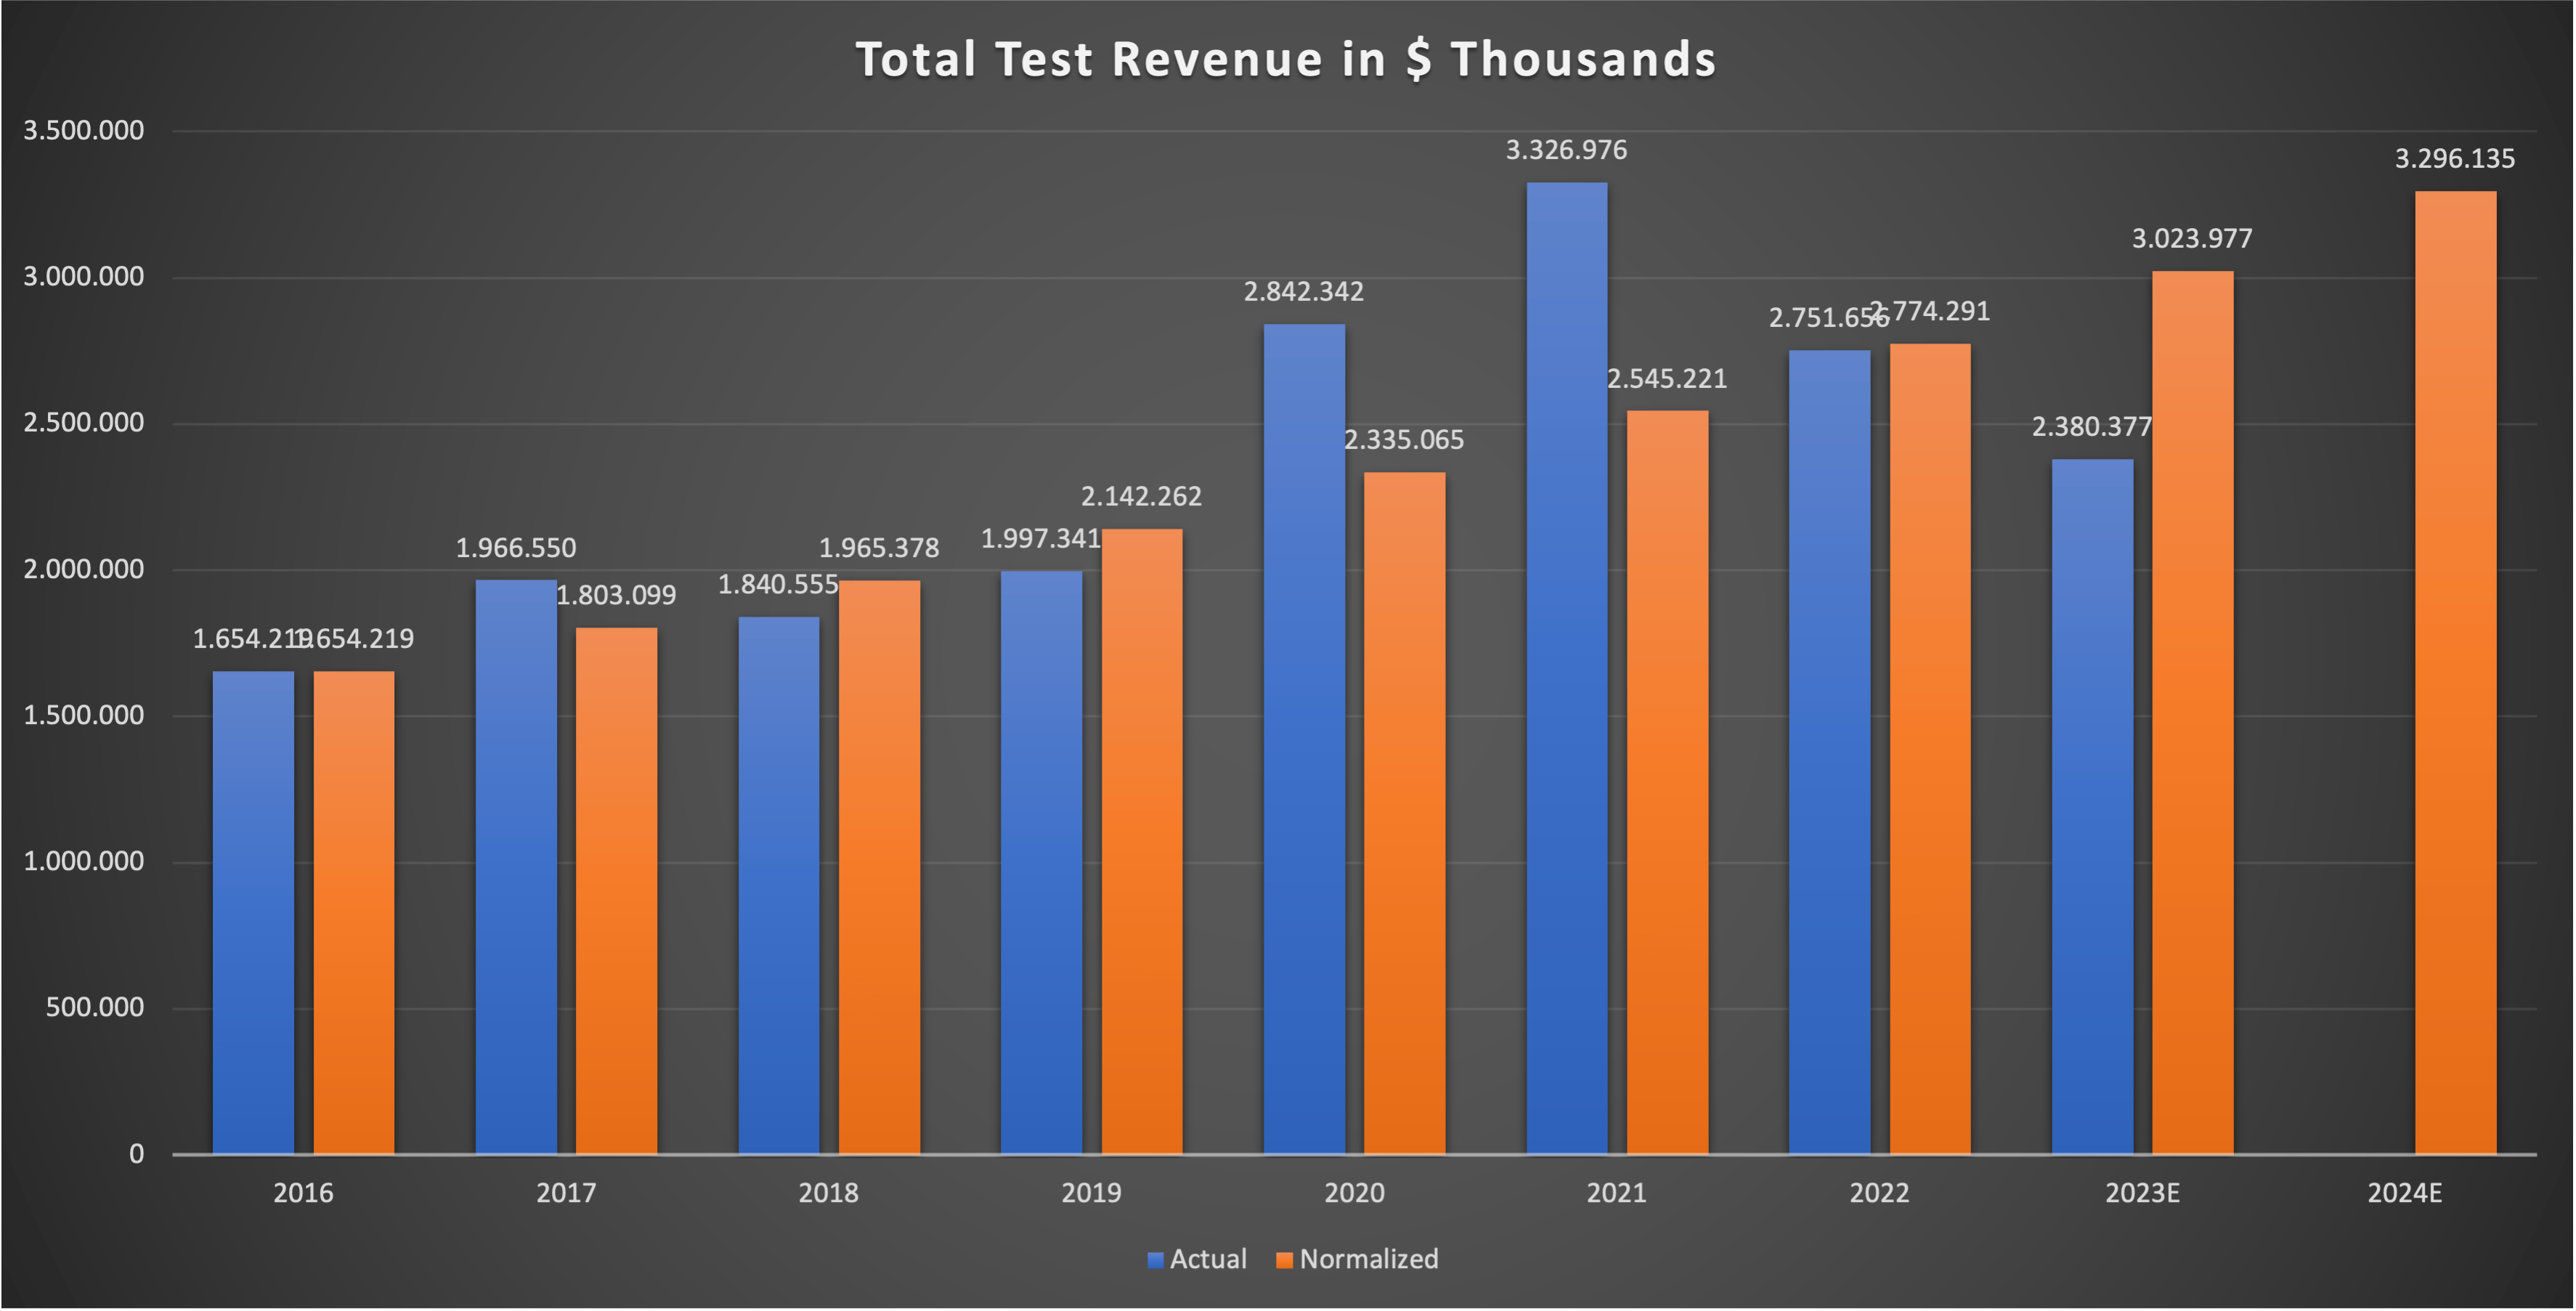
Note that the 2023E actual number is the number for the TTM right now (Q4 22 to Q3 23). This looks much better, doesn't it? Normalized for the assumed underlying market growth (and factoring out volatility), FY24 would be equal to the actual numbers of FY21. The outlier years of the pandemic (FY20/21) made TER earnings look much better than the underlying markets.
Now let's assume that margins for this normalized FY24 would be nearly the same as in FY21 (as I have shown earlier, margins are tightly connected to revenue). In this case, we should see net income similar to FY21. FY21 Non-GAAP net income came in at $1.05 billion. Normalized FY24 Non-GAAP net income could be something around $1 billion. Please keep in mind that these are normalized numbers. I think we will see lower actual numbers in FY24 before seeing a record earnings year in FY25.
With the assumed $1 billion normalized net income for FY24 and a cash conversion rate of 90%+ (excluding the outlier years since 2020), normalized FY24 Free Cash Flow ((FCF)) might be around $900 million or $5.50 per share (assuming the current share count). This would put the normalized FY24 FCF Yield at exactly 6%. I also want to add that $5.50 FCF per share in my normalized FY24 scenario isn't that far off from the $7.50-$10.00 non-GAAP EPS TER is targeting for FY26 (see the slide with the FY2026E Financial Model).
So we have normalized FY24 test revenues of around $3.3 billion. Let's add Robotics revenue of $450 million, slightly higher than FY22 Robotics revenue of $400 million. This would result in a normalized FY24 total revenue of around $3.75 billion. Assuming a test revenue CAGR of 7% (the mid-range of the McKinsey estimate I mentioned earlier) and a Robotics revenue CAGR of 15% (far below TER estimates) until 2030, total revenue might grow from $3.75 billion (normalized FY24) to $6 billion (normalized FY30) with a CAGR of 8% until 2030.
Without any margin expansion, TER might be set up for low double-digit returns (6% normalized FCF Yield + 8% top-line growth). Now to finish off the valuation section, let's do a supplemental DCF calculation.
DCF Calculation
I will use the following inputs:
- $5.50 FCF per share.
- 8% growth until 2030.
- 4% growth into perpetuity.
- 10% discount rate.
I also want to note that I think 4% growth into perpetuity might be too low because TER has a very wide moat in the semiconductor test equipment market. Here is the result:
DCF Calculation (moneychimp.com)
The fair value for FY24 should be around $116 per share. If we discount this back by another 10% to reach an FY23 fair value, the FY23 fair value might be around $104 per share. As the stock currently trades at close to $92 per share, there is some valuation upside. The fair value of $104 is lower than the one I calculated in my February article ($120) because I used a more conservative 4% perpetual growth rate here.
Risks
In my opinion, there are two major risks: (1) The cyclicality of the semiconductor test equipment market and (2) The uncertain future earnings potential of the Robotics segment.
(1) Cyclicality
I already highlighted this in my initial article back in February. Here is what I wrote back then:
While the semiconductor market is expected to grow with a CAGR of 6-8% until 2030, it remains a cyclical market. Just ask investors in the memory space. There might be some major downturns in the whole industry in the future. If you are not able to stomach those kinds of downturns, Teradyne and Advantest are not good investments for you and you should probably stick with non-cyclical SWAN stocks. Selling when the semiconductor market experiences a downturn can be devastating for your overall returns. This is more of a psychological risk than a fundamental risk.
Source: Author's February article - Risks section
This remains unchanged.
(2) Uncertainty regarding the Robotics segment
As I have shown in the segment overview, the Robotics segment has been able to grow revenue impressively since FY15, but without being able to turn any meaningful profit. The underlying Cobot and AMR markets are supposed to grow in the mid-double-digits well into the future. The problem is that I don't know if/when TER will start to generate consistent profits in this segment. And even if it does, I have no idea what kind of margin level we can expect (the highest margin for this segment was achieved in FY17, a meager 5.2%).
TER's FY2026E Financial Model indicates that the management thinks it will be able to generate profits soon because TER guides margin improvement on the consolidated level. The profit margins of the Robotics segment will be one of the most important metrics to look out for in the next few years. Should TER not be able to generate profits in the Robotics segment anytime soon, the share price might suffer in case the market prices that in.
Conclusion
TER underperformed the broader market since my last article in February. The company operates in two markets with long-term tailwinds: (1) Semiconductor Test Equipment and (2) Robotics. In semiconductor test equipment, TER operates in a duopoly with Advantest, with both companies holding a combined market share of 95%+.
If we look at TER's underlying markets while factoring out short-term volatility in earnings, TER seems to be set up for low-double-digit returns in the medium term (until 2030). This would be nearly in line with past returns.
After reporting fantastic results in FY20 and FY21 due to the extraordinary effects of the pandemic, the company is currently facing two headwinds: (1) A decline in the semiconductor test equipment market and (2) an overall weaker economy that weighs on the System Test and the Robots segment. Therefore, we are currently seeing the counter-effect: declining earnings for FY22 and FY23.
My DCF calculation, using an approach with normalized earnings for FY24, discounted back to an FY23 fair value, indicates that TER might be undervalued.
Major risks include heightened volatility due to the markets TER serves and some questions regarding the profitability of the Robotics segment.
Summing it all up, I reiterate my "buy" rating on TER.
Editor's Note : This article was submitted as part of Seeking Alpha's Top 2024 Long/Short Pick investment competition , which runs through December 31. With cash prizes, this competition -- open to all contributors -- is one you don't want to miss. If you are interested in becoming a contributor and taking part in the competition, click here to find out more and submit your article today!"
For further details see:
Teradyne: Expected Test Market Rebound In FY24 Makes It A Buy