CC - The Chemours Company: Market Volatility May Present Buying Opportunity
Summary
- A steady decline in gross margin in 2022 may continue into 2023.
- An increase in volatility may present better buying opportunities.
- I value the stock based on valuation metrics and a discounted cash flow model.
The Chemours Company ( CC ) had an exciting and fantastic start to the year, returning 18% in January 2023. The company faces short-term headwinds, with its Titanium Technologies segment suffering volume declines due to supply constraints and price increases. The company could be an excellent addition to any long-term portfolio, especially when bought at an attractive valuation.
Supply constraints and price increases weighing on volumes
The company's Titanium Technologies segment saw sales deteriorate as 2022 progressed. Supply constraints coupled with price increases started weighing on volumes. In Q4 2022, the volume of its Titanium Technologies declined by 35% compared to the same quarter in 2021 (Exhibit 1) .
Exhibit 1:
The Chemours Company Q4 2022 Y/Y Change in Price and Volume (The Chemours Company Earnings Press Release)
Sales slowed in the first half of 2022 and declined in the second half of 2022 (Exhibits 1-4) . The management's commentary suggests that they expect sales for its Titanium Technologies segment to be slow in the first half and recover in the second half of 2023.
Exhibit 2:
The Chemours Company Q3 2022 Y/Y Change in Price and Volume (The Chemours Company Earnings Press Release)
Exhibit 3:
The Chemours Company Q2 2022 Y/Y Change in Price and Volume (The Chemours Company Earnings Press Release)
Exhibit 4:
The Chemours Company Q1 2022 Y/Y Change in Price and Volume (The Chemours Company Earnings Press Release)
Since the company employs LIFO accounting for its inventory, the first half could see margin pressure due to the high inventory cost. Investors should pay attention to the company's APM segment to track growth in green energy applications. The Inflation Reduction Act offers subsidies for hydrogen production. The company benefits from this subsidy.
The company faces uncertainty in the short-term, in the first half of 2023. There is much uncertainty in the economic environment. Inflation may increase or remain a thorn in the side of companies and its investors. Interest rates may stay higher for longer. The U.S. may enter a recession, and the global economy may slow down. The market's volatility has been subdued since the beginning of the year, with the S&P VIX Index at or below 20. There may be an opportunity to acquire Chemours during a market sell-off during increased market volatility.
A decline in gross margins and an increase in inventory
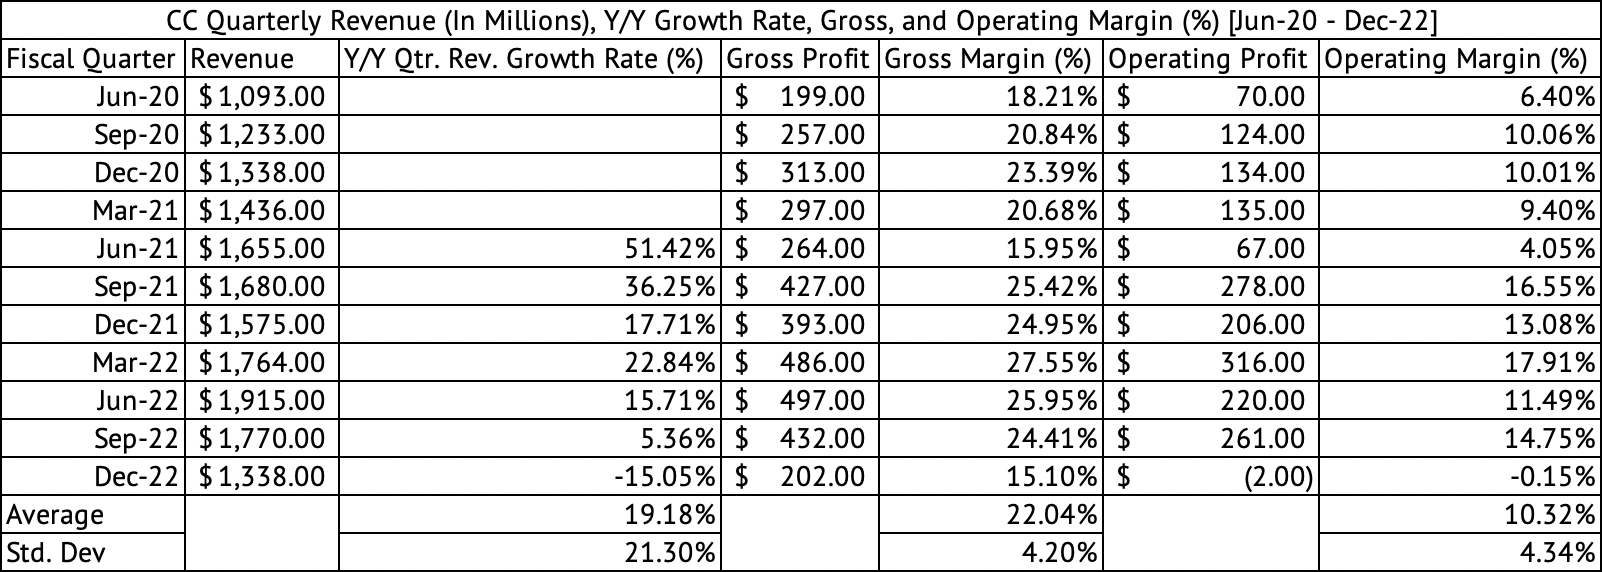
Gross margins started strong in 2022 but steadily declined as the year progressed (Exhibit 5) . The company's gross margins averaged 22.5% over the past decade, with a standard deviation of 3.7%. Gross margins suffered in 2022, with the company's gross margins dropping to 15.1% in the December 2022 quarter. This low gross margin may be due to high inventory costs and a drop in factory utilization due to a decline in volumes, especially in its TT segment.
Exhibit 5:
The Chemours Company Quarterly Revenue, Gross, Operating Profit, and Margins (Jun 2020 - Dec 2022) (Seeking Alpha, Author Compilation)
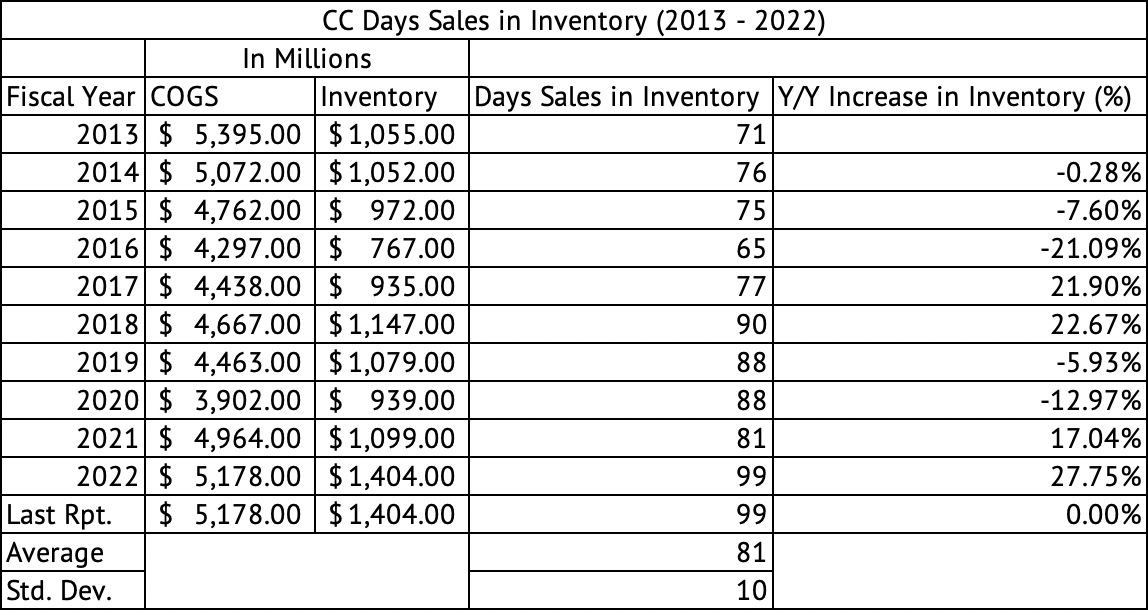
The carrying cost of inventory has increased, with the company carrying 99 days' worth of sales in stock. The company averaged 81 days of sales over the past decade, with a standard deviation of 10 (Exhibit 6) .
Exhibit 6:
The Chemours Company Days' Sales in Inventory (Seeking Alpha, Author Compilation)
Various materials and consumer staples companies have seen their inventory costs increase during the past year's high inflation and almost consistently carried inventory above one standard deviation from their mean (Exhibit 7) . The high inventory costs seen by the Chemours Company are not unique. Nevertheless, a company's margins and operating cash flows are negatively impacted due to these high inventory costs.
Exhibit 7:
Days' Sales in Inventory for Various Consumer Staples and Materials Companies (Seeking Alpha, Author Compilation)
Dividend, share repurchase, debt
The company offers a 2.9% dividend yield with a safe payout ratio of 21%. Over the past 11 quarters, the company generated enough operating cash to cover its dividend and CapEx in nine of those quarters.
The company spent $1.8 billion to repurchase its stock over the past decade since 2017. The company reduced its diluted share count from 181 million in 2013 to 158.3 million in 2022 (Exhibit 8) , a 12.5% reduction.
Exhibit 8:
The Chemours Company Share Repurchase and Diluted Share Count (Seeking Alpha, Author Compilation)
The company has a total of 3.6 billion and net debt (after cash) of $2.5 billion . The debt to EBITDA ratio stood at 3x, and its net debt to operating cash flow ratio of 3.3x at the end of fiscal 2022. Most of the company's debt is due in 2025 or later, so the company may not face a short-term liquidity issue (Exhibit 9) .
Exhibit 9:
The Chemours Company Debt Schedule (SEC.GOV)
Chemours delivered a double-digit return in January
The stock has some positive momentum, gaining 5.8% over the past three months. The stock gained 18.8% in January 2023 compared to a return of 6.2% for the Vanguard S&P 500 Index ETF ( VOO ). The stock has lost 3%, while the Vanguard S&P 500 Index ETF has lost 9.2% over the past year. But the one-year RSI and MFI technical indicators suggest that this short-term momentum may be fading (Exhibit 10) , and the five-day values show the stock may be at overbought levels. If the market turmoil increases, the stock may significantly pullback in the coming weeks. Investors may consider buying a small position in the stock if it drops to $32 and continue adding below $30. The stock's 52-week low is $22.56.
Exhibit 10:
The Chemours Company Technical Indicators (Seeking Alpha)
The stock had a strong positive monthly return correlation of 0.65 with the Vanguard S&P 500 Index ETF between June 2019 and January 2023. The stock's monthly return beta was 1.82 , as measured by a linear regression model, over the same period between June 2019 and January 2023. This high beta may explain why the stock amplifies the returns of the Vanguard S&P 500 Index ETF on the upside and the downside. The high beta and the strong positive correlation may produce good buying opportunities during a market sell-off.
The company trades at a forward GAAP PE of 8x , comparable to its five-year average. The stock may be fully valued at its current price of $34.35 . A discounted cash flow model shows that the stock may be fully valued. The model estimates the fair value of equity at approximately $29.90 (Exhibit 11) .
Exhibit 11:
Discounted Cash Flow Model for the Chemours Company (Seeking Alpha, Author Calculations)
The model assumes a revenue growth rate of 3% and a free cash flow margin of 7%. The company has averaged a free cash flow margin of 4.5% with a standard deviation of 5.1% over the past decade. The company has a good return on invested capital of 11.6%. The company may have earned more than its cost of capital, which is assumed to be 10%.
The Chemours Company may be fully priced, trading at $34.35. The stock had a solid start to the year, returning 18% in January 2023. Given the high beta and the strong correlation with the Vanguard S&P 500 Index, investors may get an opportunity to buy the stock during times of high market volatility. Investors should consider buying aggressively below $30. The Chemours Company is an excellent company to hold in a long-term portfolio if purchased at a valuation discount.
For further details see:
The Chemours Company: Market Volatility May Present Buying Opportunity