CC - The Chemours Company: On A Nice Run
2023-07-03 06:50:04 ET
Summary
- The Chemours Company's Titanium Technologies segment has been hit hard due to a decline in the residential housing, commercial construction, and packaging markets, leading to a significant drop in volumes and net sales.
- The Chemours Company stock has seen a 39% increase since May, but the RSI and MFI technical indicators suggest it is nearing overbought levels.
- The company's dividend yield has dropped to 2.7%. It is best for investors to wait for a yield above 3%.
- CC stock is highly volatile, and I suggest investors should wait for a drop in the stock before buying.
In February, I stated that investors should be opportunistic in buying the Chemours Company (CC) during market volatility and weakness in the stock. I had rated it a hold. A buying opportunity came at the end of May when the stock traded close to $26.49. I missed the opportunity to add to my holdings at that price. In April, when Wolf Report put a buy rating on the stock when it was trading at $29.39, it may have been an excellent time to start paying attention to the stock. But all is not lost.
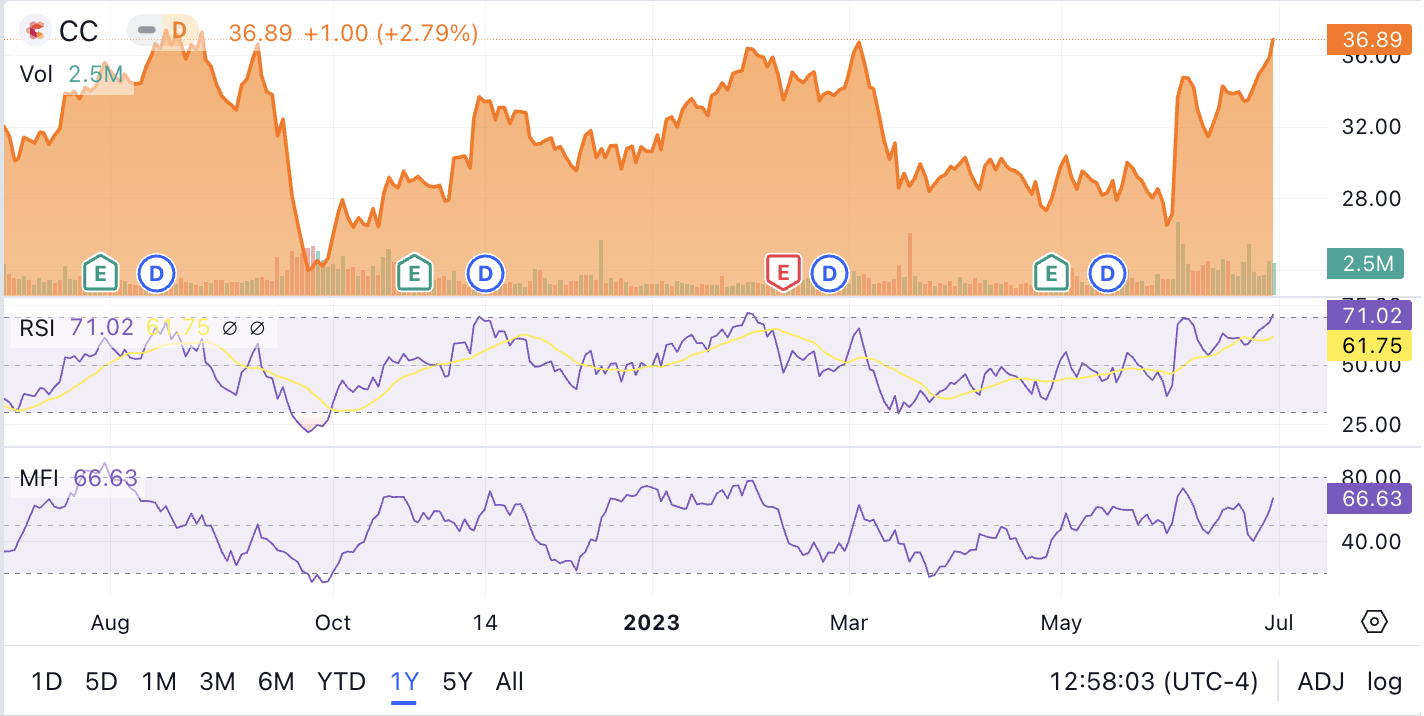
The company's volumes and margins are getting crushed, especially in its Titanium Technologies segment. This decline in volumes is worrying, and price increases are unable to compensate for the lost revenue due to volumes. The Chemours Company may present another buying opportunity below $30 as the stock looks overbought at current levels based on RSI and MFI technical indicators (Exhibit 1) .
Exhibit 1:
The Chemours Company RSI and MFI Technical Indicators (Seeking Alpha)
A drop in the housing and construction markets hurts the Titanium Technologies segment
In Q1 2023, the company's Titanium Technologies segment continued to suffer due to weakness in the residential housing, commercial construction, and packaging markets. The Federal Reserve's battle against inflation and the subsequent rise in interest rates has put much pressure on the housing segment. The residential construction market needs lower rates to recover, although you wouldn't know it by looking at the stocks of home builders.
Since there is much pent-up demand for housing in the U.S., and if mortgage rates decline to 5% or below, that may spark a rally in home sales and provide a much-needed boost in demand for Chemours. But, Commercial Construction is suffering due to the hollowing out of downtown office buildings and malls. No other city in the U.S. epitomizes the problems facing commercial real estate like San Francisco. San Francisco has the highest office vacancy of any city in the U.S. It is safe to say that a recovery in commercial office buildings will take a long time.
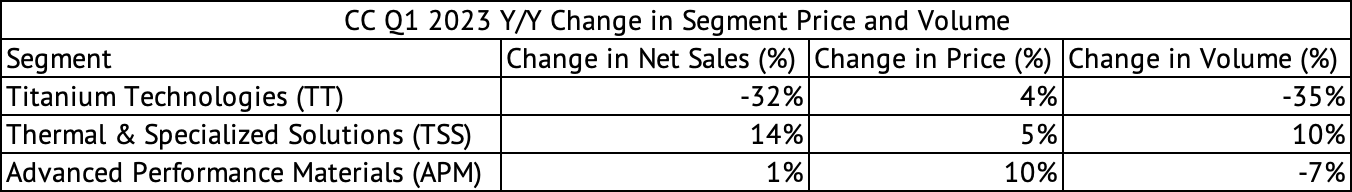
Unsurprisingly, the Chemours Company's Titanium Technologies segment saw a 35% drop in volumes in Q1 2023 and a 32% drop in net sales (Exhibit 2) . This segment is coming off of a 35% decline in volume in Q4 2023 (Exhibit 3) . The segment's sales dropped from $928 million in Q1 2022 to $632 million in Q1 2023. The company recorded a staggering 66% drop in adjusted EBITDA from $206 million to $70 million, taking its adjusted EBITDA margins to 11% in Q1 2023 compared to 22% in the same quarter in 2022.
Exhibit 2:
The Chemours Company Q1 2023 Change in Segment Price and Volume (The Chemours Company Earnings Press Release)
Exhibit 3:
The Chemours Company Q4 2022 Change in Segment Price and Volume (The Chemours Company Earnings Press Release)
The company's Thermal & Specialized Solutions segments continue to perform well, with a sales gain of 14% on the backs of both price and volume increases during the quarter (Exhibit 2) . The company's Advanced Performance Materials segment, which was holding its own over the last few quarters, may be beginning to show weakness with the price increases finally accelerating volume declines. This division saw sales increase by just 1% y/y due to a price increase of 10% and a volume decline of 7% (Exhibit 2) .
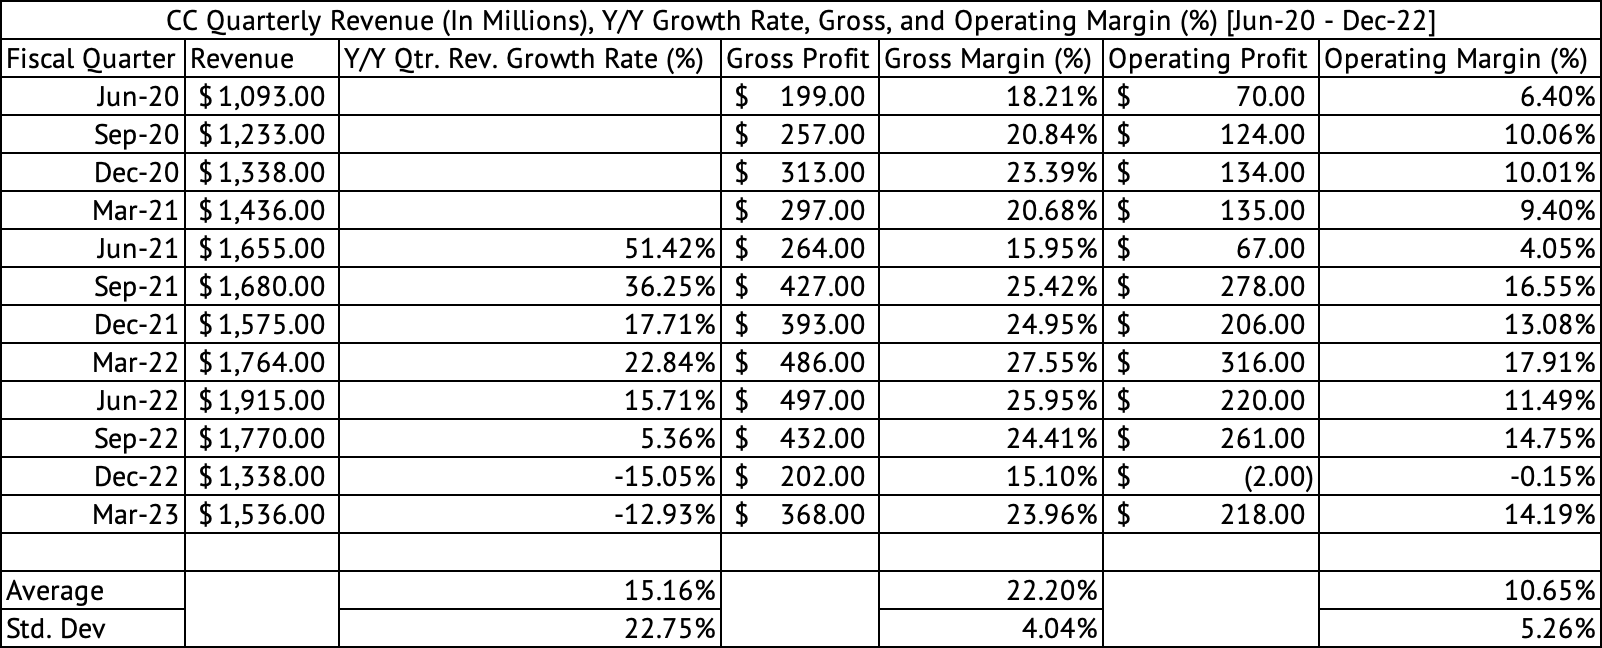
Although the company's overall sales declined y/y by 12% in March 2023, its sales increased sequentially from December 2022 (Exhibit 4) . The company's EPS handily beat Wall Street estimates by $0.47. There is certain seasonality in the company's business, with Q1 being the low point. Investors may be betting on the fact things are not looking bad across the global economy if Chemours can post sequential revenue growth and trounce EPS estimates. These positives may have led investors to drive the share price up by 39% since May. The PFAS settlement in the U.S. most likely contributed to investors' exuberance. Typically, Q2 and Q3 are the strongest quarters for the company.
Exhibit 4:
The Chemours Company Quarterly Revenue, Gross, Operating Profits, and Margins (Seeking Alpha, Author Compilation)
The RSI and MFI technical indicators are nearing overbought levels, and the stock faces resistance around its current price of $36.89. Over the past three months, the stock has far exceeded the sector's performance . The stock has returned 24%, while the materials sector has dropped 4%.
The Vanguard Materials ETF (VAW) has had a reasonably good year. It has not returned stratospheric gains like the NASDAQ (COMP.IND), but the companies in the ETF have delivered a median return of 8% (Exhibit 5) . The processor and distributor of industrial metals, Ryerson Holding (RYI), is the best performer in the ETF, with a return of 107% (Exhibit 7) .
Exhibit 5:
VAW ETF 1-Year Return Statistics (Barchart.com, Data Provided by IEX Cloud)
Exhibit 6:
VAW ETF Top-10 Best Performers (1-Yr. Return) (Barchart.com, Data Provided by IEX Cloud)
An exploration stage company focused on boron and lithium carbonate, 5E Advanced Materials (FEAM), is the worst performer in the ETF, dropping over 70% (Exhibit 7) . Kronos Worldwide (KRO), a competitor to Chemours, is also on this worst performers list. Kronos is focused on producing Titanium Dioxide and does not have the diversification of the Chemours Company. The stock has lost 48%, while Chemours has gained 15% over the past year. Chemours is the largest producer of Titanium Dioxide, having the capacity to produce more than double that of Kronos. Kronos is ranked fourth worldwide in Titanium Dioxide production capacity.
Exhibit 7:
VAW ETF Bottom-10 Worst Performers (1-Year Return) (Barchart.com, Data Provided by IEX Cloud)
The stock may soon take a breather after this stellar run. The stock is also highly volatile and carries a high Beta of 1.8 , a measure of its volatility So, Investors should be patient and wait for a drop in the stock before buying the Chemours Company.
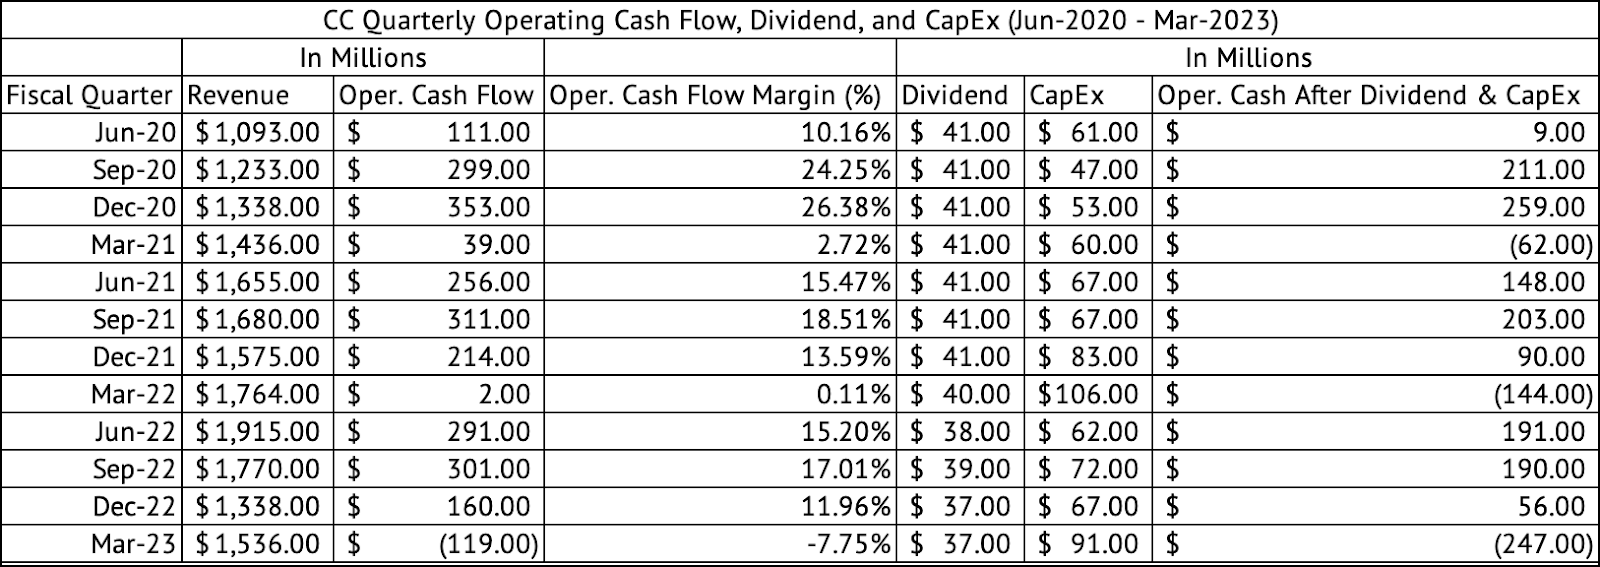
The dividend yield has also dropped with this massive run, Chemours now yield just 2.7%. It may be best to wait for a yield of above 3%. If the stock retreats to $29, it would yield 3.4%. Investors should demand a higher yield, given the volatility and cyclicality of the company's earnings. Although Q1 is its weakest quarter, the company used cash in its operations to the tune of $247 million after paying for CapEx and dividends (Exhibit). But, the company has enough cash to cover its debt payments and dividends for the foreseeable future if the economy takes a deep downturn.
Exhibit 8:
The Chemours Company Quarterly Operating Cash Flow (Seeking Alpha, Author Compilation)
The company's 3-year yield on cost is an astounding 6.5% , which means investors who acquired the stock during the market's pandemic meltdown in 2020 have not only doubled their investment but also generated a great income from the stock. This is an example of buying good companies during times of panic.
The Chemours Company has a low PE for a reason
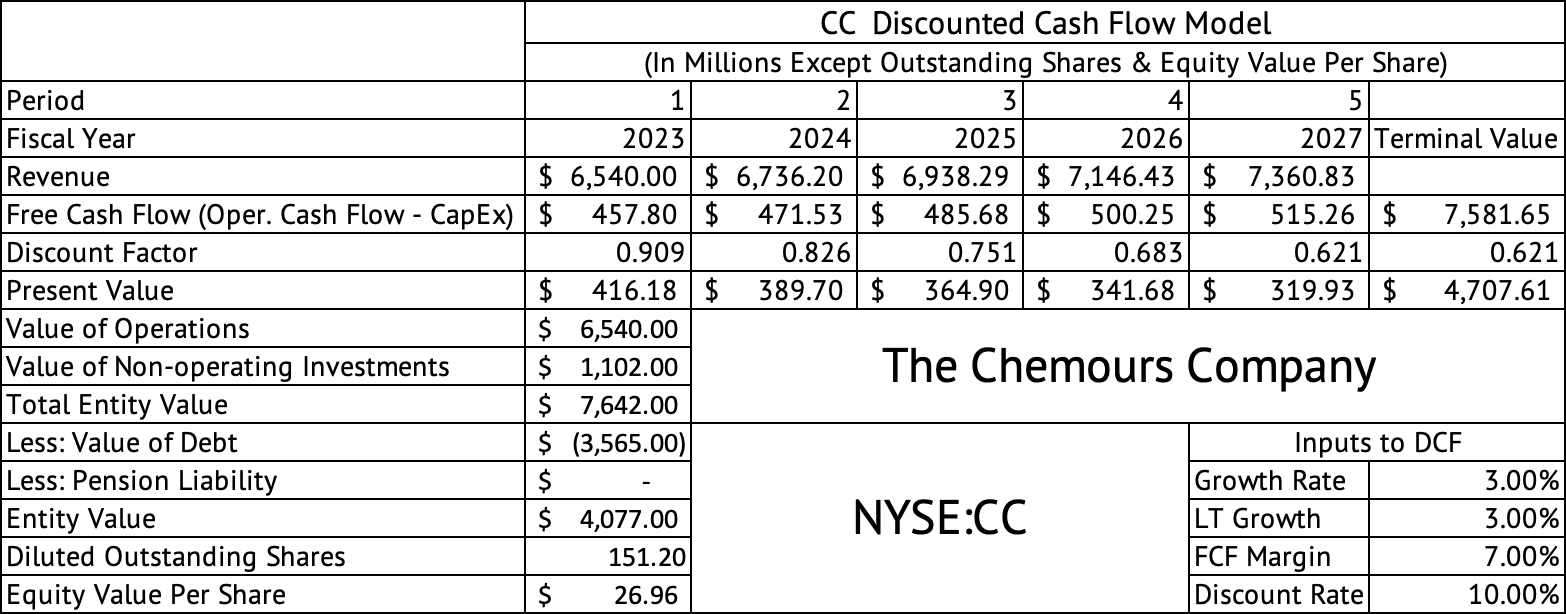
The company trades at a forward GAAP PE of 9.6x compared to the sector median of 13x. But, its five-year average is 8.2x. A discounted cash flow model estimates the per-share equity value at $26 (Exhibit 9) . This is a drop from $30 when I ran the model in February. The valuation dropped due to lower revenues. This model assumes a discount rate of 10%, which may be too high given the company's reasonably strong balance sheet with a manageable debt load. On the other hand, the company's highly volatile earnings may necessitate this discount rate.
Exhibit 9:
The Chemours Company Discounted Cash Flow Model (Seeking Alpha, Author Calculations)
Although the company operates in a cyclical market, the Chemours Company can make an excellent long-term holding if purchased at a valuation that offers some safety and good income during volatile times. The stock is highly volatile and will present good buying opportunities when there is an economic slowdown. Investors should demand a yield greater than 3% before acquiring the stock.
For further details see:
The Chemours Company: On A Nice Run