PLTR - The Ripple Effect: Interest Rate Cuts And The Dynamics Of Portfolio Performance
2023-07-11 07:45:00 ET
Summary
- Wall Street Analysts expect the FOMC to begin cutting the Fed funds rate in January 2024.
- The S&P has finished higher 77% of the time 12 months after an initial Fed rate cut.
- A cut in interest rates offers a unique opportunity for an event-driven strategy to take advantage of certain sectors of the market that have historically outperformed during periods of inflation.
- Within this article, we look to compare and contrast different investment strategies with the end goal to optimize alpha should we see a reduction in interest rates.
Introduction
In the ever-evolving world of investing, staying ahead of market trends and making informed decisions is critical. In this article we aim to examine the potential impact of a rate cut within our portfolio of stock picks.
We began by scrutinizing the chances of a rate cut. We then examined the construction and methodology behind our investment portfolio, including the factors considered and the investment approaches employed. Additionally, we did a comparative analysis of the historic performance and returns of our portfolio, comparing it against relevant benchmarks and market conditions.
Probability of a Rate Cut
According to consensus among Wall Street banking analysts, the Fed is expected to begin cutting rates in January 2024 through the end of December 2025, forecasting a total reduction of 220bps of the Fed Funds Rate.
In his last speech on June 14th, FED Chairman Jerome Powell addressed the media with FOMC's decision of keeping the FED rate unchanged. When asked about forward rates he said,
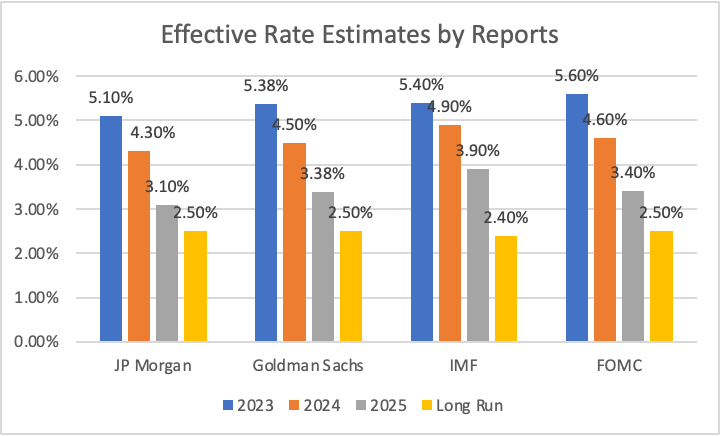
'If the economy evolves as projected, the median participant projects that the appropriate level of the FFR will be 5.6% at the end of this year, 4.6% at the end of 2024, and 3.4% at the end of 2025'
- FED Chair J. Powell.
-Source (Author), Data (Reports)
As of March 22, 2023, these projections were 5.1% by the end of 2023, 4.3% by the end of 2024, and 3.1% by the end of 2025. These projections changed with time but we saw an outlook of a possible rate cut in the future. To get a better idea of when to project the cut, we compiled a chart from the consensus of 4 reports- JP Morgan, Goldman Sachs, IMF, and FOMC- for expectations of end-of-year rates for the years 2023-2025 and a forward outlook.
Based on the projections provided, there is a likelihood of one more rate hike towards the end of 2023, with an increase of 25 to 50 basis points. However, the data suggests that the Federal Reserve is expected to embark on a rate-cutting cycle starting in early 2024 and continuing through the end of 2025. This adjustment aims to fulfill the FED's mandate of achieving a 2% inflation rate.
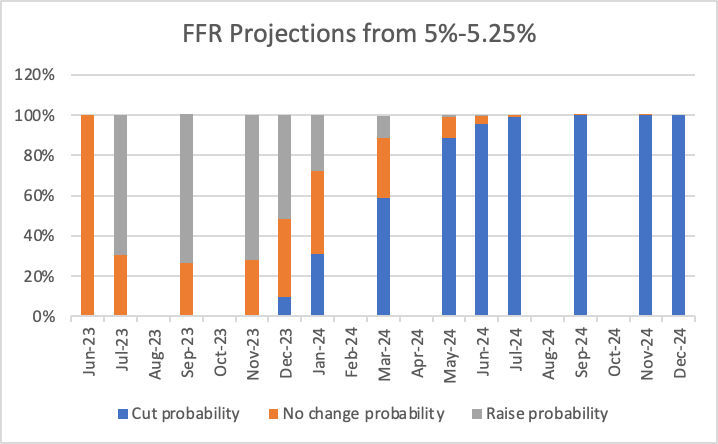
To gain further insights, we used data from CME's Fedwatch tool which provides probabilities of rate cuts based on the current rate range of 5% to 5.25%.
Source- CME FedWatch tool, (Data) Graph (Author)
The chart above shows the probability of a rate cut from the current Fed Funds Rate (FFR) of 5-5.25%. This projection follows the final rate hike scheduled for July. Notably, January demonstrates a higher probability for a rate cut from the 5% target rate compared to the likelihood of rate maintenance.
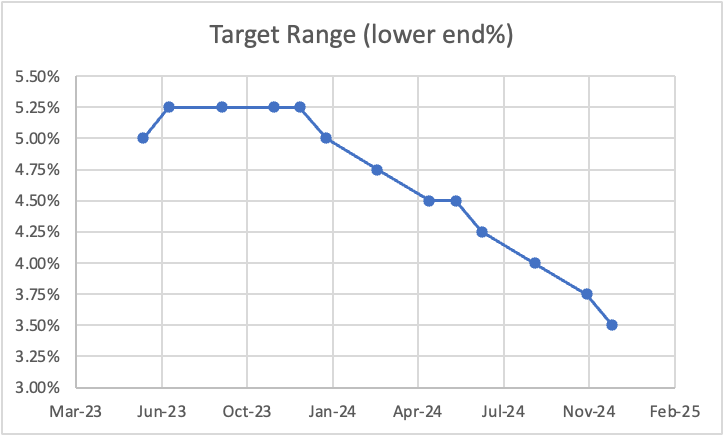
Source- cmegroup.com FedWatch tool (Data), Graph (Author)
The chart depicts the lower end of the target range predicted from July 2023 to December 2024. We anticipate another rate hike in 2023, followed by a series of rate cuts commencing in January 2024. These rate cuts are expected to occur consistently at 25 basis points for every FOMC meeting checkpoint.
After compiling the data (FedSpeak, CME futures, and IB reports) we came to a consensus by using the most conservative numbers as given by the FOMC: Estimated rate of 5.6% for December 2023, 4.6% for December 2024, and 3.4% for December 2025.
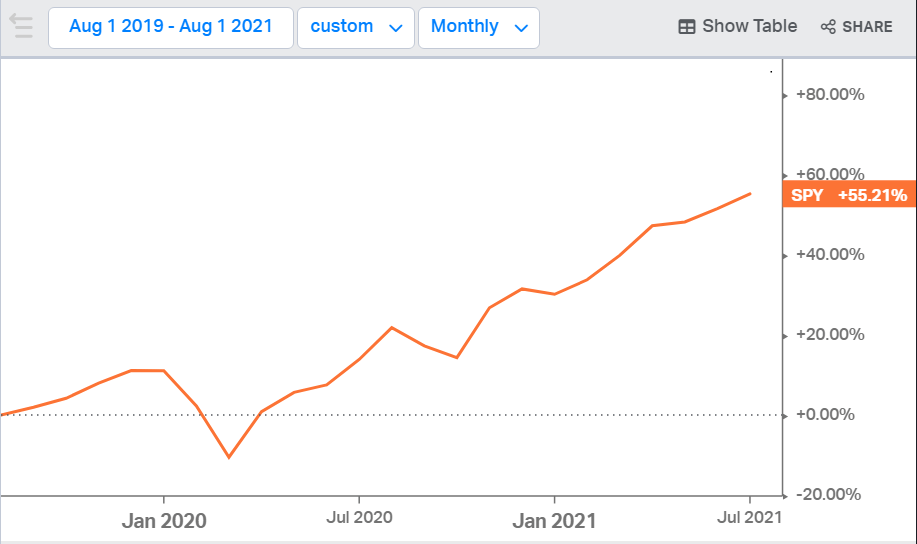
Performance of S&P after FFR cut
A cut in interest rates has led to a 16.88% average 12-month return in the S&P 500 historically since 1945. The S&P went up 77% of the time following a rate cut. The average 3-year Rate of Return is 45.84% (recessions during 1945- 2009). The average 5-year return is 120.33% (recessions during 1945 - 2009). The cuts significantly impact the technology sector, especially subsectors like artificial intelligence, cloud computing, and semiconductors.
-Source (koyfin)
S&P Performance following initial rate-cut
| Initial Rate Cut Year |
| 12 Months After |
| 24 Months After |
| Total Rate Cut |
| Aug 2019 |
| + 13.88% |
| +55.21% |
| 225 bps |
| Oct 2008 |
| +11.88% |
| +23.31% |
| 200 bps |
| Sept 2007 (housing market crash) |
| -14.3% |
| -29.98% |
| 325 bps |
| Nov 2002 |
| +13.89% |
| +24.41% |
| 75 bps |
| Jan 2001 (dot com crash) |
| -15.51% |
| -33.75% |
| 475 bps |
| September 1998 |
| +30.93% |
| +44.21% |
| 75 bps |
| July 1995 |
| +22.07% |
| +63.51% |
| 75 bps |
-Source (koyfin)
Portfolios
We used a stock simulator with $100,000 mock dollars for investing in our chosen stock picks.
Our Portfolio
We chose 7 stocks, also taking an equal-weight approach, investing approximately $14,286 into each name. The trades were executed when the market opened on June 8th, 2023.
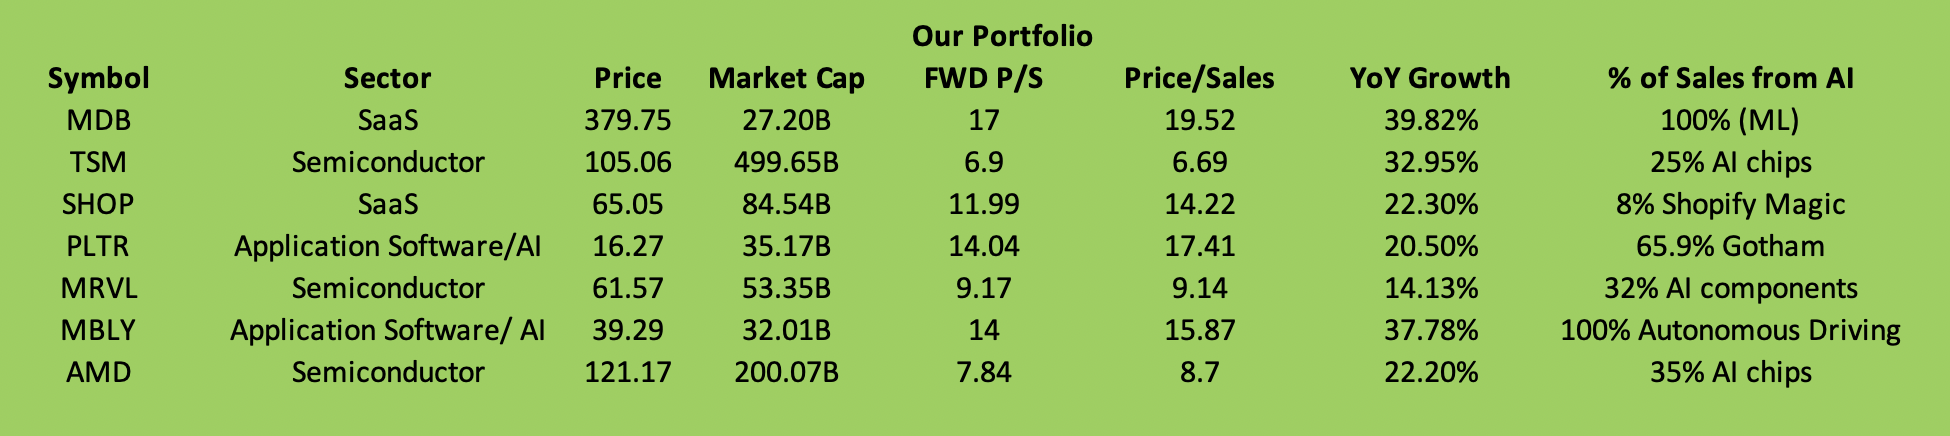
Source (Author), Data (SeekingAlpha), % of Sales from AI (ChatGPT 4 search generated)
For the stock screening process, we researched and undertook a top-down approach. Our list includes undervalued tech companies with strong revenue projections based on the metrics given in the table above. The following questions helped us derive our portfolio:-
-
Best stocks to buy if Fed cuts rates
-
Best tech stocks to invest
-
AI stocks with the strongest revenue growth
-
Top AI stock picks
-
Top cloud computing stock idea
-
Top small-cap AI stocks
These companies earn a significant portion of their revenues from AI but the impelling reason for choosing these stocks is their potential to utilize AI further as a ballast for growth. To determine the importance of AI in these firms, we calculated the percentage of AI-driven revenues. These figures for AI usage are estimates calculated by ChatGPT based on revenue breakdowns. Additionally, we considered using the forward price-to-sales (P/S) ratio to account for the growth potential of our portfolio companies and YoY Growth.
Our Stocks
Advanced Micro Devices, Inc. ( AMD ) operates as a worldwide semiconductor company. While gaming was driving the majority of their revenues in the past, like Nvidia, this company has expanded to developing chips necessary for Artificial Intelligence and Large Language Model data processing.
Taiwan Semiconductor Manufacturing Company Limited ( TSM ), together with its subsidiaries, manufactures, packages, tests, and sells integrated circuits and other semiconductor devices internationally. It is the main Original Equipment Manufacturer (OEM) for chip manufacturers like AMD, Intel, and Nvidia.
Marvell Technology, Inc., ( MRVL ) provides data infrastructure semiconductor solutions and data center interconnect solutions. Accurate AI models require extremely large amounts of data for efficient data processing and this company can benefit greatly in revenues due to this AI boom.
Palantir Technologies Inc. ( PLTR ) is a mid-cap company that uses AI in its Gotham platform for data analytics in the intelligence community. Improvements in their Gotham platform can drive significant revenue growth with government contracts.
MongoDB, Inc. ( MDB ) is a database management services company that provides a commercial database server tool for enterprise customers to run in the cloud. MDB has its Enterprise Advanced tool that its customers use to run AI models. A large amount of data is needed to run machine learning models that can ultimately drive AI growth.
Shopify Inc. ( SHOP ) is an e-commerce platform that uses its Shopify Magic AI tool for product description using computer vision. The company's platform enables merchants to display, manage, market, and sell their products through online store hosting.
Mobileye Global Inc. ( MBLY ) engages in the development and deployment of advanced driver assistance systems (ADAS) and autonomous driving technologies and solutions with a robust revenue outlook. This company is at the forefront of Level 5 autonomous driving research and development (R&D) and its ability to deploy its technology will catapult its growth.
Timeline Expected to Compare Portfolios
The above image shows the performance comparison so far.
We will be comparing our portfolio with the markets based on checkpoints in the FED Funds rate timeline. Our checkpoints are-
June 8, 2023 (the start date of our experiment) - January 2024 FOMC meeting (expected initial rate cut)January 2024 FOMC meeting - January 2025 FOMC meeting (1 year after the expected initial rate cut)January 2024 - January 2026 (2 years after the expected initial rate cut)
Based on the theory that our stock picks will benefit from the rate cut, we expect that our portfolio will outperform the NASDAQ. Since our picks are composed of a greater portion of mid-cap growth companies, we expect a higher alpha (compared to the Nasdaq) long-term, fueled by rates coming down.
Performance Comparison
We ran a performance comparison between our portfolio and the Nasdaq (as a barometer of the tech sector) with respect to the last time we saw such an aggressive drop in rates (220 basis points from August 1, 2019, through March 25, 2020), highlighted below.
Performance Comparison: Our Portfolio vs NASDAQ ( During August 2019 through March 2020 Rate-Cuts )
| Intern ROR |
| Index (Nasdaq/QQQ) |
| 12 months before first rate cut |
| * 53.42% |
| 8.29% |
| 12 months after first rate cut |
| ** 101.10% |
| 40.91% |
| 24 months after first rate cut |
| *** 188.54% |
| 94.38% |
Source- (Author) from Koyfin data
*calculated w/o PLTR and MBLY I calculated w/o PLTR and C3.ai
**calculated w/o PLTR and MBLY II calculated w/o PLTR and C3.ai
***calculated w/o MBLY III calculated with PLTR and C3.ai
As the table above illustrates, our portfolio outperformed ChatGPT as well as the index on all three intervals of time that were being tracked.
An important factor to be considered for the chosen timeline:
- 2020 was considered a black swan event (The Covid-19 pandemic).
- Our focus however is on the 220 bps rate cut during that time, which (as of today) is commensurate with Wall Street's consensus forecast of rate cuts through year-end 2025.
Acknowledging that the rate cuts in 2020 occurred within a 12-month timeframe, we are likely to see any future cycle of rate cuts spanning over 2+ years. Furthermore, we examined GDP forecasts to gain additional insights. A report from Morningstar highlights that GDP is projected to incorporate the impact of the rate cut, with growth expected to accelerate in the second half of 2024, eventually reaching full growth by 2025-2026.
By factoring in the unique circumstances of the Covid-19 pandemic, aligning our analysis with the anticipated rate cut timeline, and considering the projected growth trajectory of the economy, we aim to hold the portfolio and track the comparison with NASDAQ by the end of Q1 2025.
Other Factors to Consider
10Y Treasury Yield - 2Y Treasury Yield
The current negative value of the 10-year subtracted by 2-year (10Y-2Y) Treasury Yield is a significant indicator to consider. Historical patterns have shown that when this yield normalizes, it has been a reliable predictor of an upcoming recession. We expect this normalization to occur following the interest rate cuts with the 10Y-2Y moving towards positive territory. The Federal Reserve's rate cuts historically lead to a steepening of the yield curve, and as the 10-year yield falls below the 2-year yield, it reflects increased demand for longer-term bonds. Monitoring the trajectory of the yield curve and its relationship to interest rates is crucial for investors, as it provides insights into potential economic conditions and guides informed decision-making in navigating the market landscape.
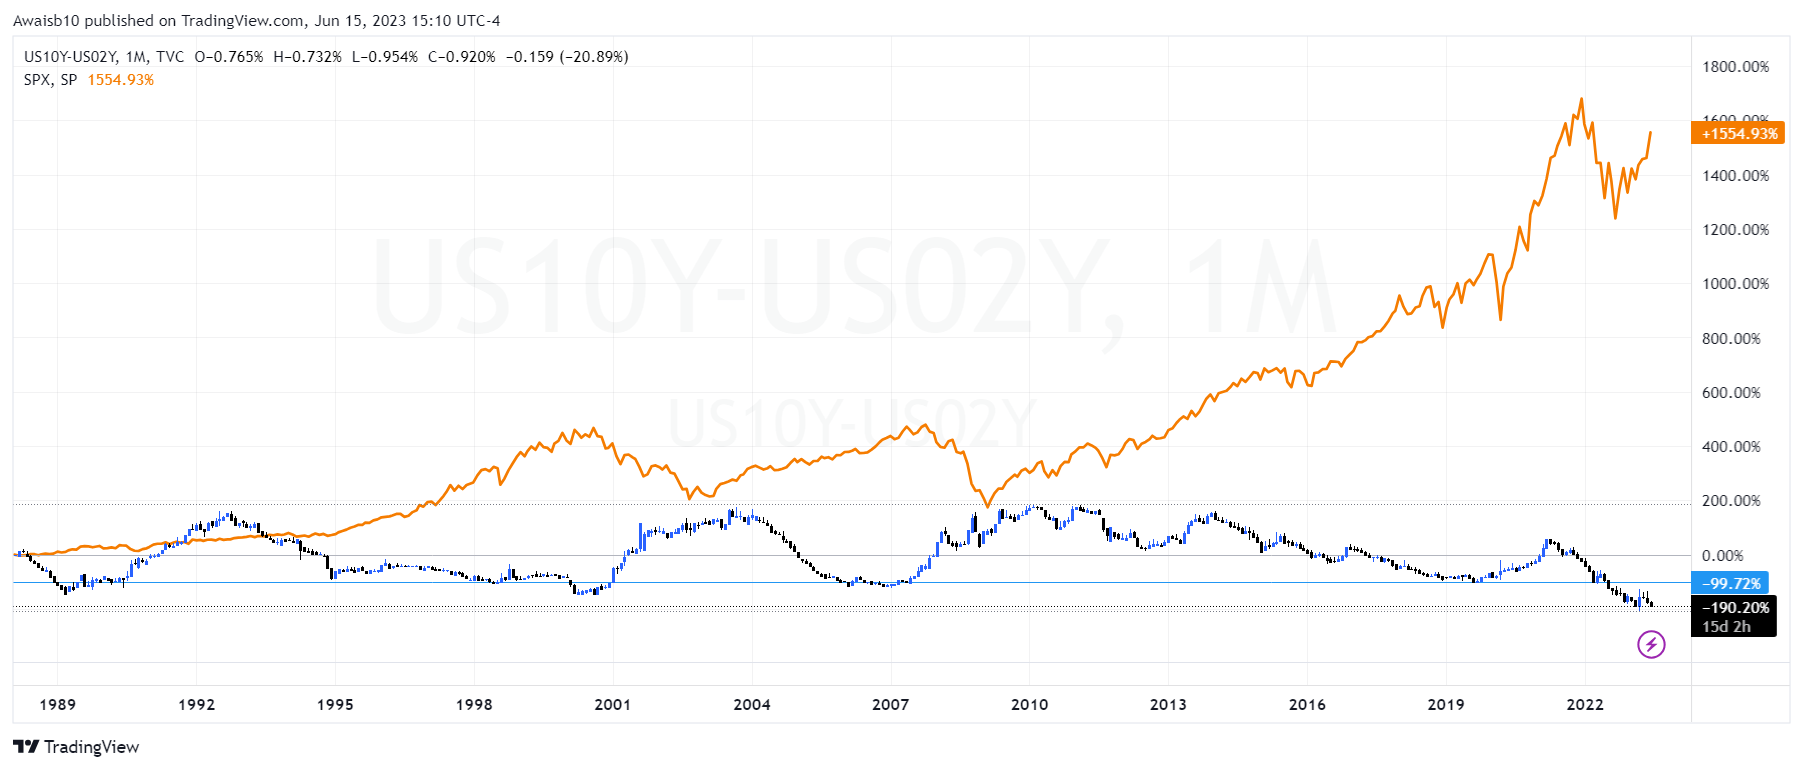
Source- Tradingview
A negative value in the 10Y-2Y yield chart implies that short-term interest rates are higher than long-term interest rates, a phenomenon that has historically been associated with economic uncertainty and potential recessionary pressures. As investors interpret this inversion as a signal of potential economic weakness, it can trigger a shift in market sentiment, leading to a decline in stock prices and subsequent bear market conditions for the S&P 500.
Conclusion and Disclaimer
Anticipating a rate cut presents an exciting opportunity for our portfolio, particularly in the tech sector. The potential benefits, including reduced borrowing costs, increased investor appetite, and support for valuations, can enhance our portfolio's performance. However, it is important to remain vigilant, closely monitoring economic and market factors, and adapting our strategy accordingly. By maintaining a disciplined approach and practicing effective risk management, we can position ourselves to capitalize on the potential upside while navigating the dynamic landscape of the technology sector, specifically companies that will improve in the Artificial Intelligence sector as it calls for unprecedented growth.
"Artificial intelligence will be the most transformative technology in the world, and it will change the way we live and work in ways we can't even imagine yet."
-Warren Buffett
For further details see:
The Ripple Effect: Interest Rate Cuts And The Dynamics Of Portfolio Performance