SPY - The SCHX-SPY Divergence Suggests A Hiding Place
2023-07-26 02:54:26 ET
Summary
- Large-cap funds such as Schwab U.S. Large-Cap ETF and SPDR S&P 500 Trust ETF have historically performed almost identically.
- However, during recent market turmoils, SCHX has diverged from (i.e., underperformed) SPY by a good amount.
- With SPY’s current lofty valuations, I will explore the reasons for this divergence and discuss why it suggests a hiding place for investors.
Thesis
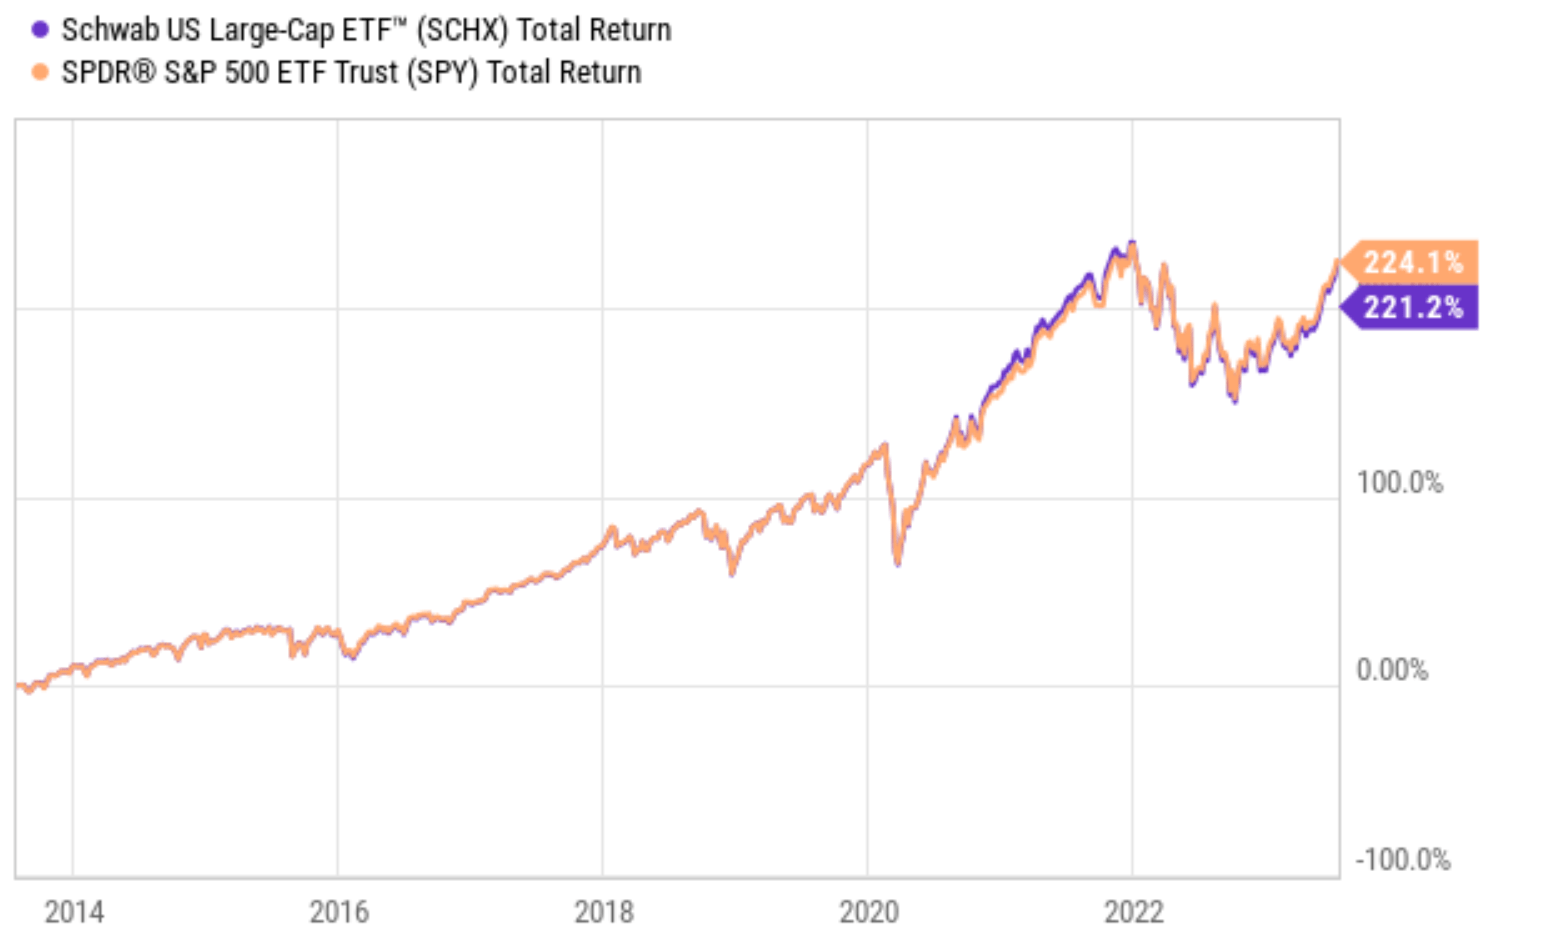
Both the Schwab U.S. Large-Cap ETF ( SCHX ) and SPDR S&P 500 ETF Trust ( SPY ) are popular index funds in the large-cap universe. They are almost identical in terms of their historical performance and risk profiles. For example, in the past ten years, their total return has only differed by about 3% (224% from SPY and 221% from SCHX). Translating into annual returns, the difference is only about 0.2%.
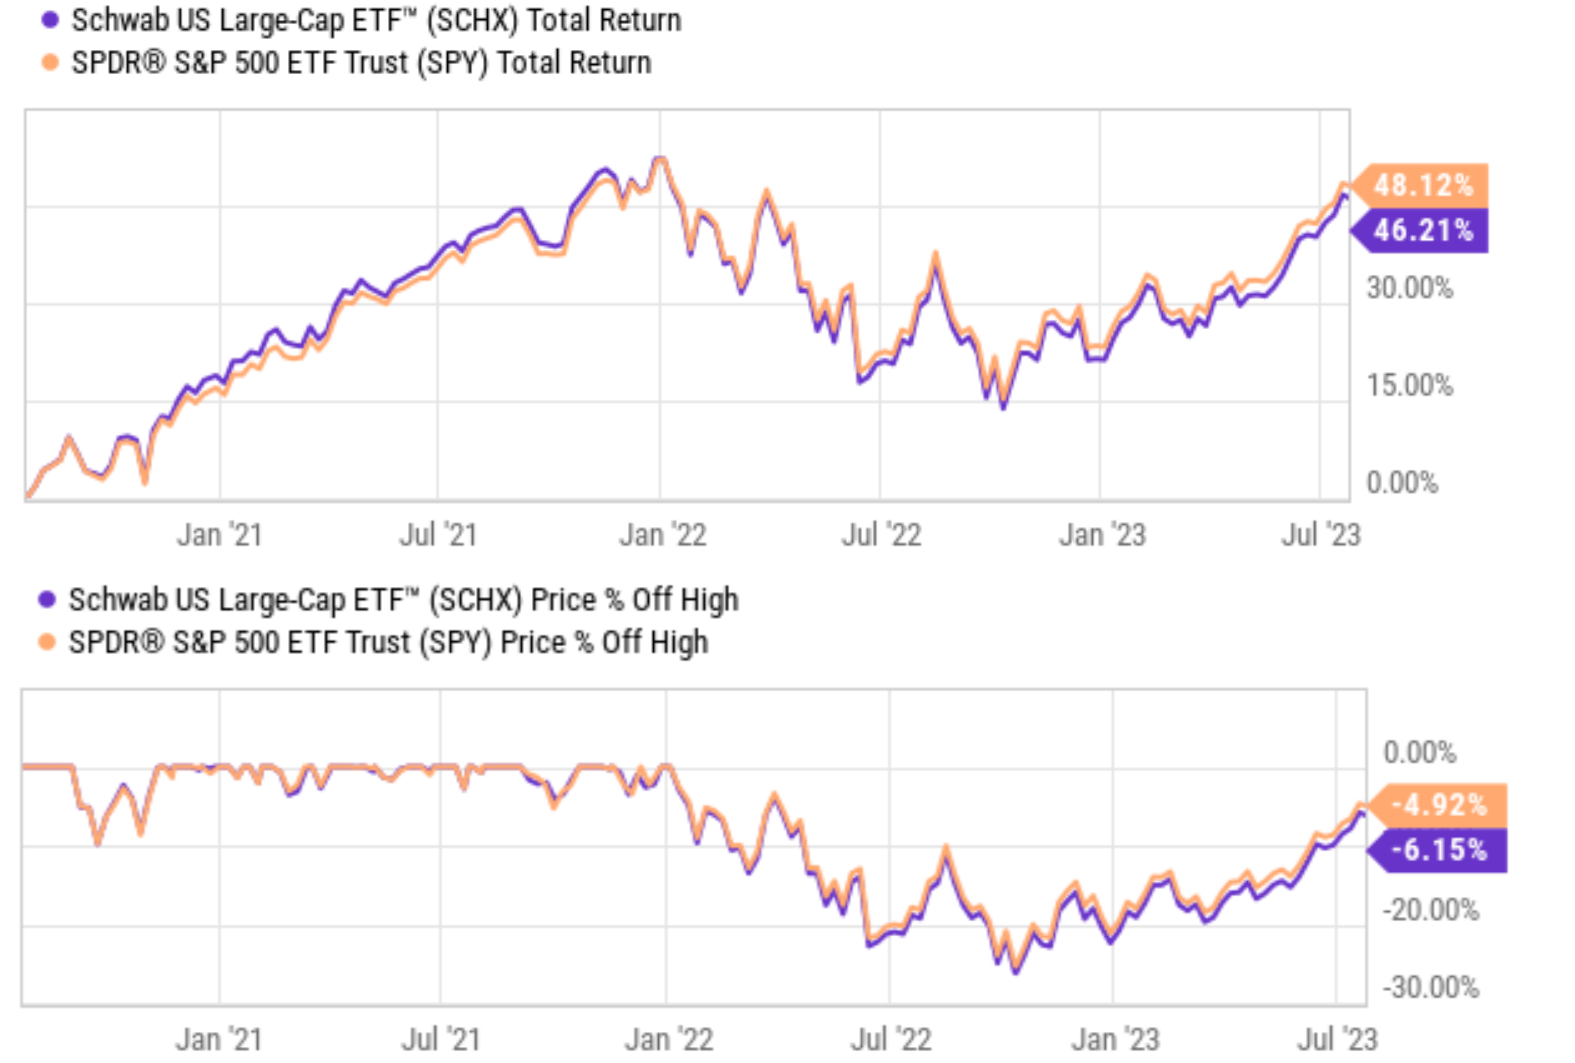
But there have been times when these funds diverged significantly. And this is the case now as seen from the chart below. During the market volatilities (both downward and upward) in the past few years, a sizable divergence has developed between these two funds. As shown in the top panel of the next chart, SPY has outperformed SCHX by about 1.9% over the past 3 years alone. The divergence is also dramatic in terms of off-peak price corrections as seen in the bottom panel of the chart. To wit, SCHX has lost 6.15% off its recent peak, compared to SPY's 4.92%, translating into a divergence of more than 1.2%, which is significant (say compared to the 0.2% average annual difference mentioned above).
The remainder of this article will explore the reasons for this divergence and discuss why it suggests a hiding place for investors as SPY’s valuation approaches an alarming level in my view.
SCHX vs SPY: basic information
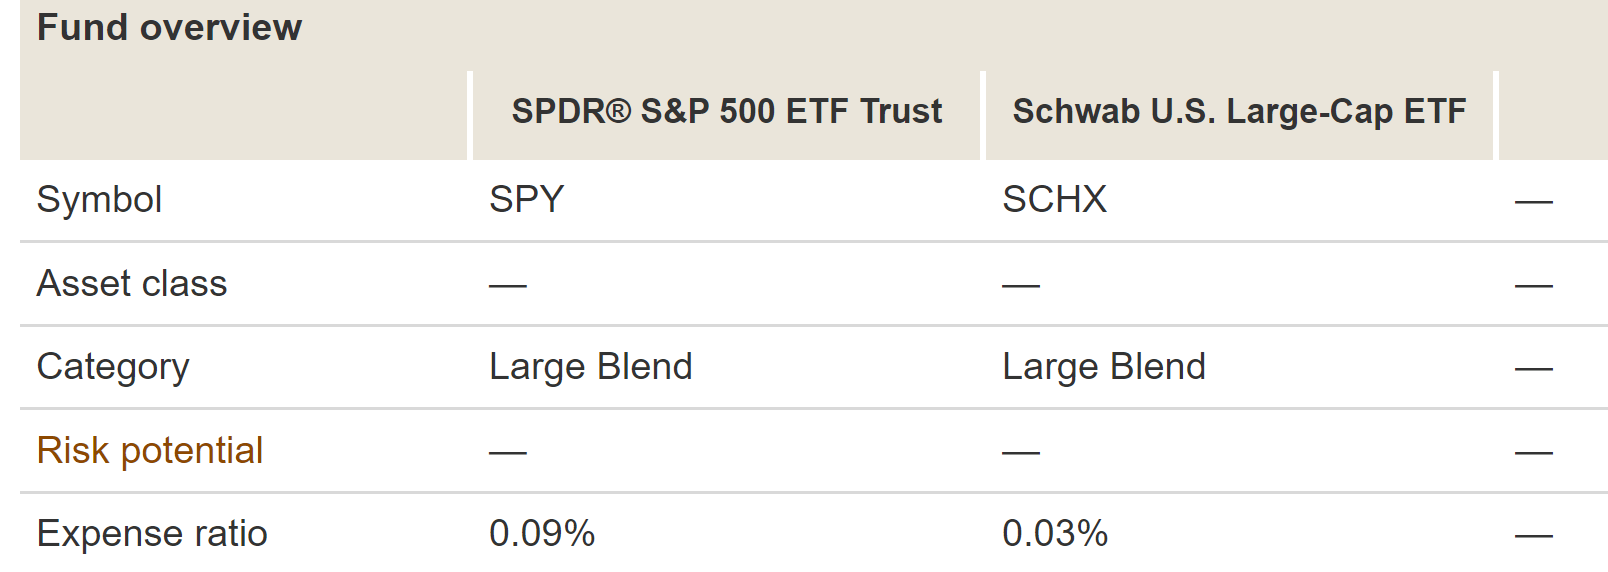
Before proceeding further, let me quickly introduce both funds. SPY needs little introduction and is a good approximation of the S&P 500 index itself. Here I will just focus the introduction on SCHX. SCHX aims to track the Dow Jones U.S. Large-Cap Total Stock Market Index. Compared to SPY’s ~500 holdings, SCHX holds ~750 stocks. More specially, as introduced in the fund description:
SCHX’s goal is to track as closely as possible, before fees and expenses, the total return of the Dow Jones U.S. Large-Cap Total Stock Market Index. The fund offers simple access to the 750 largest U.S. companies as ranked by full market capitalization.
Also, it is worth noting that SCHX features an even lower expense ratio (0.03%) compared to SPY’s 0.09%. In return, SPY investors get to enjoy its larger size, better liquidity, and also tighter trading spread. SPY is a much larger fund (one of the largest in fact) and has more than 10 times the assets under management (“AUM”) compared to SCHX. The average trading spread for SPY is essentially zero, while SCHX's average trading spread is on average 0.02%.
SCHX vs SPY: a closer examination of the divergence
In this section, I will explain why the divergence between SPY and SCHX developed in the recent 2~3 years is a significant event, even though it may seem small at first glance. A good way to put this into perspective is again to compare it to the average annual difference of 0.02% in the past decade.
Then the next logical question is what this divergence signifies. In my view, the divergence between SPY and SCHX was caused by a valuation divergence. To be more specific, SPY is now priced at a sizable valuation premium over SCHX which is difficult for me to justify.
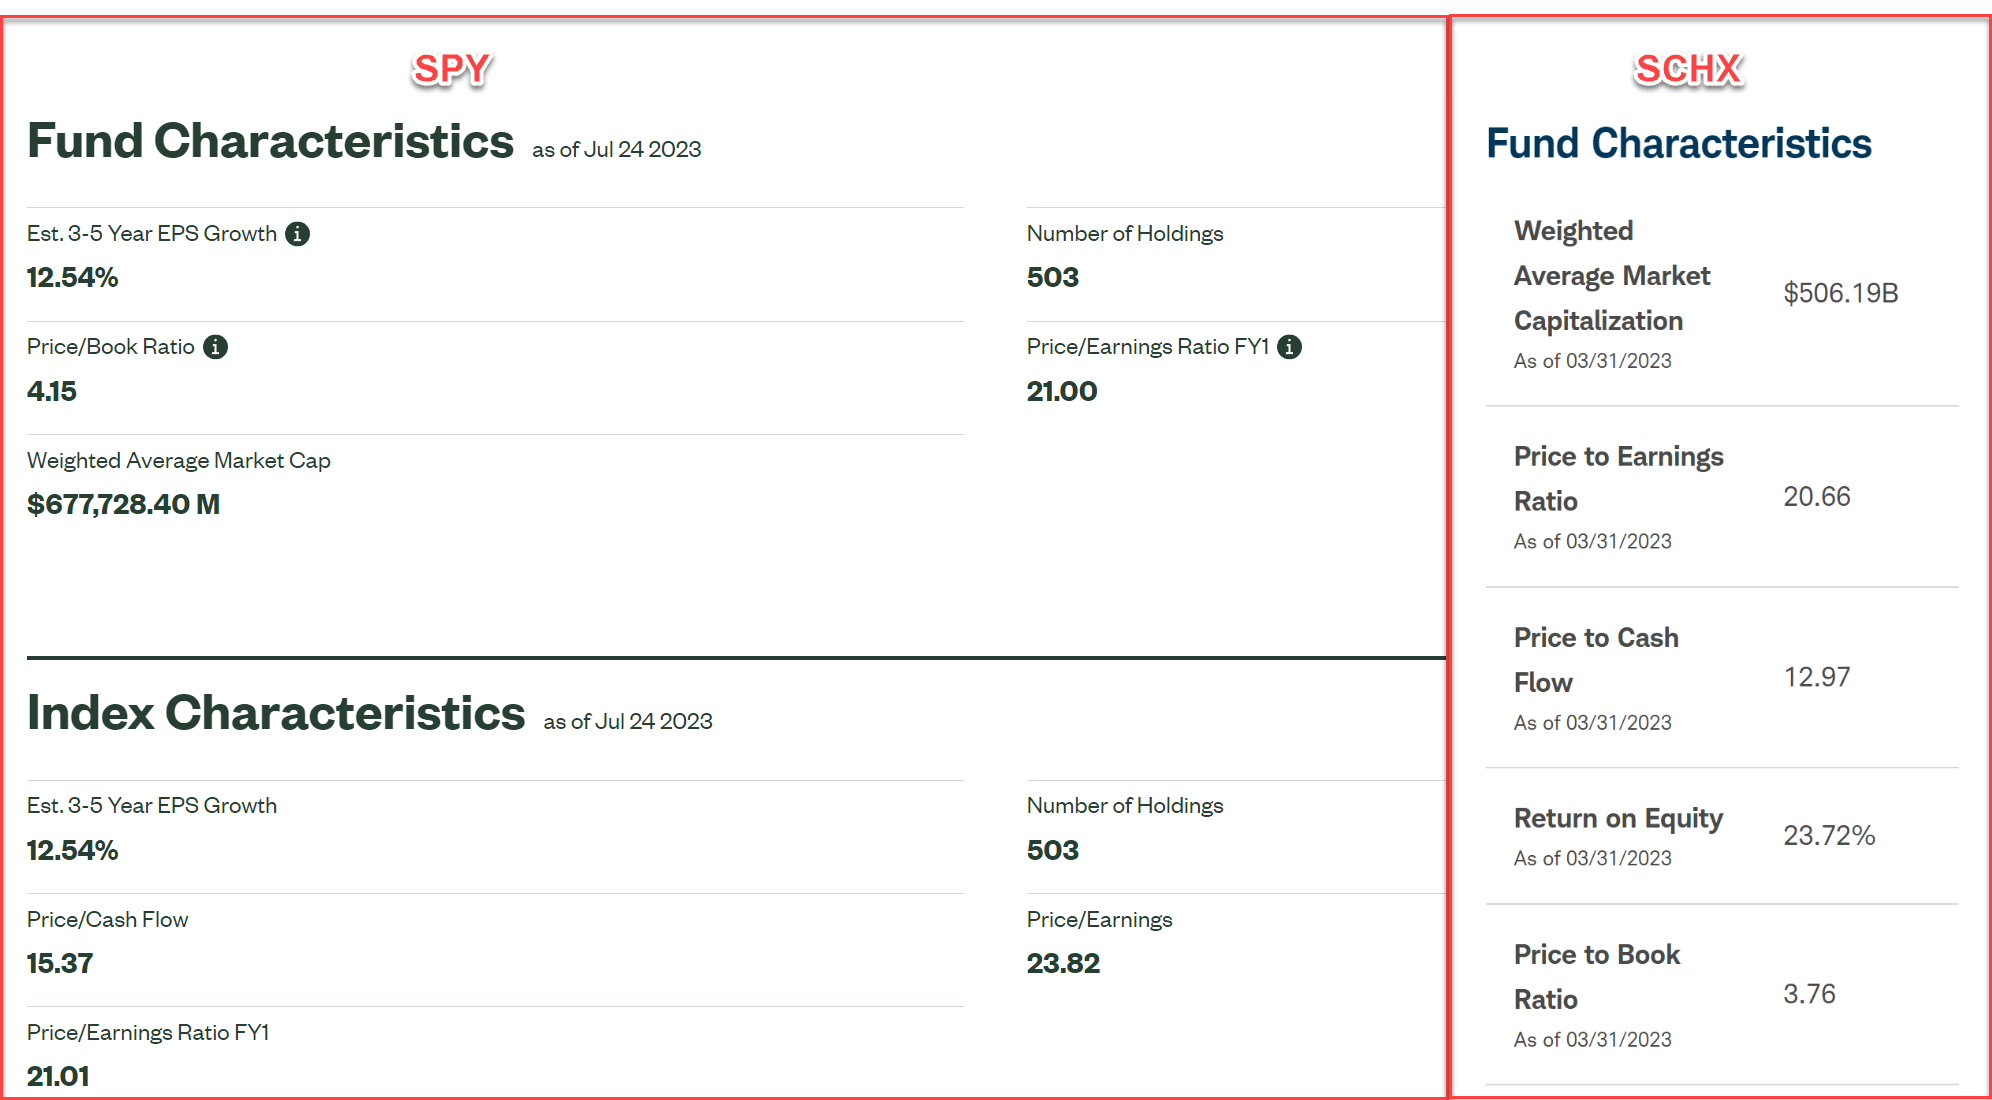
The next chart compares their valuations as measured by price-to-earnings (“P/E”) and price-to-book (“P/B”) ratios. As of this writing, SCHX's P/B ratio is 3.76x as seen, while SPY's P/B ratio is 4.15x. This means that SCHX is trading at a discount of about 10% to SPY on a P/B basis. In terms of the P/E ratio, the discount is even larger. SCHX's P/E ratio is 20.66x, while SPY's P/E ratio is 23.82x as reported by their fund webpage. This means that SCHX is trading at a sizable discount of about 12% to SPY on a P/E basis.
There could be a few possible reasons for this valuation divergence. One possibility is that investors are becoming more risk-averse, and they are therefore preferring to invest in the more liquid and well-known SPY. Another possibility is that investors are expecting the earnings of SCHX to grow at a slower pace than SPY.
Next, I will explain why neither reason makes sense to me.
Why SCHX is a better hiding place?
Let me address the first possible reason mentioned above for SPY’s valuation premium briefly. Essentially, I view the holdings in both SPY and SCHX to be sufficiently large and mature companies. As seen from the chart above, the weighted average market cap for SPY’s holdings is $677 billion and that of SCHX is $506 billion. Both are large enough and I don't see the larger (comparatively) holdings in SPY offering additional safety in any meaningful way.
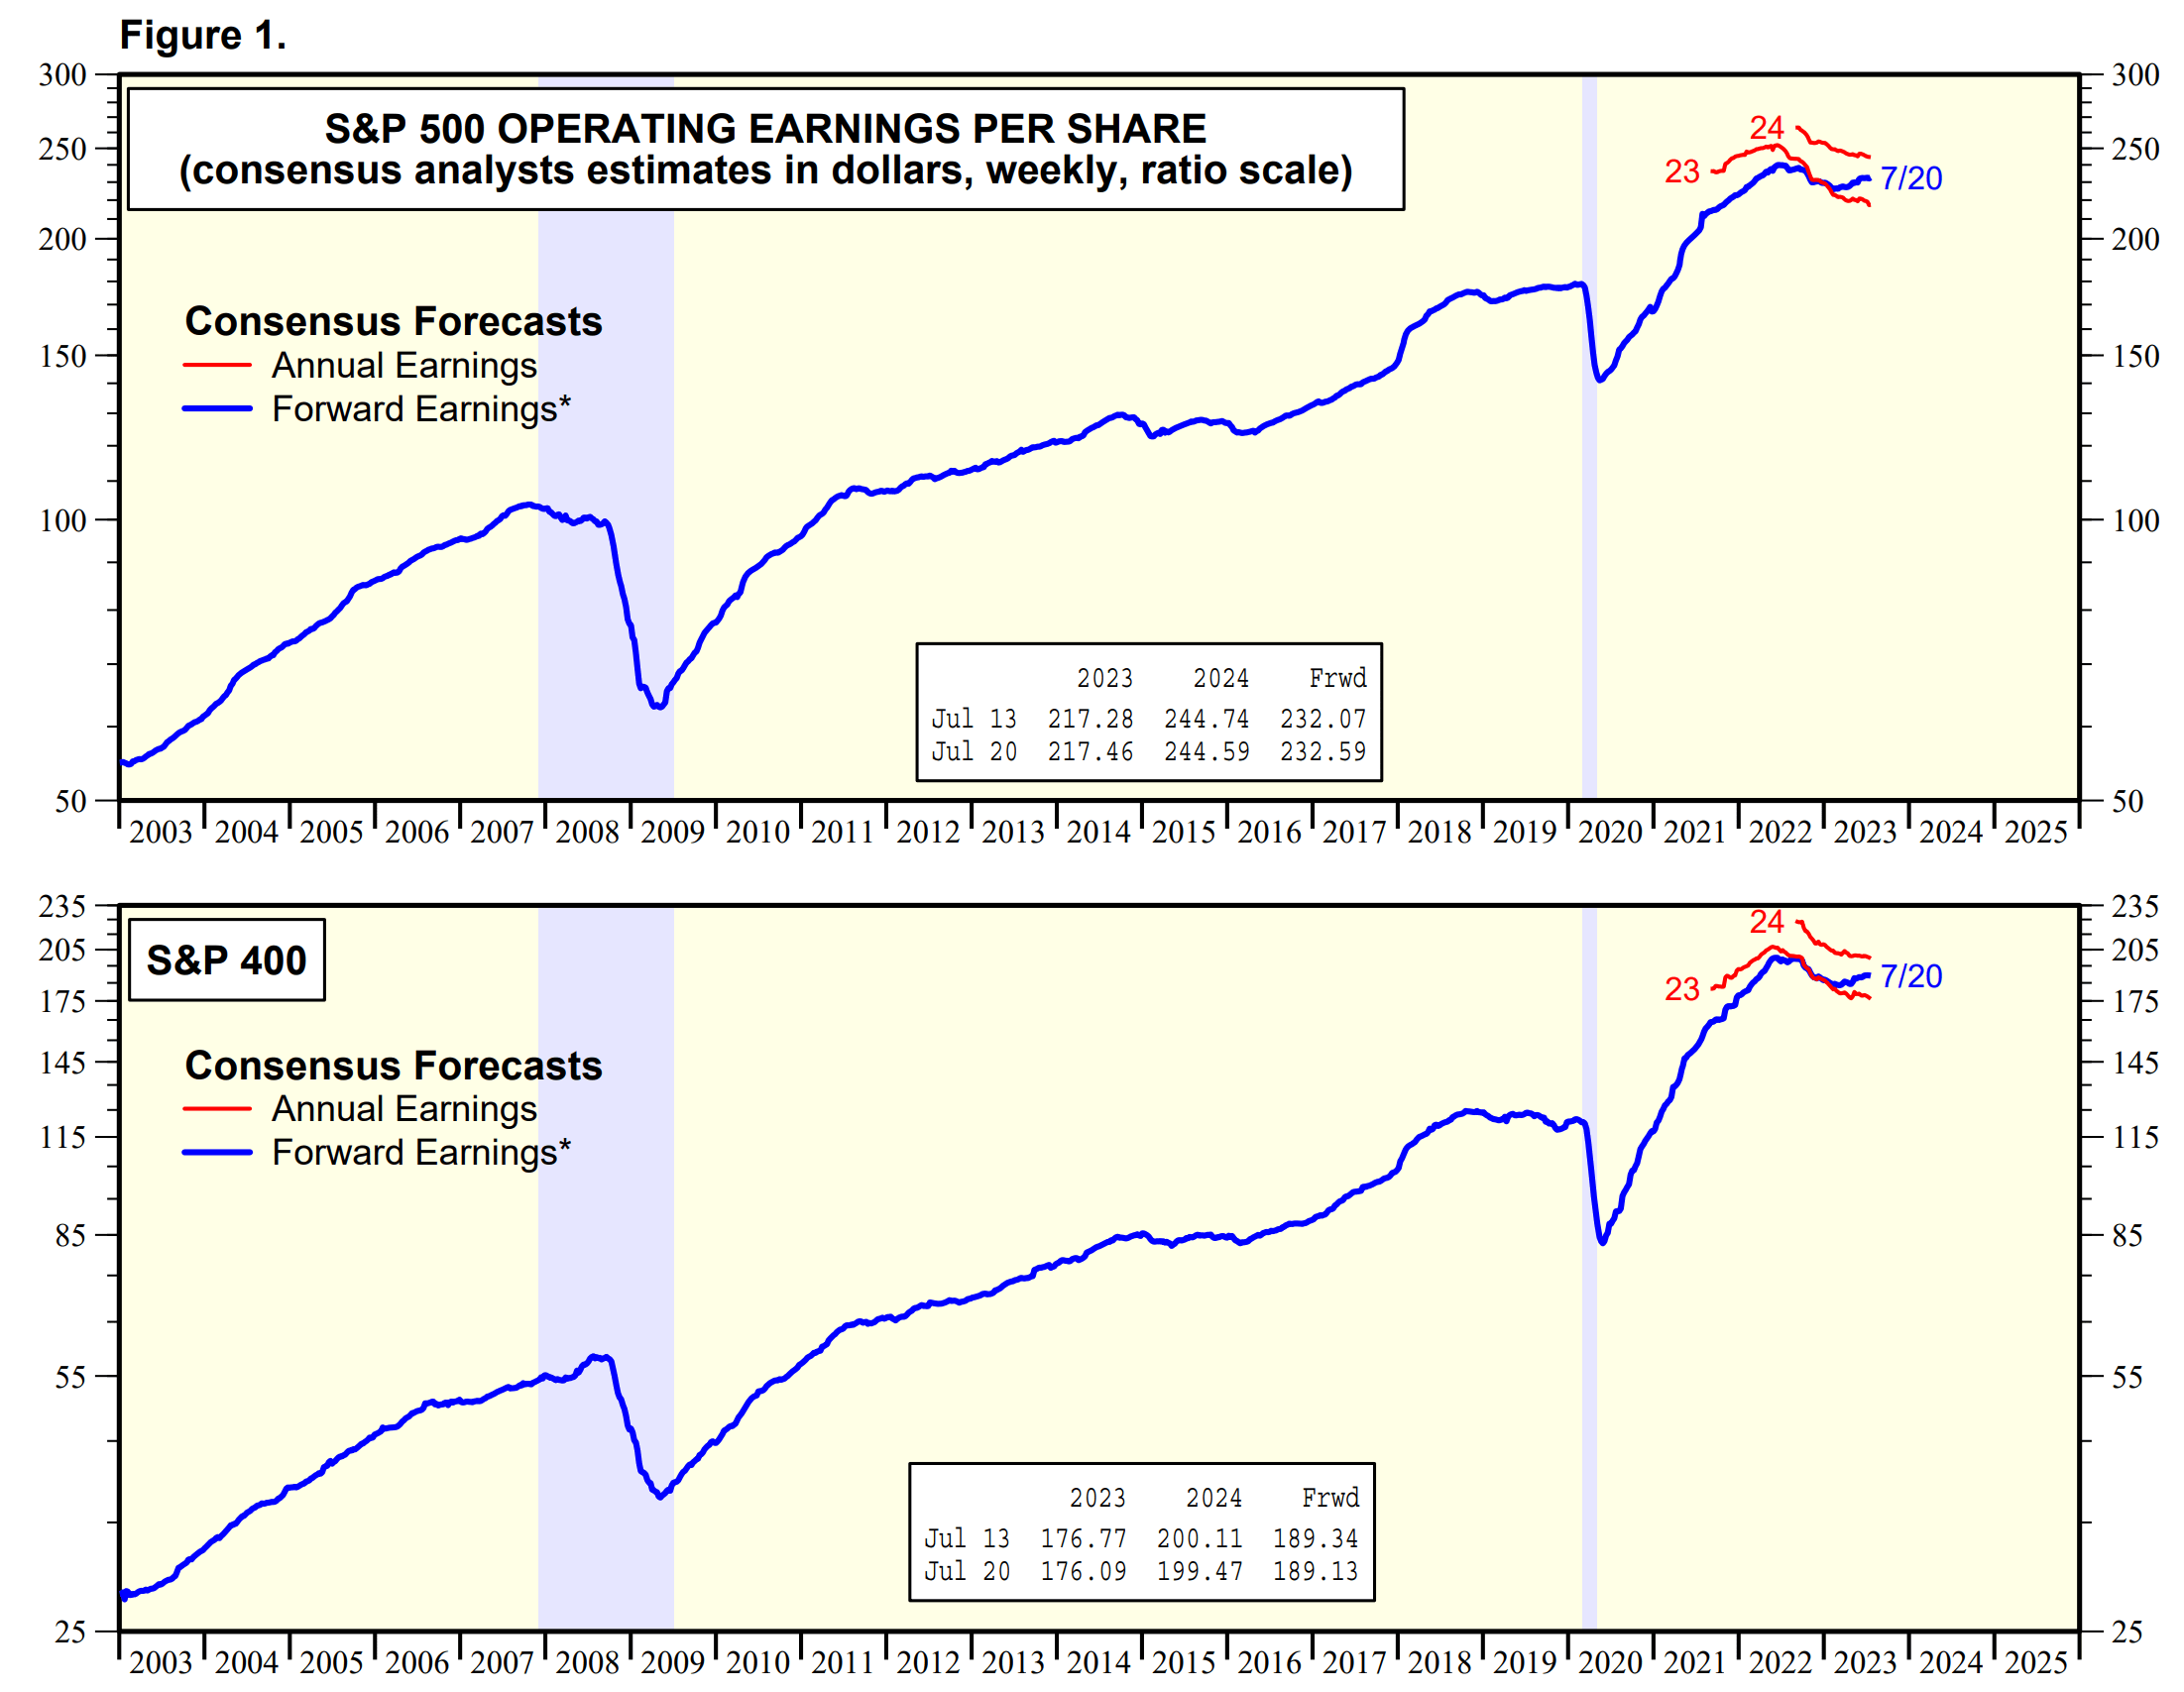
Now, let me concentrate the remainder of this section on the growth perspective. I will argue that despite SPY’s valuation premium, the holdings in SPY actually have a worse growth prospects than those in SCHX. As seen in the next chart, the earnings growth rate is projected to be 12.4% for SPY as seen, from $217 per share in 2023 to $244 per share in 2024.
As aforementioned, the difference between SPY and SCHX is that there are ~250 extra holdings in SCHX. And by the S&P 500’s standard for “large caps”, these 250 extra holdings in SCHX are mid-caps. As such, I will use the S&P 400 mid-cap earnings forecast (shown in the bottom panel of the chart below) to approximate the growth rate of the ~250 extra holdings in SCHX. As seen, earnings from these mid-cap stocks are projected to grow at a rate of 13.6%, from $176 per share in 2023 to $199 per share in 2024, higher than the ~500 large caps held in SPY.
Other considerations and some actionable ideas
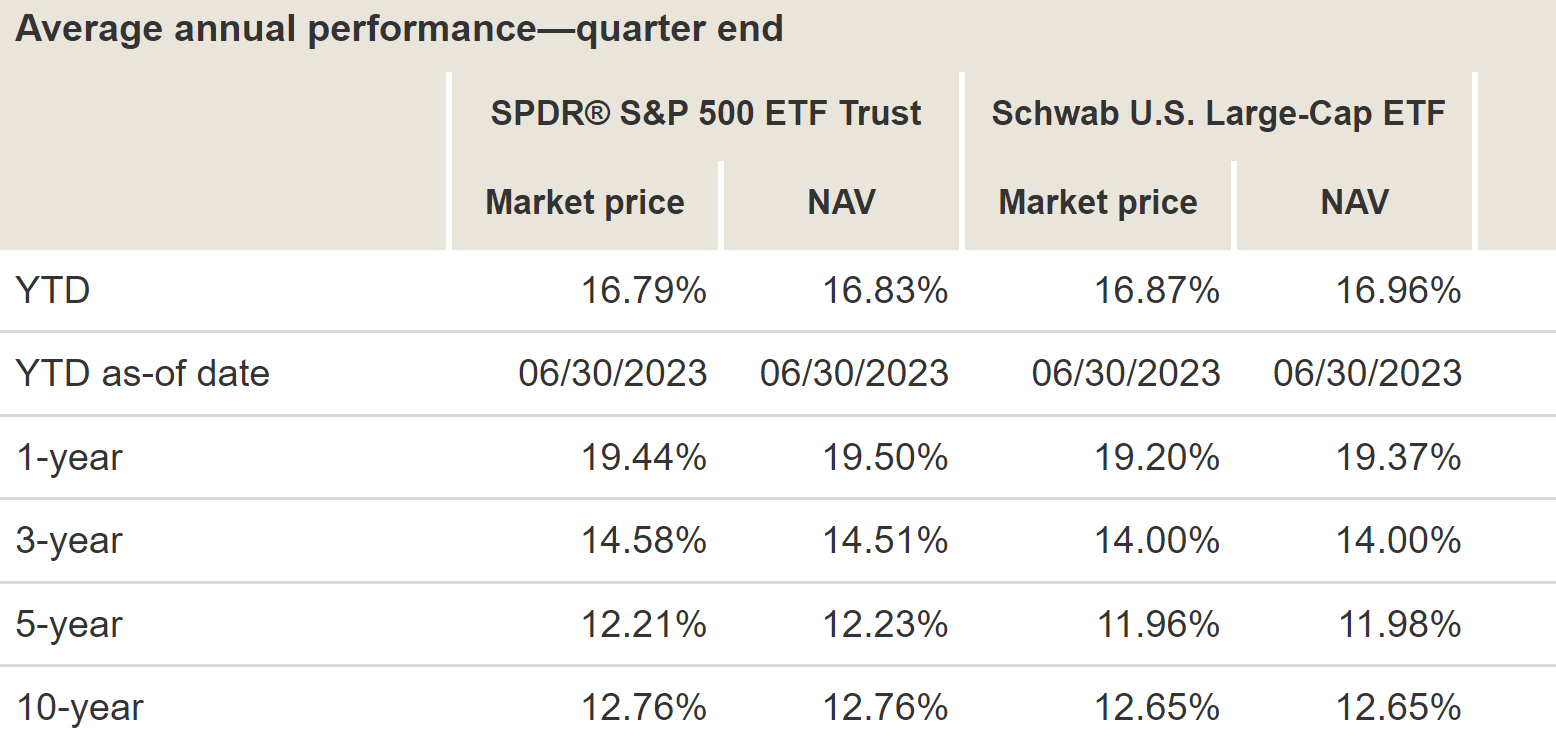
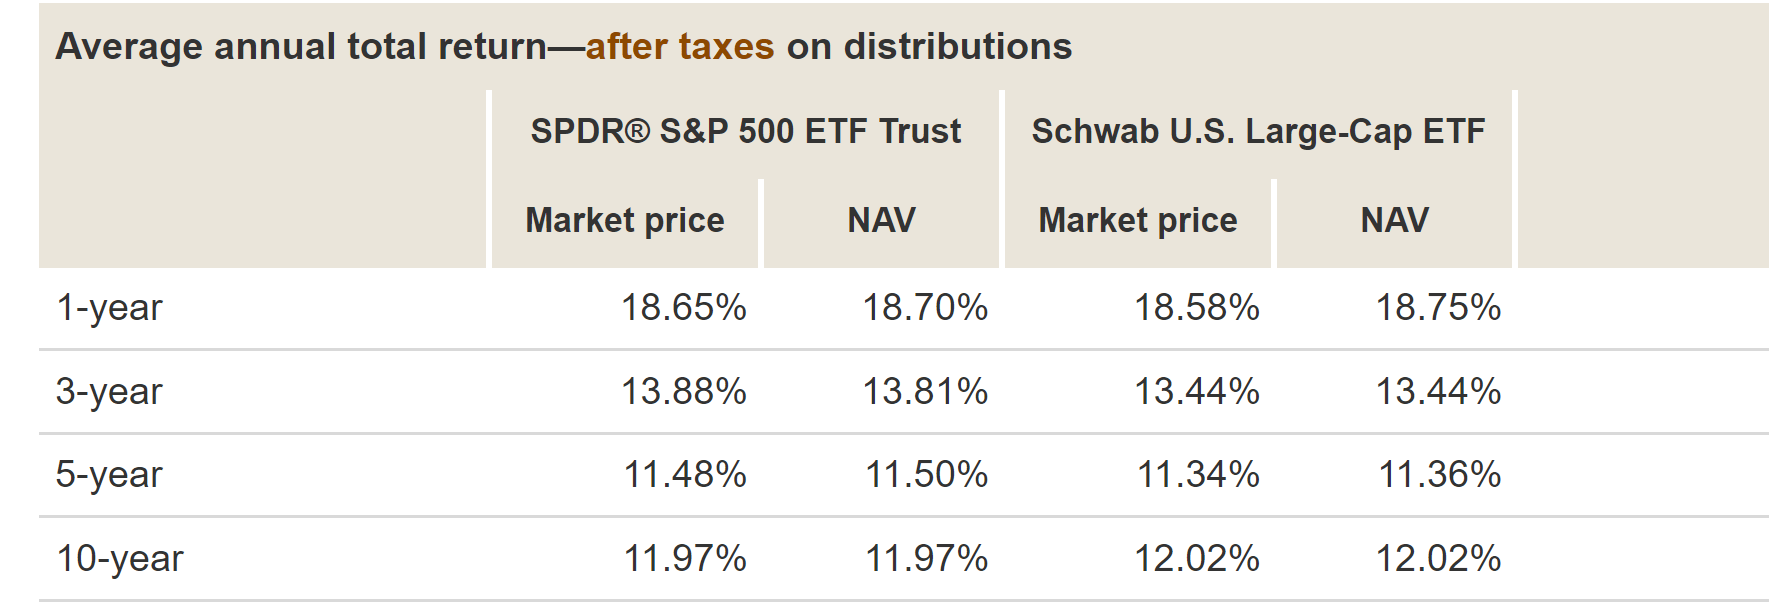
Besides well-diversified holdings and a more attractive valuation, SCHX is also more tax-efficient than SPY as an index fund. This means that SCHX generates fewer taxable events, which can help to reduce the overall tax burden on investors. As an example, the chart below shows that SPY's outperformance (small to start with in the long run) over SCHX in the past has been further offset by the tax drag on SPY. On a 10-year basis, SPY's average annual return after taxes was actually lower than SCHX's. To wit, after taxes are considered, SPY delivered an annual return of 11.97% per annum over the past 10 years. In contrast, SCHX delivered 12.02%.
Based on the above analysis, here are a few actionable ideas. Of course, investors could hold SCHX instead of SPY. After all, the whole point I am trying to make so far is that SCHX is a more attractive fund under current conditions. It is trading at a substantial discount to SPY, and its holdings have better growth prospects.
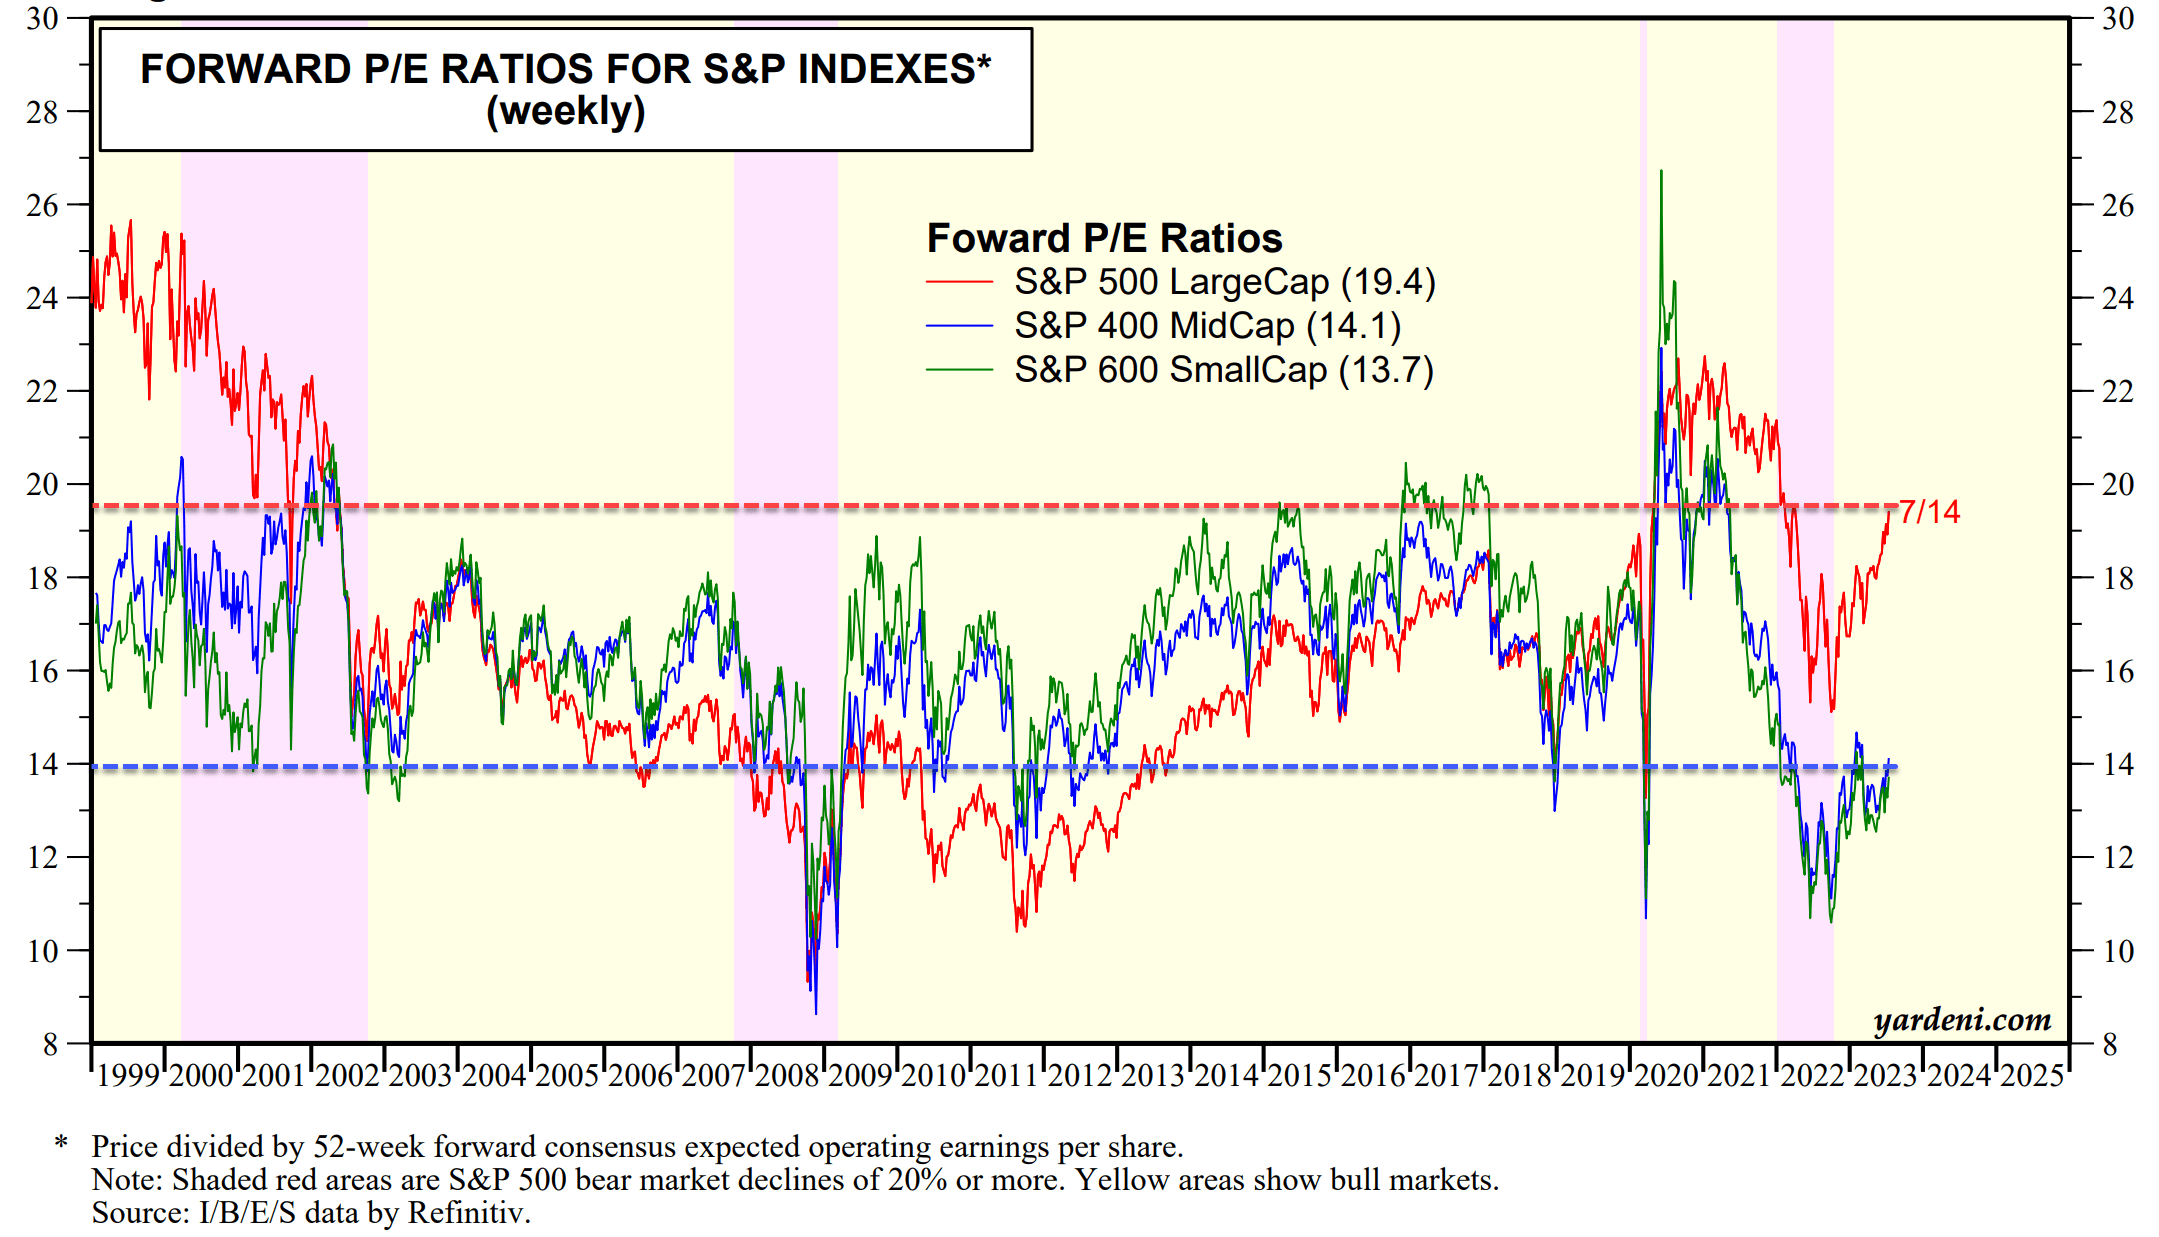
The divergence between SPY and SCHX also shows that investors who are looking for more aggressive exposure could consider more concentrated holdings of mid-cap stocks. Some example ideas include mid-cap sector funds such as VO or SCHM. The S&P 400 mid-cap index is currently valued at a significant discount to the S&P 500 large-cap index as shown in the chart below. Currently, the mid-cap sector is valued at 14.1x FWD P/E. And this is a level that is very attractive in my view in the long term. As seen, the S&P 400 mid-cap index has only been valued at this level a few times in the past. These are the valuations that only occurred during extreme market conditions such as the 2011 European financial crisis and also the 2018 market corrections. In contrast, the P/E ratio of SPY is near a historical peak, higher than those leading to the 2008 financial crisis and comparable to the levels right before tech bubble burst in 2002.
Risks and final thoughts
To recap, SCHX and SPY are similar to a good extent and the majority of their holdings overlap. Thus, they share many of the same risks. These risks include macroeconomic risks such as inflation, interest rates, and economic growth. However, the main risk that is specific to SCHX is its larger exposure to mid-cap stocks by the SP500 standard. Mid-cap stocks can be more volatile than large-cap stocks and suffer large swings in price during market turmoil. And also as aforementioned, SCHX is a less liquid fund relative to SPY given its small size and lower trading volume.
Although my conclusion is that the potential positives easily outweigh these potential negatives, especially for long-term investors. To recap, my main considerations include SCHX’s more attractive valuation, better growth forecasts, and tax efficiency. Finally, the valuation divergence is so large that it is worthwhile to consider a concentrated bet on a mid-cap fund for more aggressive investors.
For further details see:
The SCHX-SPY Divergence Suggests A Hiding Place