UGI - UGI: A Long Term Buy Despite Weak Fundamentals
2023-10-18 23:20:35 ET
Summary
- UGI Corporation's Q3 2023 financial report shows a decline in GAAP diluted EPS and adjusted diluted EPS compared to the previous year.
- The company has announced plans to divest from European markets, signaling a shift in its business strategy.
- The stock price is currently at pivotal long-term support levels and shows indications of a potential turnaround.
UGI Corporation ( UGI ) unveiled a complex financial narrative in Q3 2023 , marked by significant variances in its earnings. This report showcased a decline in both GAAP diluted EPS and adjusted diluted EPS when set against the backdrop of the previous year's figures. Despite the stability in its year-to-date EBIT, the contrasting earnings per share from the past year become discernible. Beyond the mere numbers, the company's decision to divest from European markets signals a crucial shift in its overarching business strategy. This article evaluates UGI's financial and technical standing to identify potential investment prospects for long-term investors. Notably, the stock price is presently at pivotal long-term support levels and exhibits indications of a turnaround.
UGI Corporation's Financial Performance
UGI released its financial results for Q3 2023. In this quarter, UGI reported a GAAP diluted EPS of $(3.76) and an adjusted diluted EPS of $0.00. These numbers show a decline from the prior-year period, wherein the GAAP diluted EPS was $(0.03) and adjusted diluted EPS was $0.06.
When examining the year-to-date performance, the GAAP diluted EPS was reported at $(7.78) and the adjusted diluted EPS was $2.81. This is also in contrast to the prior-year period, which saw a GAAP diluted EPS of $3.84 and an adjusted diluted EPS of $2.90. However, the year-to-date EBIT for the company's reportable segments remained almost consistent at $1,076 million, a slight drop from $1,079 million in the previous year. The company also highlighted its robust liquidity at approximately $1.8 billion as of June 2023. The chart below illustrates the annual revenues and net income. Notably, UGI reported a loss of ($789) million in Q3 2023. However, the general trajectory for long-term revenue and net income is still positive. The cumulative net income for the year ending June 30, 2023, is $1,354 million.
Strategically, UGI announced definitive agreements to divest its natural gas and power marketing business in Belgium, expected to conclude by the end of fiscal 2023. Additionally, UGI is set to clear specific natural gas and power marketing portfolios in France and the wind and solar portfolio in the Netherlands by the first and second quarters of fiscal 2024, respectively.
Roger Perreault, President and CEO of UGI Corporation, emphasized the company's commitment to strategic execution and enhancing financial flexibility. The quarter saw a reduction in total debt at AmeriGas and a move to divest a significant portion of the non-core European energy marketing businesses. Despite the higher gas rates, customer growth, and other positive factors, the adjusted earnings suffered due to increased operational and administrative expenses across all reportable segments. Given the performance during the first nine months and expectations for Q4, the fiscal 2023 adjusted diluted EPS is projected to lie at the lower end of the $2.75 to $2.90 guidance range.
In the recent segment-wise performance breakdown for UGI Corporation, AmeriGas Propane experienced a $2 million rise in EBIT, credited to better LPG unit margins. However, this was somewhat counterbalanced by escalated operational and administrative expenditures, notably in areas like employee compensation, advertising, and vehicular costs. UGI International faced a $4 million dip in EBIT, mainly due to a drop in margins from non-core energy marketing operations and inflation-induced operational costs, mitigated partly by heightened LPG margins. The Midstream and Marketing segment recorded a $3 million decrement in EBIT, linked to a decline in capacity management margin. However, this was partly compensated by an uptick in marketing margin and the earnings from the Pennant acquisition. Lastly, the Utilities segment witnessed a $6 million reduction in EBIT, with increased margins counteracted by surging operational and administrative costs.
UGI Corporation is actively enhancing its financial position, focusing on sustainable cost savings, better earnings quality, and strengthening the balance sheet to ensure long-term shareholder value and future earnings growth.
Deciphering Technical Support Indicators for UGI Corporation
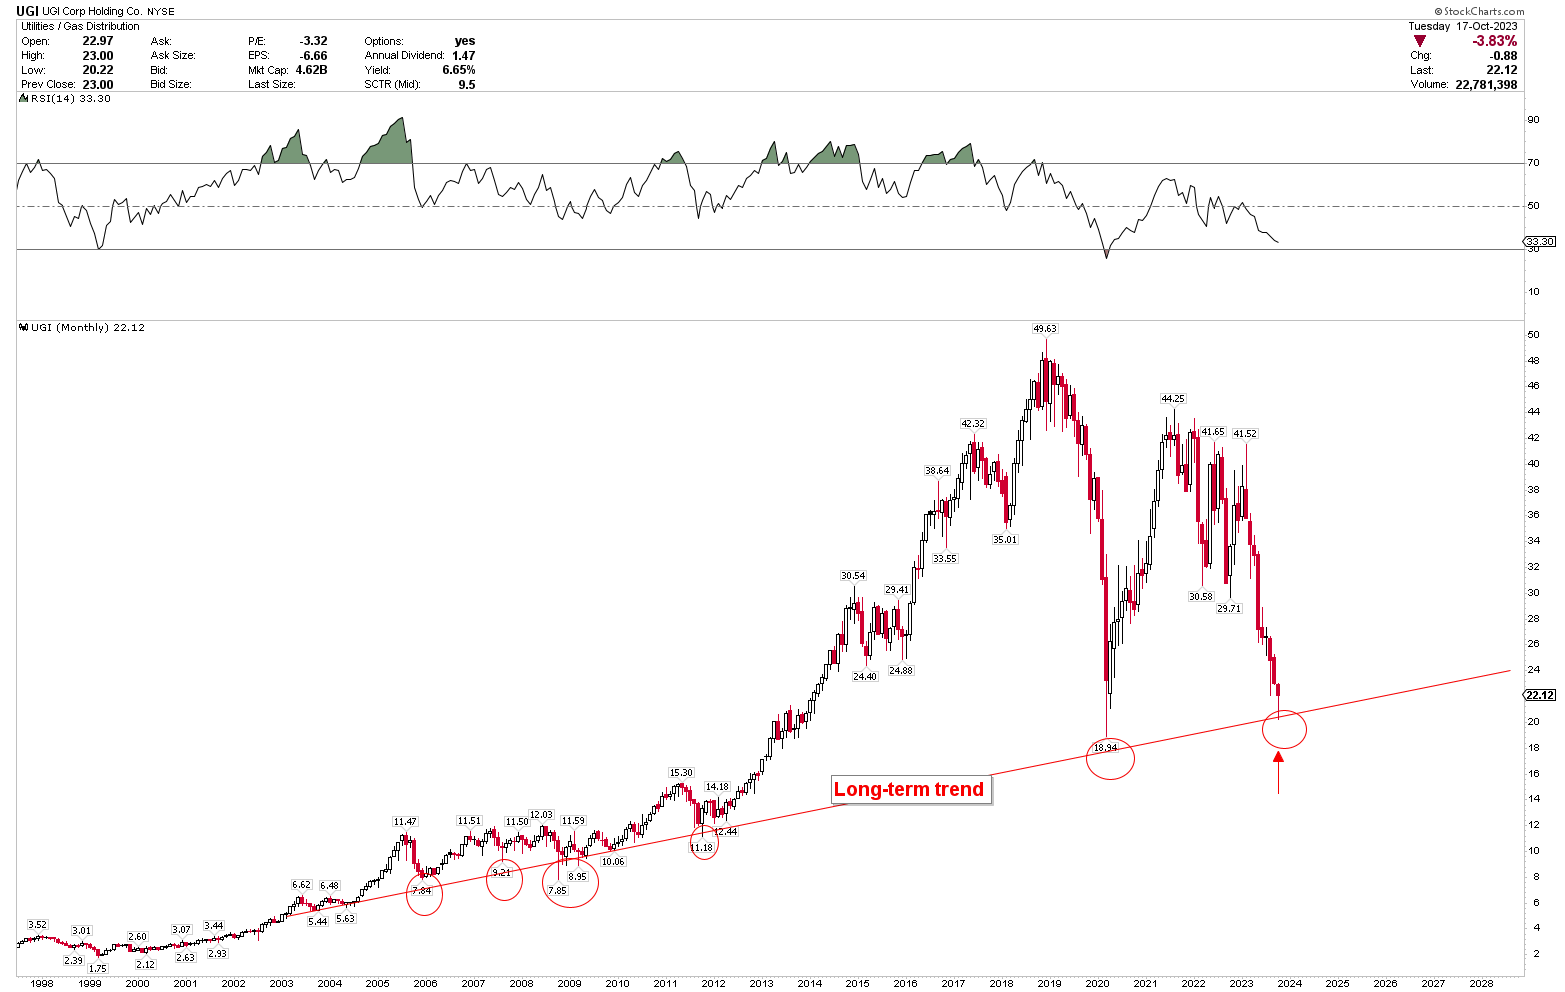
The monthly chart below indicates a positive long-term trajectory for UGI Corporation. This chart presents a long-term trendline spanning from the 2004 lows to its all-time peak. Prices have consistently marked their lows on this line, with a notable surge in momentum after 2011, pushing the price to an all-time high of $49.63. Such a pronounced rise is attributed to significant shifts in the energy sector: oscillating global oil and gas rates, geopolitical disruptions, and legislative alterations, all impacting sector stock values. UGI Corporation's strategic moves, including acquisitions, divestments, and diversifying its portfolio, added layers of intricacy to its stock performance. Factors such as UGI's intermittent earnings, market shifts, and broader economic indicators further amplified these fluctuations. Additionally, UGI's expansion into global markets and responsiveness to changing energy dynamics heightened stock price volatility.
UGI Monthly Chart (stockcharts.com)
Nevertheless, prices peaked robustly at $49.63 before retreating towards the foundational trend set in 2004. This significant dip resembles a robust market, mirroring previous corrections after the steep climbs between 2012 and 2018. Currently, the stock stands at a formidable support level, hinting at a potential bounce back. The upcoming October monthly candle suggests an upward shift. Concurrently, the RSI is nearing an oversold state.
For a more detailed perspective, the weekly chart below showcases considerable price volatility. A strong recovery at these levels produced an inside bar last week, poised to be surpassed this week. Yet, the weekly chart's reversal doesn't firmly confirm that the bottom is hit, mainly due to high volatility, which distorts traditional patterns, making price forecasts trickier. It's also evident from the weekly chart that the price is nearing an oversold state, anticipating a robust recovery.
UGI Weekly Chart (stockcharts.com)
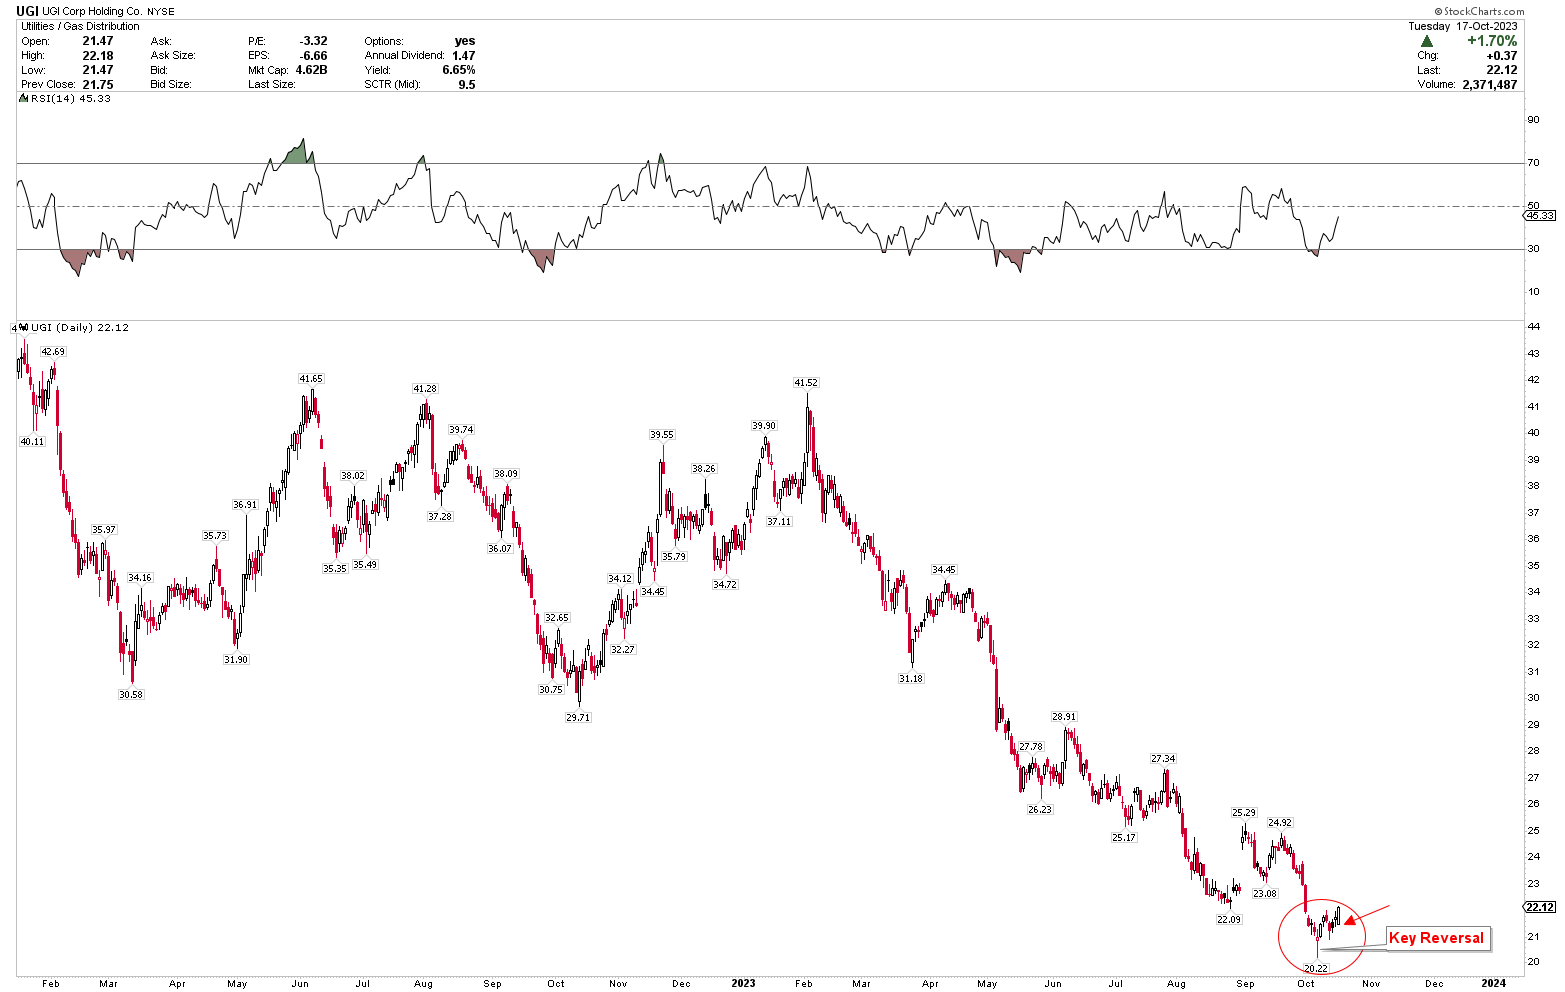
A resurgence of bullish activity is evident upon examining the daily chart closely. A reversal candle at a low of $20.22 indicates potential upward market shifts. Even though the dominant trend leans towards a decline, this significant reversal at a well-established support level hints at possible upcoming rises. It's conceivable that prices may find balance at this support level before embarking on a pronounced upward surge.
UGI Daily Chart (stockcharts.com)
Market Risk
There's been a noticeable decline in earnings, both in GAAP diluted EPS and adjusted diluted EPS, year over year. This downturn is compounded by heightened operational and administrative costs across all business segments, including increases in employee compensation, advertising, and vehicular expenditures.
While UGI boasts a robust liquidity position at $1.8 billion, signaling financial resilience, its decision to divest from specific European markets, although strategic, could affect short-term revenues. The challenges extend to segmental performances, with several of UGI's divisions, such as UGI International and Utilities, reporting reduced EBIT.
Moreover, the technical analysis suggests that the company might be approaching a turnaround. The long-term trajectory for UGI remains encouraging, with stock prices indicating consistent growth since 2004. However, recent volatility, mainly seen in the weekly chart, might deter short-term investors. A monthly close below $18.94 could disrupt the long-term trend, potentially leading to a significant price decline.
Bottom Line
UGI Corporation experienced a turbulent third quarter in 2023, marked by a decline in its GAAP diluted EPS and adjusted diluted EPS compared to the previous year. Although the year-to-date EBIT remained relatively stable, significant variances in earnings paint a nuanced financial story. UGI's decision to divest from specific European markets signifies a pivotal change in its business trajectory. Positive indicators, such as rising gas prices and an expanding customer base, are counterbalanced by increased operational costs across all segments. This upward pressure on expenses, combined with lower-than-expected earnings, has raised concerns about UGI's short-term financial outlook despite the firm's robust liquidity position.
Despite facing hurdles, the stock price has reached robust long-term support and is displaying indications of an upward momentum. The stock returns from its long-term trend line, and daily charts suggest price stability. Investors may consider buying at the current price point, as it seems to be settling and has potential for future growth. Should the price decrease further, investors can consider increasing their holdings, provided the price remains above $18.94 on a monthly closing basis.
For further details see:
UGI: A Long Term Buy Despite Weak Fundamentals