UNP - Union Pacific: Fundamentals Under Cyclical Pressure
2023-12-30 08:15:46 ET
Summary
- The US rail freight sector is mature and cyclical.
- Volumes and margins have been declining across the sector for at least the last 4 quarters.
- In August FY23, following pressure from an activist shareholder for improved performance, Union Pacific's board in fired its long-serving CEO.
- The decline in volumes and margins may be signalling an economic slowdown which can severely impact cyclical stock prices.
Annual Update
Union Pacific is a long-term member of my investing universe. I last wrote about the company and provided an intrinsic valuation about a year ago ( Union Pacific Stock: Intrinsic Value Update ).
This article updates the key sector statistics, provides a valuation update and an investing recommendation.
Rail Sector Overview
The US rail freight sector now has only 6 Class 1 companies (Class 1 is defined as a company with revenues greater than $250 M) following the recent merger between Kansas City Southern and Canadian Pacific ( CP ) .
I estimate that in FY2022, the Class 1 railroads had a combined operating revenue of $98 Billion and accounted for 94% of all freight revenues (there are other smaller railroads which connect to the main networks which account for the remainder of the freight task).
The largest railroad company in the US is BNSF (a division of Berkshire Hathaway) and Union Pacific ( UNP ) is the largest standalone railroad by market capitalization.
The US rail freight networks are for the most part privately owned and due to the limited overlaps between networks there is only marginal competition between railroads. There is some customer shifting between companies, but this generally only occurs when the customer is located close to both networks.
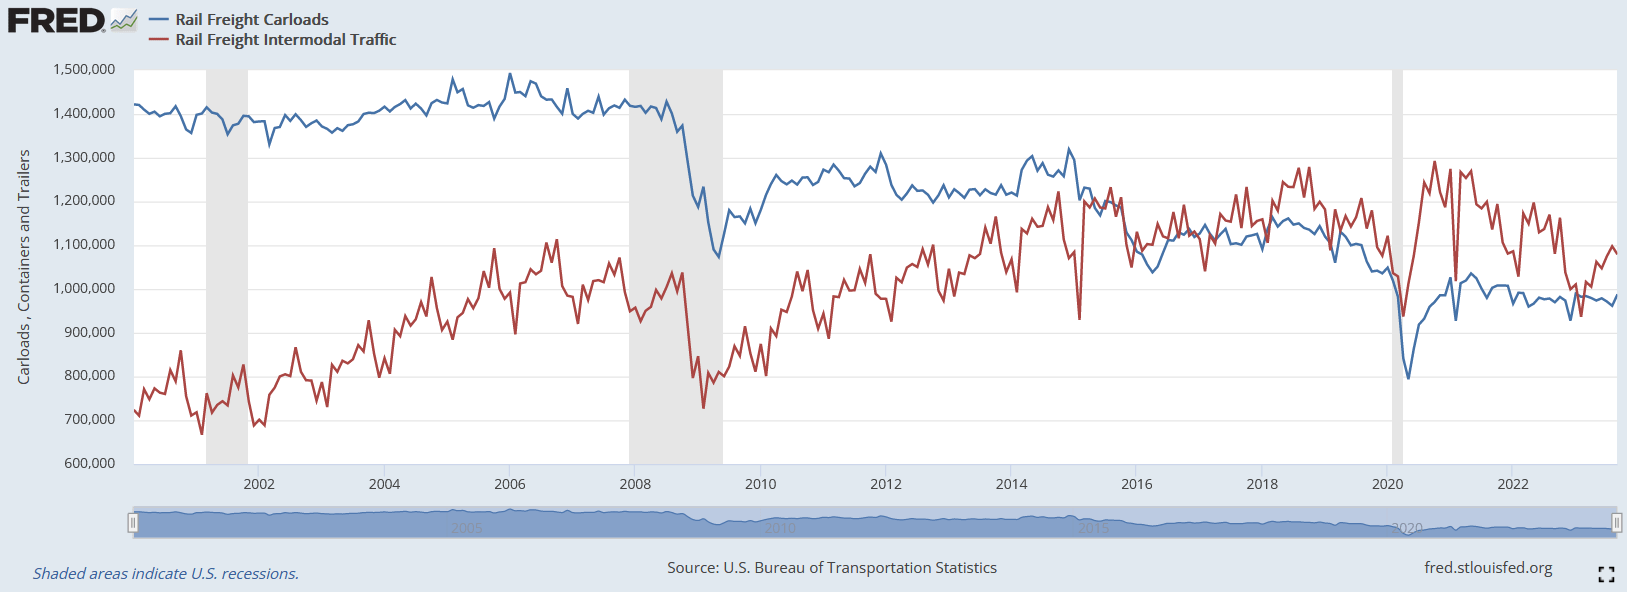
The rail freight task has two components – bulk materials which are measured in carloads and intermodal freight which is measured in container loads. The mature nature of the US rail freight sector can be seen from the following chart which shows the historical size of the rail freight task:
The chart shows that there has been a steady decline in the shipment of bulk materials (particularly coal which has historically been the largest component of the US rail freight task) and this has been partially offset by an increase in container traffic.
The chart also demonstrates the cyclical nature of the sector and the impact that a severe recession such as the global financial crisis and the COVID shutdowns have on volumes.
In my previous article I showed a chart demonstrating that over the last 40 years there has been negligible volume change for most commodities other than coal and intermodal (container).
Pricing Update
The railroads’ main competitor is generally the road network but for some commodities, such as petroleum products, it can also be a pipeline. The road network is not an effective competitor for bulk products such as coal and grain because of the sheer volume involved. Nevertheless, competition from the road network will often influence the prices charged by rail operators.
The total ton-miles is an important measure of activity for transportation companies (particularly railroads) - it calculates the volume of freight carried (tons) by the distance carried (miles).
This chart shows the total ton miles hauled by UNP and the average revenue per ton mile over the same period:
Author's compilation using data from Union Pacific's Fact Book..
The chart shows that UNP’s freight volumes have been steadily declining over time, but it has been securing better prices. Most of the lost volume has come from coal but UNP has been able to maintain volume across other commodities and at the same time raise prices.
After the COVID pandemic disruption most commodity volumes slowly increased back to their pre-COVID levels except for coal and energy volumes.
However, by the end of Q3 FY2022, UNP’s annualized volumes stopped increasing and started to contract. Volumes have now been contracting for the last 4 quarters.
We can establish what has been happening to operating margins over time by charting revenue and costs per billion gross ton miles:
Author's compilation using data from Union Pacific's 10-K filings.
UNP has historically done an outstanding job of increasing unit revenue prices whilst holding costs relatively flat thus expanding margins to levels never seen before in the company’s history.
However, it is concerning that margins appear to have peaked at the end of Q1 FY2022 and have now been declining for the last 6 quarters.
The UNP experience has been a common trend across the entire US Class 1 rail sector as can be seen in the following chart:
Author's compilation using data from company 10-K filings and Surface Transport Board Reports (R-1 filings).
Until FY2021 the entire sector had been able to grow revenues per unit shipment and at the same time improve operating margins but margins across the entire sector began to decline during FY2022 and this trend has continued during FY2023.
Union Pacific’s Strategy
The cornerstone of UNP’s strategy has been the implementation of Precision Scheduling Railroading ('PSR').
PSR focuses on what I term “lean” practices. The idea is to transform the industrial workflows to optimize the inputs to the process – people, materials, and equipment, in order to more profitably meet customer expectations. A key to lean operations is to eliminate waste both in terms of the process inputs but also in the time taken for the process to complete its task.
UNP’s implementation commenced during FY2018 which was significantly later than many of its competitors resulting in some negative investment media attention.
The program ultimately was successful as demonstrated by the “flat lining” of costs on a per unit of gross ton mile basis between FY2018 and FY2021. However, since FY2022 costs have begun to increase ahead of revenues.
UNP’s Board Concerns about Performance
UNP was able to withstand the criticism that it was slow to react to the PSR revolution which swept the sector because of its strong operating profitability and stock price improvement. However, the declining trend in UNP’s margins has prompted a board instigated change in chief executive.
In August, rail sector veteran Jim Vena was appointed Chairman & CEO replacing Lance Fritz who had been in the role for 8 years. Vena has worked at UNP before as chief operating officer from FY2019 to FY2020 and prior to this had spent many years at Canadian National (leaving in 2016).
The executive change was warmly received by investors and the stock price immediately rose but at this stage the financial performance of the company has continued to deteriorate.
Union Pacific’s Historical Financial Performance
Revenues and Operating Margins
The following chart shows UNP’s reported sales and operating margins for the last 10 years:
Author's compilation using data from Union Pacific's 10-K filings.
The chart shows that aggregate revenues have been relatively flat over time but operating margins have increased spectacularly (until recently).
Margins have recently been impacted by rising labor and purchased service costs. Rising fuel costs have also played a role in the margin compression (mainly through timing differences as any major increases in fuel costs are largely recovered directly from customers).
The following chart shows the movement in UNP’s major cost drivers over the last 10 years (the costs are shown as dollars per billion gross ton miles):
Author's compilation using data from Union Pacific's 10-K filings.
The chart shows the significant change in UNP’s operating cost which has taken place over the last 2 years.
Already the fuel component appears to have peaked and is declining but the cost increases across the other cost elements are appearing to be more “sticky”.
Cash Flows
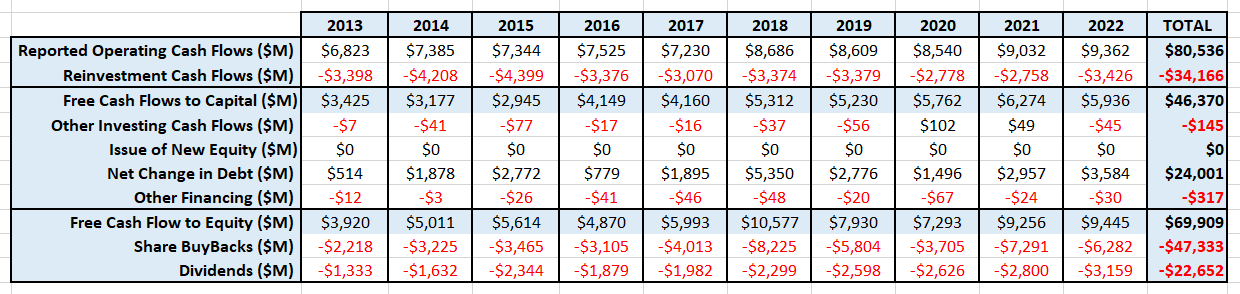
The following table summarizes UNP’s cash flows for the last 10 years:
Author's compilation using data from Union Pacific's 10-K filings.
The data indicates that operating cash flows have increased as UNP’s margins have increased, and the level of reinvestment has been slowly reduced. Consequently, this has led to an increase in free cash flow to capital.
Given that the business is not growing volume, I see very few reasons that UNP would need to significantly increase its rate of reinvestment.
UNP has swapped 51% of the equity generated from retained earnings for debt and this has released nearly $70 billion to shareholders in the form of stock buybacks and dividends.
Dividends have increased each year for the last 17 years. Providing the US economy does not have any major shocks I see no reason, given the large free cash flow, why dividends can’t continue to increase over time.
The quantum of share buybacks will become a balancing item and will fluctuate with the health of the US economy given the cyclical nature of the railway business.
Capital Structure
The following chart shows the history of UNP’s capital structure over the last 10 years:
Author's compilation using data sourced from Union Pacific's 10-K filings.
The chart highlights how UNP has increased the level of debt on its balance sheet but due to a rising share price has managed to keep its debt ratio close to the sector’s median level. The global median debt ratio for the rail sector is currently 23%.
UNP's debt levels are easily supported by its free cash flows, and I have no significant concerns about its capital structure.
Return on Invested Capital
The following chat shows the history of UNP’s return on invested capital over the last 10 years:
Author's compilation using data from Union Pacific's 10-K filings.
Considering that the rail sector is a cyclical commodity-type of business, UNP’s return on invested capital is excellent and suggests that management has created a reasonably strong geographical competitive advantage around the railway’s footprint.
The sector's US returns on capital are higher than global median of 6.3% which serves to highlight the relative market power that US rail companies have been able to build over the years.
My Investment Thesis for Union Pacific
At the time of writing this report we are nearing the end of the 4 th quarter FY2023. At the end of Q3, UNP’s trailing 12-month ('TTM') revenues were $24,140 M (1.2% lower than the prior year) and the TTM operating margin was 37.6% (down from 40.7%).
The current consensus revenue forecast for FY2023 is $23,990 M (this indicates that the business is expected to further contract during Q4) and it is projected that FY2024 revenues will be $24,980 M (4.1% annualized growth).
The current macroeconomic signals for the US economy are mixed. The bond market is forecasting significantly lower inflation and lower interest rates for FY2024. In my opinion this appears to be indicating a slowing economy.
My scenario for Union Pacific is:
Growth Story
The data suggests that the rail sector is mature. Over the long term any significant volume growth is likely to come from intermodal traffic, but this would probably be offset by continued declines in coal volumes.
As a result, I think that there is unlikely to be any volume growth, but revenues will grow each year by the inflation rate (which is currently the consensus revenue forecast for FY2024).
Margin Story
I think that the biggest unknown in this valuation is where the long-term operating margin will finish. Annualized margins peaked in this current economic cycle at the end of Q1 FY2022 at 42.9% and have been falling every quarter since then.
This has been a surprising phenomenon for investors who had been expecting margins to continue moving higher. The rail sector is cyclical and as a result we should expect margins to cycle as well.
If the near-term business environment does not improve then it should not be a surprise if UNP’s margins continue to decline.
My scenario has a mid-cycle operating margin for UNP of between 38% to 42%.
Growth Efficiency
UNP’s reinvestment back into the business peaked back in FY2015 and has averaged $3,200 M per year for the last 7 years.
I measure capital efficiency for growing companies as revenue / invested capital. UNP’s current ratio is 0.59. The global sector’s median is 0.65.
For my scenario I will use the global median ratio.
Risk Story
If the US economy slows down and enters a recession over the coming months, I would expect the rail sector’s volume to significantly decline.
The Federal Reserve data indicates that in the two most recent recessions, rail traffic declined (peak to trough) by approximately 28% during the global financial crisis (FY2008 to FY2009) and 20% during the COVID crisis (FY2019 to FY2020).
UNP’s revenues fell by 21% during the GFC and 15% during COVID.
UNP will be entering this part of the economic cycle with a strong balance sheet and a level of debt close to the sector average. For these reasons I estimate that UNP’s cost of capital will be lower than the typical US listed company due to the relatively low volatility of its stock price.
Competitive Advantages
UNP’s operating model is pitched as being an efficient and relatively low-cost rail freight logistics supplier.
UNP’s operating margins are slightly higher than its US and Canadian rivals and its return on invested capital is similarly higher. There is reasonable evidence to suggest that UNP has a sustainable competitive advantage which will allow its terminal ROIC to remain above its cost of capital at around 12%.
Valuation Assumptions
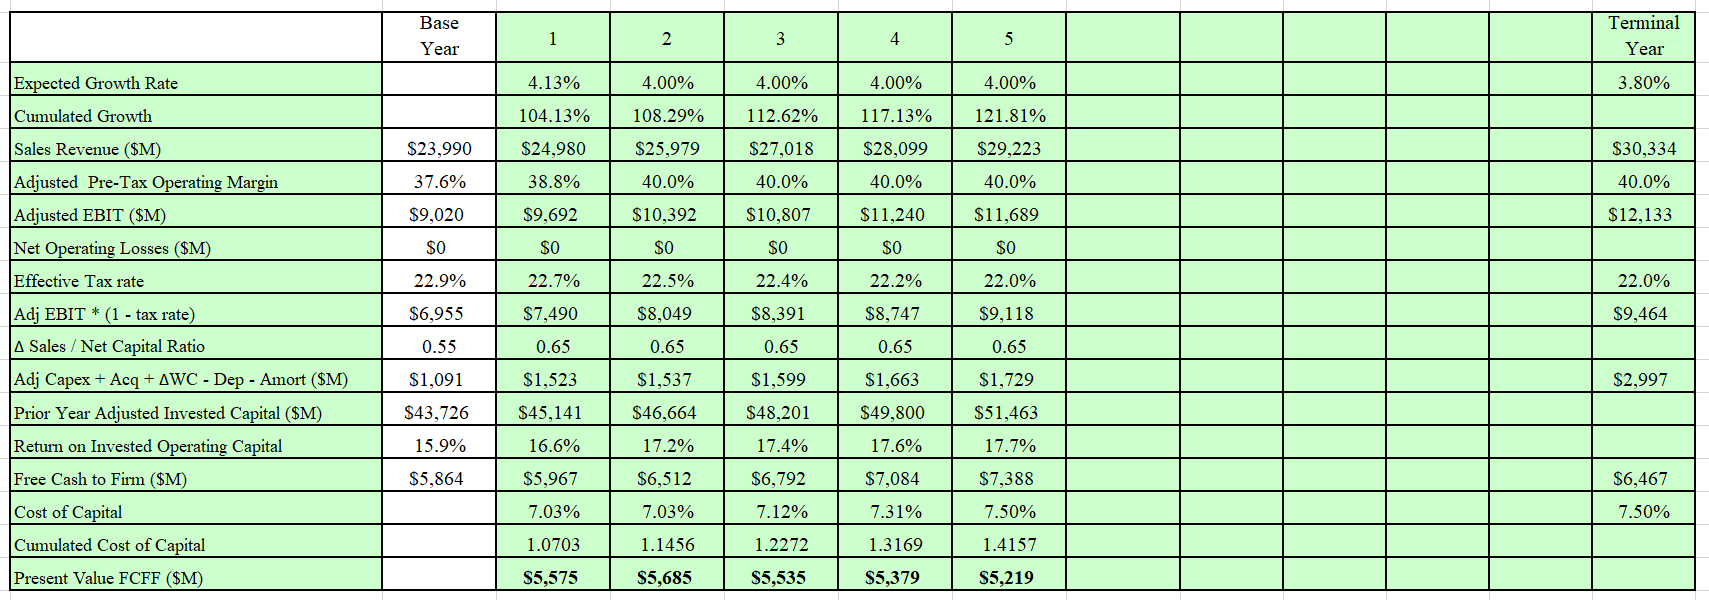
The following table summarizes the key inputs into the valuation:
Author's valuation model inputs.
Discounted Cash Flow Output
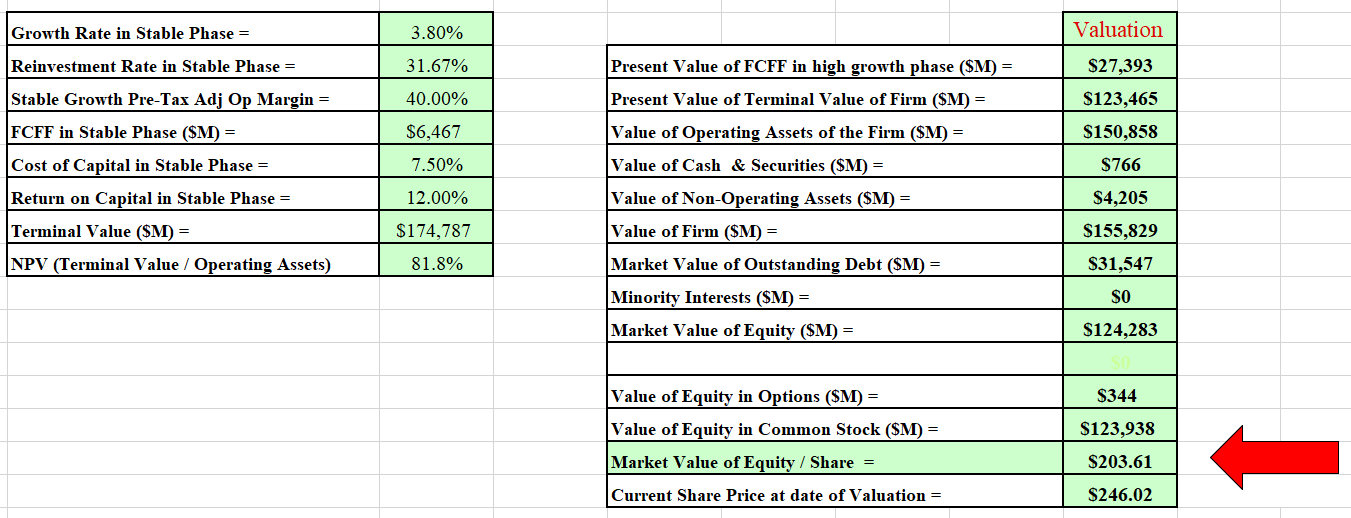
The output from DCF model is in :
I also developed a Monte Carlo simulation for the valuation based on the range of inputs for the valuation. The output of the simulation was developed from 100,000 iterations:
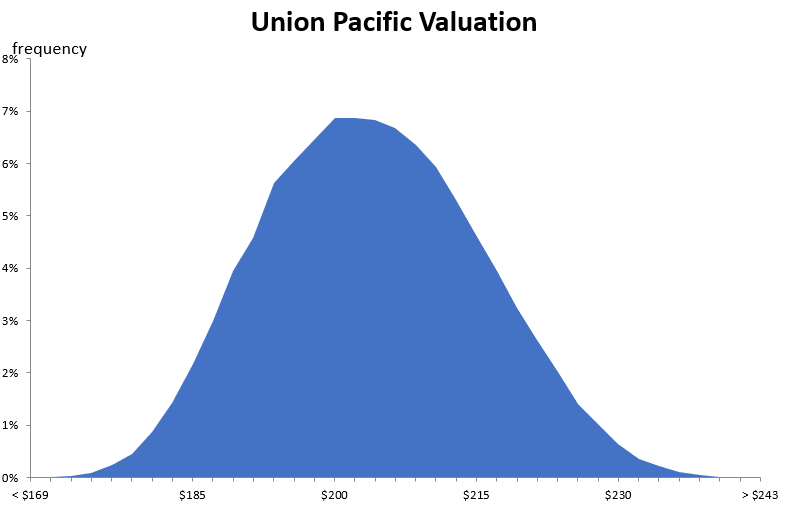
The simulation can help us understand the major sources of sensitivity in the valuation. In this scenario, the valuation is very sensitive to the operating margins and the terminal cost of capital. These two inputs represent the greatest source of risk in the valuation.
The simulation indicates that at a discount rate of 7.5%, the mid-cycle intrinsic value for Union Pacific’s equity per share is between $169 and $243 with an expected value of $204.
Based on my scenario, Union Pacific is currently priced at the top end of fair value.
Final Recommendation
The report has highlighted the cyclical nature of the rail freight sector. At the present time there is considerable global economic uncertainty – will the US economy have a “soft” or “hard” landing?
The rail sector’s volumes and operating margins have been declining for several quarters which is perhaps indicating that something is changing for the worse in the economy. History indicates that a hard landing will do considerable near-term damage to UNP’s business which would no doubt be reflected immediately in the stock price.
Although a year has passed since my last valuation, little has changed in regards to the valuation inputs and consequently the valuation outputs and conclusions.
Readers may get confused by the differences in price between the last year's valuation and today's valuation but it is generally accounted for by the change in stock count caused by FY2023 buybacks and the reflating of last year's value by the current cost of capital.
My valuation indicates that UNP is currently priced at the top end of the valuation range. It is at these levels I recommend that stockholders carefully assess their allocation to the stock and ensure that they are not overweight.
In my previous article I produced a table showing UNP's share price decline which occurred during the last 2 recessions. Investors should take careful note.
What should current holders of Union Pacific stock do?
To answer this question, it is worth reviewing UNP’s historical returns relative to the S&P500 index:
Author's compilation using data sourced from Yahoo Finance.
The table indicates that over the last 3 years UNP has significantly under-performed the broader market index (although it is hard to be unhappy with a 21.8% return) but if you have held the stock for more than 5 years then this situation reverses.
My advice is:
- Ensure that your allocation is not over-weight. Make the appropriate adjustments to bring the holding back to a maximum of the target allocation.
- Do not add to your holding at these prices.
- Carefully monitor the stock’s price action over the coming weeks. The stock has been in a strong uptrend since October. I would aggressively trim my holding if there was a break down in the trend.
I am a holder of Union Pacific stock and I have followed my own advice. My portfolio allocation to the stock is currently at a minimum.
Cyclical Stocks – Golden Rule
My regular readers know that I have a strong preference for cyclical stocks because of the price volatility that happens when there is a cycle change. Let me repeat my rule for cyclicals:
These stocks are not long-term bottom draw investments because of their price volatility. They are wonderful trading stocks and substantial trading profits can be made if investors can identify the turning points in the economic cycle and make the appropriate adjustments to their cyclical holdings.
For further details see:
Union Pacific: Fundamentals Under Cyclical Pressure