SPY - V&M Breakouts: Revealing The Best Long-Term Value Portfolios For Turbulent Markets
Summary
- This is the first 2023 update on the long-term value portfolios consistently beating the S&P 500 since inception with S&P 500 +3.40%, DJIA -2.0% YTD.
- For 2023 the Piotroski-Graham value portfolio is up 15.0%, Negative Forensic Portfolio is up 11.5%, and Positive Forensic up +14.95% not including dividends.
- Results can be further enhanced by adjusting from a long-term buy/hold strategy to using the Momentum Gauge® signals to avoid major market downturns.
- These Value & Momentum Breakout portfolios are released every 6 months each January and July, but measured annually over at least three years.
- Current 1-year+ returns from January 2022 portfolios are beating the S&P 500: Piotroski-Graham +43%, Negative Forensic +33.7%, Positive Forensic +11.7%.
Introduction
This article reviews the three long term buy/hold value portfolios released every January and July for multi-year investing. These value portfolios often get neglected as there is very little excitement or need for trading alerts from holding the same stocks over long periods. The selection of these fundamental and ratio-based algorithm models has been achieved after studying many different portfolio strategies over the years. I have further enhanced the models over time and found that using the Momentum Gauge signals can greatly improve returns by avoiding major downturns. The only three long-term portfolios that I generate two times a year are as follows with links to much more detail in the original January selections:
- Piotroski-Graham Value Enhanced Portfolio
- Positive Forensic Value Portfolio
- Negative Forensic Value Portfolio
VMBreakouts.com
The Piotroski-Graham Value Enhanced Portfolio
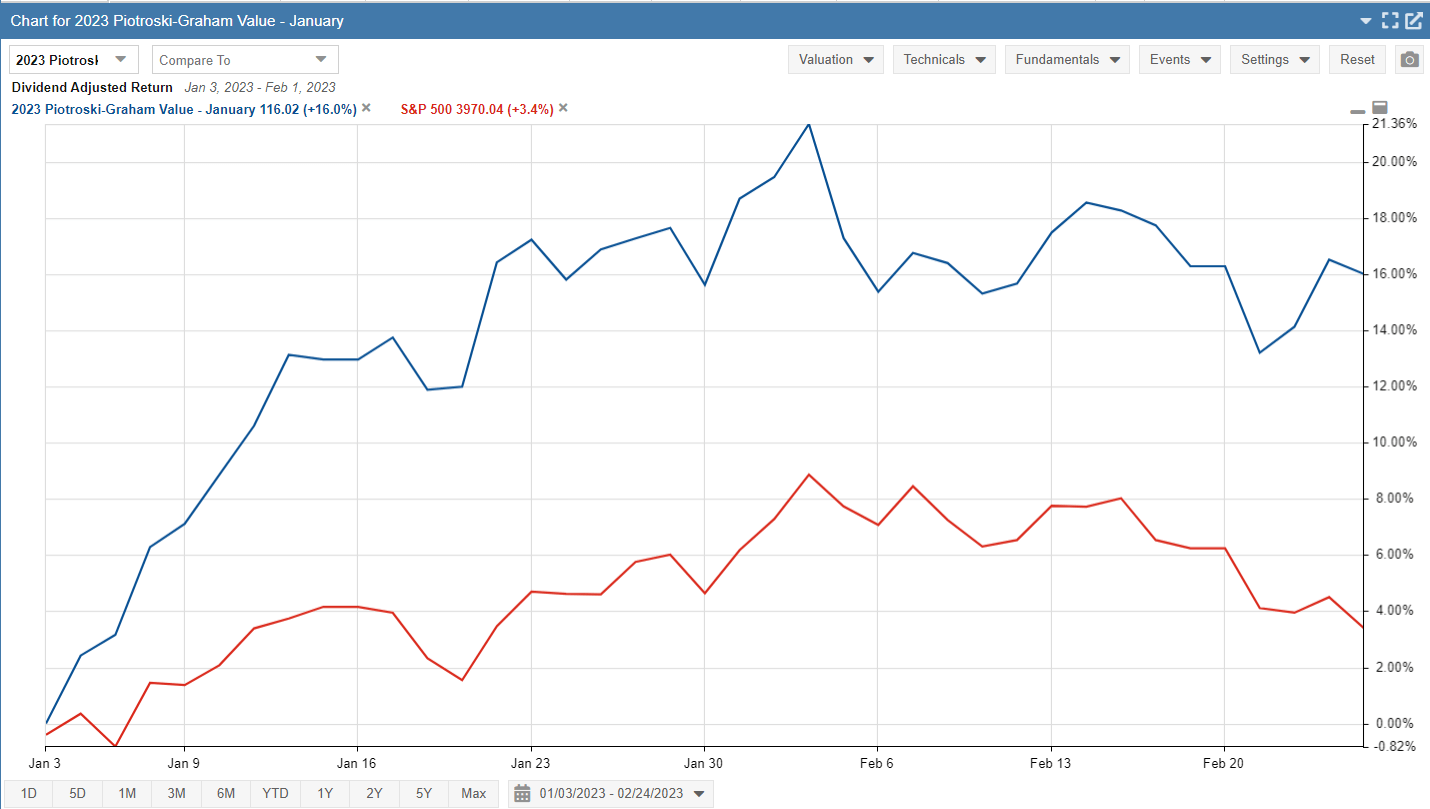
The current January 2023 Piotroski-Graham value portfolio is up 15.03% to start the year. The dividend adjusted returns are +16% with peak gains of +21.4% prior to the negative Momentum Gauge signal in February. The portfolio compared to the benchmark S&P 500 ( SP500 ) is leading by 11.6% to start the year.
Remarkably 9 out of 10 stocks in this portfolio are up over +11.5% YTD with three stocks gaining over 23%. So far Pangaea Logistics Solutions, Ltd. ( PANL ) is one of two stocks with gains over 26% YTD.
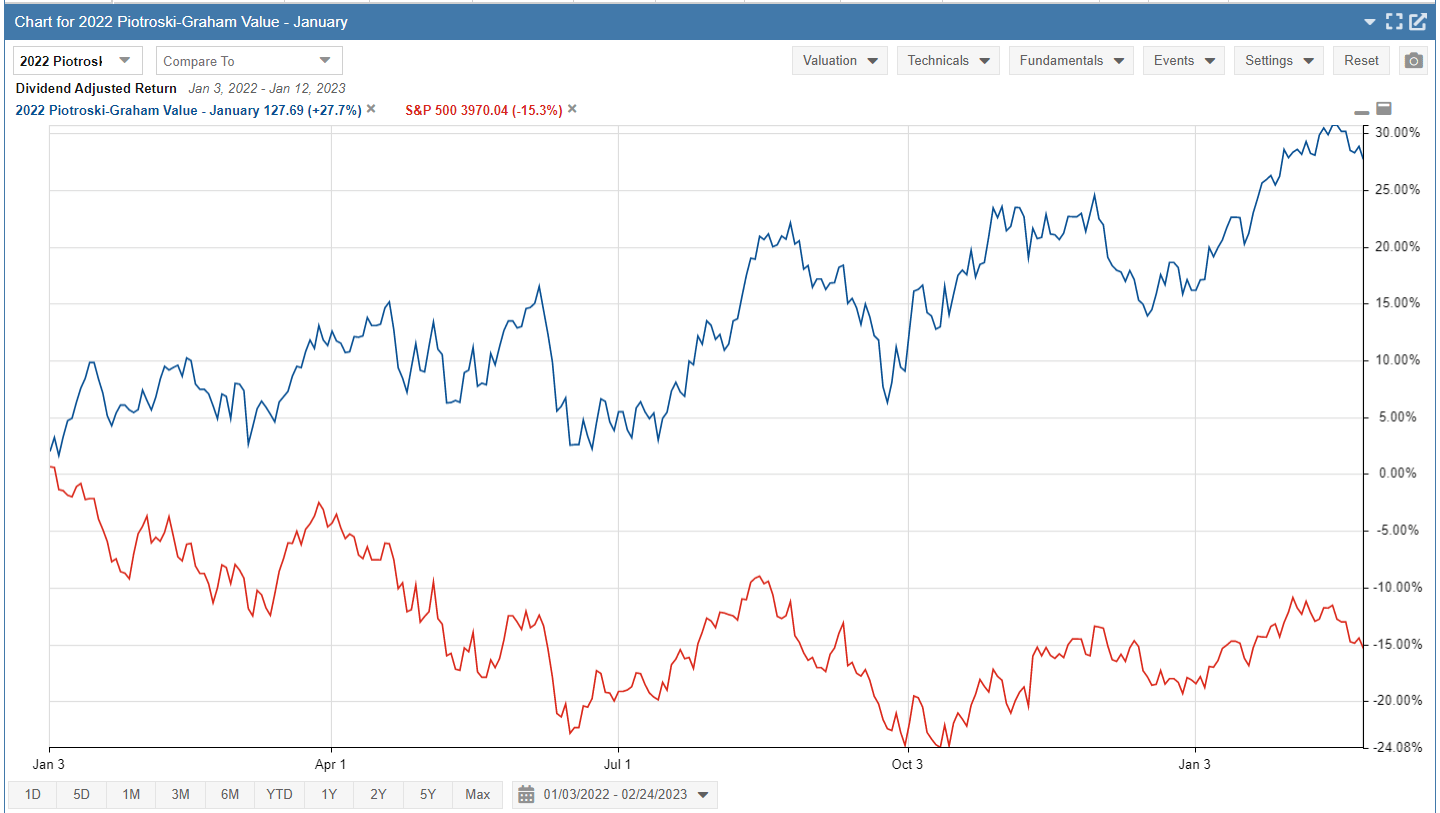
The January 2022 Piotroski-Graham enhanced value portfolio is up +27.7% on a dividend adjusted return basis from last year compared to the benchmark S&P 500 returns -15.3% over the same time period. These returns significantly beat the benchmark last year during one of the worst market downturns and are continuing to extend gains over the S&P 500 to +43% into 2023 as shown below.
Published measurements of the two different value algorithms used by Joseph Piotroski and Benjamin Graham have documented strong positive returns over 2-year periods. Additional enhancements to the combination of these two algorithms have helped to further improve return results.
The Positive Forensic Value Portfolio
Generated from a combination of four different forensic algorithms in published financial literature, this portfolio uses the most positive scoring stocks to produce a long term portfolio. Much more detail and original selections are included in the linked formation article from January in the introduction above.
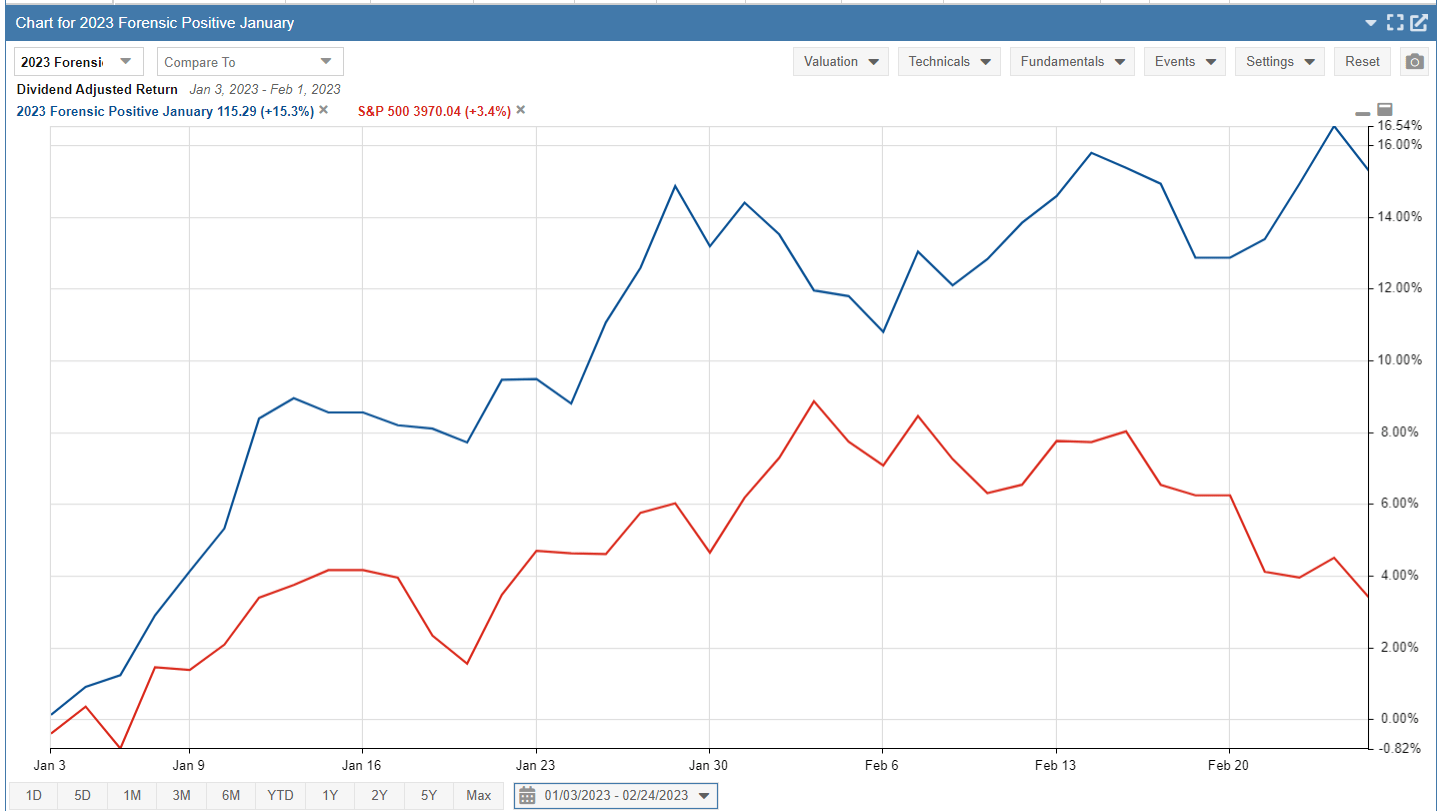
The current January 2023 Positive Forensic value portfolio is up 14.95% to start the year. The dividend adjusted returns compared to the benchmark S&P 500 are +15.3% with peak gains +16.5% this past week. Mesabi Trust ( MSB ) continues +50.8% YTD as the best early performer in the portfolio.
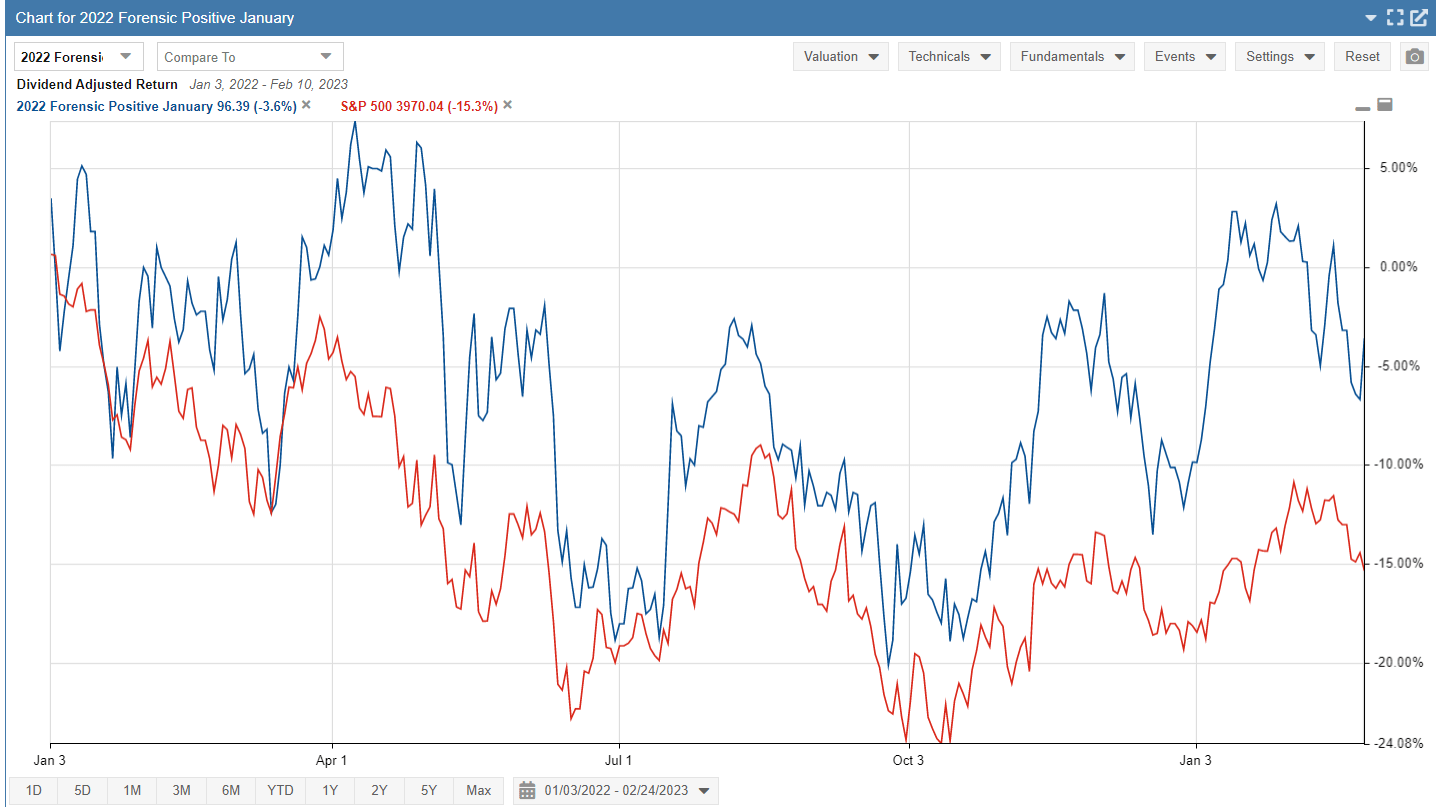
The January 2022 Positive Forensic value portfolio is down -3.6% on a dividend adjusted return basis from last year compared to the benchmark S&P 500 returns -15.3% over the same time period. These returns also beat the market last year during one of the worst market downturns and are continuing to extend gains over the S&P 500 to +11.7% into 2023 as shown below.
Lastly, the January 2021 Positive Forensic value portfolio is up +59.9% on a dividend adjusted return basis from 2021 compared to the benchmark S&P 500 returns +8.9% over the same time period. These returns significantly beat the market, but importantly you can see just how much the market volatility has changed since the Fed QE 4 stimulus program ended in early 2022.
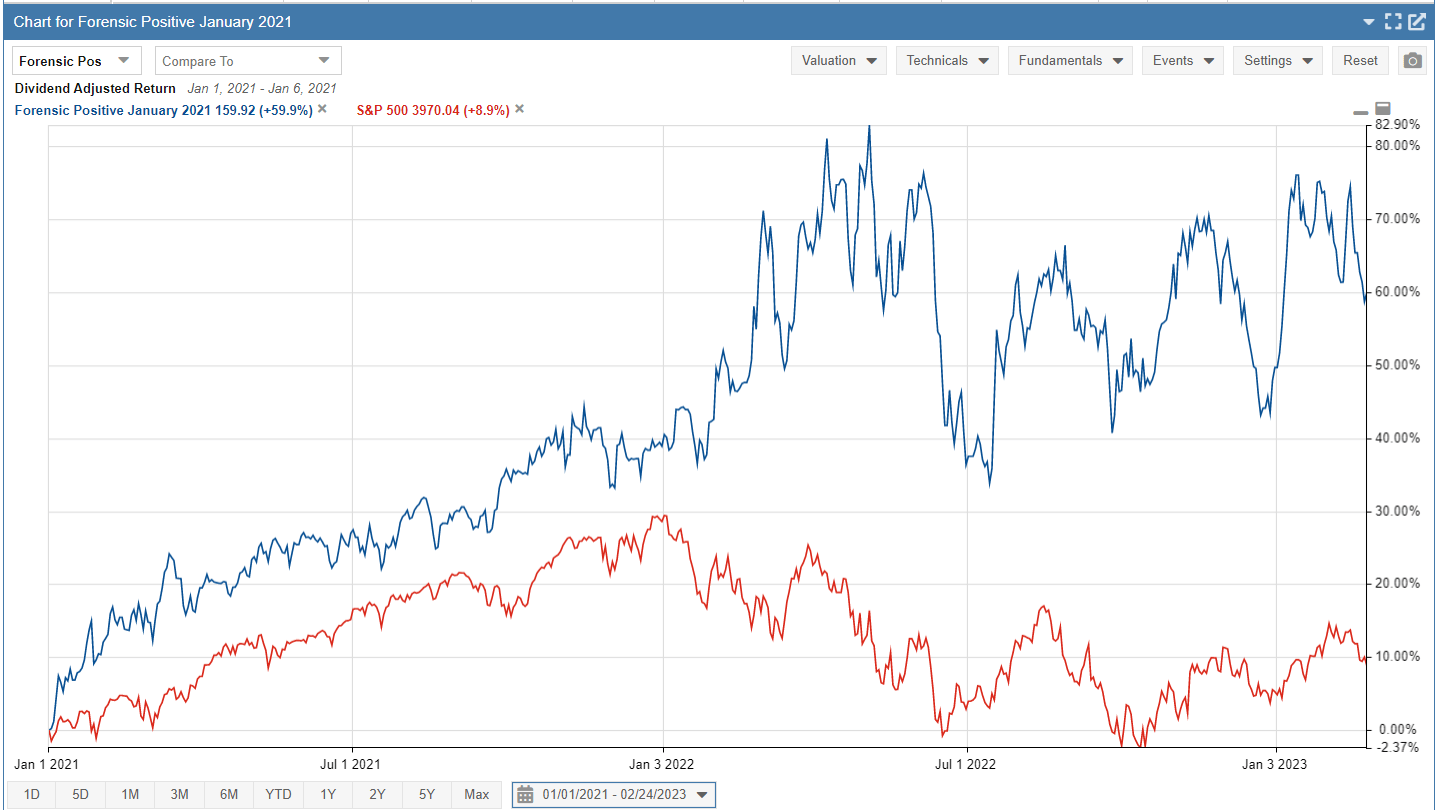
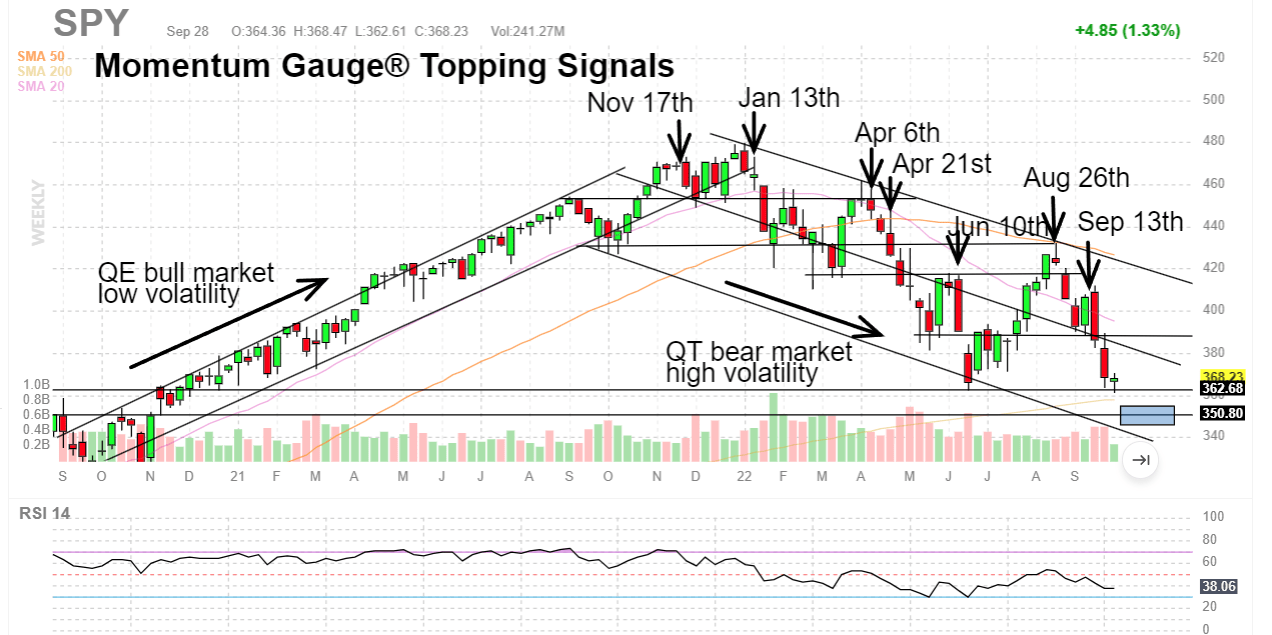
You can see the shift clearly on the S&P 500 fund ( SPY ) weekly chart below as the market changed from the Fed's QE 4 stimulus regime to the largest tightening QT program in US history. Until the Fed ends the tightening policy we can expect much more volatility through the year as I have written about in many forecast articles.
The Negative Forensic Value Portfolio
Generated from a combination of four different forensic algorithms in published financial literature, this portfolio uses the most negative scoring stocks to produce a long term portfolio. Much more about why anyone would want to buy negative scoring forensic stocks is explained in the selection article linked in the introduction above.
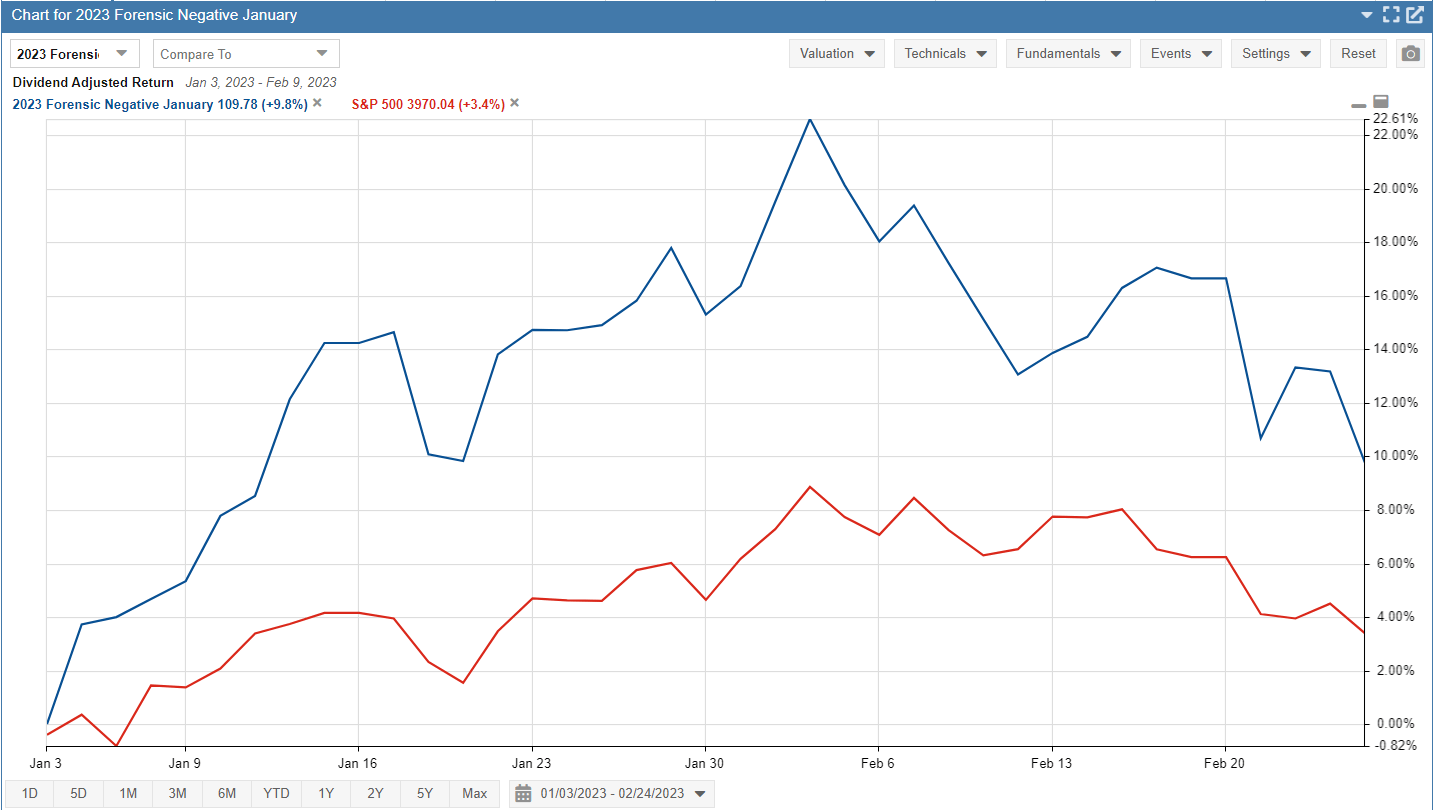
The current January 2023 Negative Forensic value portfolio is up 11.48% to start the year. The dividend adjusted returns compared to the benchmark S&P 500 are +9.8% with peak gains +22.6% ahead of the negative Momentum Gauge signal for February. Volatility in this portfolio has been extremely high with two stocks gaining over 80% in January as market exuberance peaked. Marinus Pharmaceuticals, Inc. ( MRNS ) is up +60.8% still among the top performers in the portfolio.
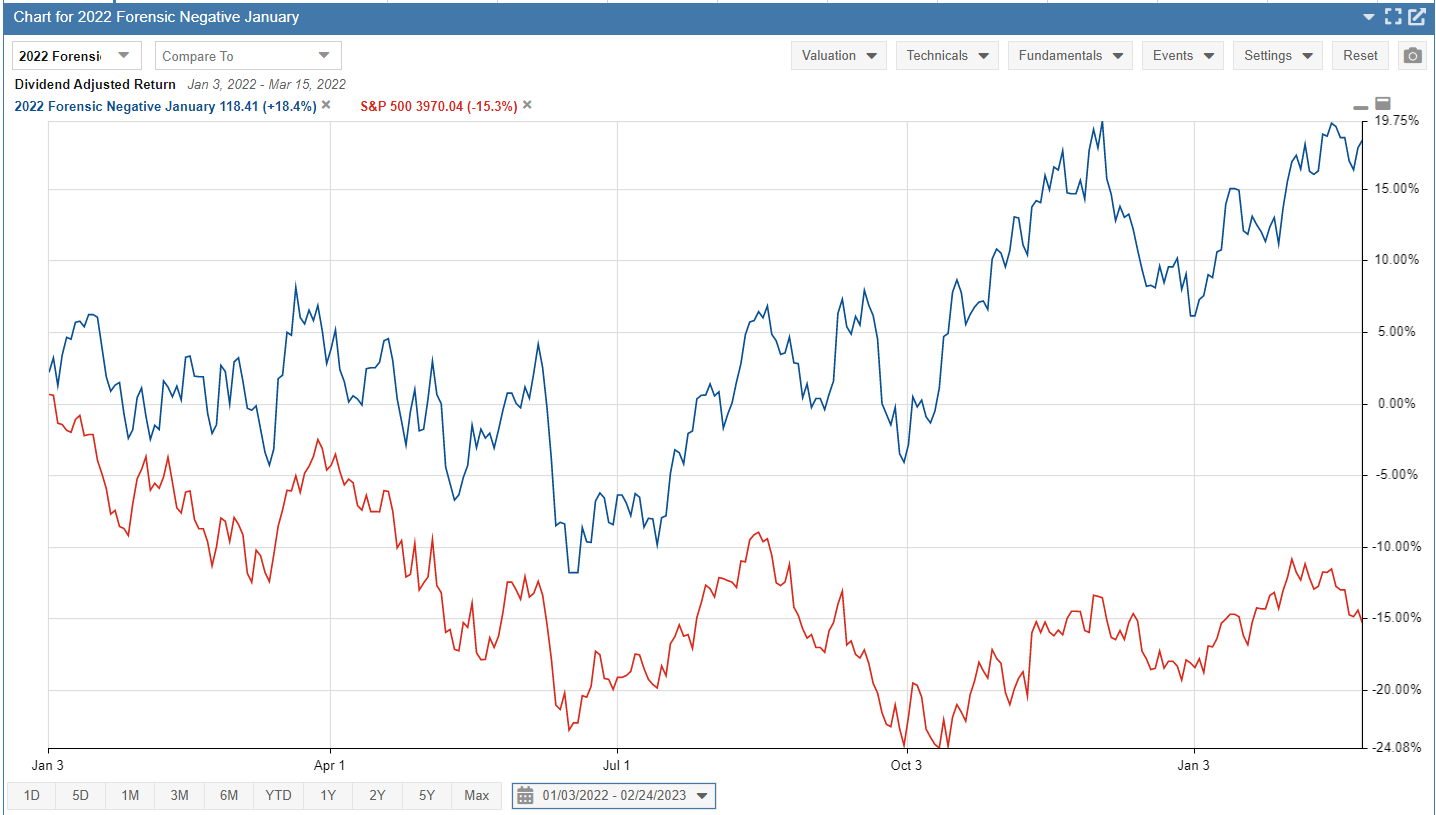
The January 2022 Negative Forensic value portfolio is up +18.4% on a dividend adjusted return basis from last year compared to the benchmark S&P 500 returns -15.3% over the same time period. These returns also beat the market last year during one of the worst market downturns and are continuing to extend gains +33.7% over the S&P 500 into 2023 as shown below.
Conclusion
Over the course of my public research, 44 forensic portfolios (22 positive forensic value / 22 negative forensic value) have been formed for evaluation since the testing period began in July 2017. Additionally, 23 Piotroski-Graham algorithm combination portfolios have been created in the same period to test the strength of these two models working together with additional enhancements.
Across many multiple one-year test periods we are seeing strong differentiation in results between negative and positive forensic portfolios. Most notably, delistings of stock symbols (merger, acquisition, leaving the exchange) are approximately 10x higher among negative forensic stock selections than for positive forensic stocks. We also see that price behavior is more stable among individual positive forensic selections, but that unusually larger returns appear from the negative portfolios. Overall the negative forensic stocks have been producing higher returns, but with larger variability and at a much higher rate of mergers/delisting.
The combination portfolio of Piotroski-Graham enhanced value stocks has delivered the most stable and consistent returns over the last six years of measurements in my research. Fewer stocks have outperformed with unusual breakouts like the negative forensic stocks, but the value results have been more positively consistent over longer periods.
I trust this research and stock selections will give you added value to your long term investment goals and returns in 2023!
JD Henning, PhD, MBA, CFE, CAMS
For further details see:
V&M Breakouts: Revealing The Best Long-Term Value Portfolios For Turbulent Markets